
Chapter 3. Performance Testing
“Time is money!”
Benjamin Franklin
Sometimes, our favorite websites suddenly become as slow as sloths, leaving us wondering - ‘Is there a problem with my internet?’! Remember waiting an eternity during the Cyber Monday sales for the website to load? Or staring at the loading icon for the train tickets to show up when you are dying to book your Christmas vacation? Or left hanging on the booking page of a blockbuster movie? These are some day-to-day instances where we, as customers, feel intense frustrations due to poor website performance!
If you want to save your application’s end-users from such frustrations, you have to continuously measure and improve the performance of your application. This chapter aims to equip you with the essentials around measuring or testing performance—specifically topics like performance KPIs, API performance testing, front-end performance testing and shift-left performance testing are covered.
Performance, Sales, and Weekends Off Are Correlated!
We spoke about customers being frustrated because of application performance earlier. We need to understand what it leads to. How does a few seconds delay really matter? Indeed, there is a quantitative indicator called the ‘Bounce rate’, which tells how customer’s frustrations lead to loss in business. Bounce rate captures the number of customers that leave the website after viewing just one page!
Among all the other factors that would increase bounce rate, website performance has been the major contributor. Statistics published by Google (see Table 3-1) show the correlation between page load time and user bounce rates.1 The data confirms that with every additional second delay, businesses lose their customers to their competitors.
| Page Load Time | Increases the probability of bounce by |
| 1 - 3 seconds | 32% |
| 1 - 5 seconds | 90% |
| 1 - 6 seconds | 106% |
| 1 - 10 seconds | 123% |
Google also ranks the slower websites lower in their SEO (Search Engine Optimisation) algorithms. So that pushes your website further down into the abyss if it is not performant enough! According to Maile Ohye in her online webmasters class in 2010, Google, one of the best-in-class websites, aims for under a half-second load time.2
Losing customers translates to losing sales. Indeed businesses lose a heavy cut; like in 2018, when Amazon failed to handle traffic loads on their Prime Day sales, the estimated loss was around $72 million! Lousy performance can lead to a loss of reputation for the brand as well. Especially, when the world is tightly connected over social media, bad reviews spread so rapidly.
On the flip side, a slight increase in performance can result in significant improvement in sales. For instance, in 2016, The Trainline, a train operating company in the UK, reduced load time by 0.3s, and revenue increased by an extra £8 million ($11 million) a year. Similarly, Mobify has observed that every 100-millisecond decrease in homepage load time increased the annual revenue by $380,000.3 The correlation between sales and performance makes it clear that the first step to improving sales for an online business is to look at their application’s performance. This means we need to build and test for performance early and frequently i.e., shift your performance testing to the left!
My motivation to focus on website performance early is straightforward - I love my weekends and want to spend them leisurely. Since performance issues are very costly and directly affect the brand reputation, software development teams are under high pressure to fix them ASAP! Forrester’s research showed that software teams that don’t focus on performance at the earliest end up fixing 100% of performance issues directly in production.4 So, if you do not incorporate performance testing early and often during the SLDC, you can expect to pay for it by working on weekends (and long hours) later to fix the performance issues!
Simple Performance Goals
Performance, in simple terms, is the ability of the application to serve a vast number of concurrent users without significant degradation in its behavior compared to when it is serving only a single user, provided overall behavior stays within the end-user acceptable limits. So, to test for performance, firstly you need to seal the expected number of peak-time users for your application and then ensure if the performance is within the end-user acceptable limits.
There are studies to tell us what the end-user acceptable limits are:
-
According to Jakob Nielsen, when the response time of the site is 0.1 second, the user feels the behavior was instantaneous.5
-
Similarly, when the response time is 1 second, they feel the delay but are still in control of the navigation on the website.
-
And, from the Google statistics we saw earlier, beyond 3 seconds we are at a risk of losing the majority of the customers. Google, indeed, recommends to keep the page load time less than 2 seconds at least from the second visit onwards.
These are your performance goals. To achieve such good results, a lot of infrastructure tuning and code optimization needs to happen in many iterations before going live—yet another reason to shift your performance testing to the left.
Factors Affecting Application Performance
Achieving the performance goals is not that easy. There are so many factors in an application that challenges us in the path. Let us look at some of the factors that affect application performance now.
Architecture design
Architecture design plays a vital role in contributing to the performance of a website. For instance, when the services are not sliced appropriately, it will lead to numerous service calls delaying the response time. Similarly, when appropriate caching mechanisms are not implemented at the right levels, it will affect the website performance too.
Choice of tech stack
Different stacks of the application need a varied set of tools. If not considered keenly, the tools may fail to work together coherently, affecting the performance. An example of tech stack impacting performance is how different runtime environments (e.g Java, RUST, Go, C#) have a minor difference in AWS Lambda cold startup time.
Code Complexity
Bad code often leads to performance issues due to cyclic dependencies, long operations, missed validations, duplicate validations, etc. Consider the case where a search is done with empty values. What would be optimal is for the search service to do a simple input data validation and fail the request quickly. If not, the service searches the database for empty values and returns an error later, delaying the response time unnecessarily.
Database performance
Every database comes with its SLAs for processing time. If your application requires very high performance, choosing suitable databases and the proper format for storing data will be critical. For instance, storing the order data in parts across multiple tables will require consolidation and delay retrieving the final order. So depending on the domain, structuring the data properly with performance in mind is essential.
Network Latency
The central nervous system for any application is the network. All components access each other via some kind of network communication - WAN, LAN, etc. So, having good connectivity between components in the data center where they are hosted is crucial. The end-users across the globe reach the application using the network as well. We cannot take network connectivity for granted. Indeed, most users will be on mobile networks with weak signals. So, if your website is designed to be heavy with images or involves substantial data transfers, better to test the system with various network throttling conditions early.
GeoLocation of the application and users
If the users of your website are only from a particular region, then having the website hosted physically closer to the region will reduce the network hops and hence the latency. For example, if the website is for European customers but is hosted in Singapore, there will be multiple to-and-fro network hops to connect to the system. If a website intends to serve customers across the globe, there should be a strategy to replicate the application’s hosting in closer geolocations (or use CDNs). If you use cloud infrastructure, you should remember to request physically closer machines to the end customers, because a common mistake is getting a machine closer to the development team’s location.
Infrastructure
Infrastructure is the skeleton that supports all the muscles of a system. The power of infrastructure in terms of CPU, memory, etc., will directly impact the system’s ability to take the load. Designing infrastructure to deliver a high-performing system is an art in itself. Infrastructure engineers continuously collect the results of the performance tests as one of the parameters to plan the infrastructure needs of the application.
Third-party integrations
When there are integrations with third-party components, the application is dependent on that component’s performance. Any latency in that component will eventually add to our application’s performance. For example, a typical retail application integrates with third-party payment services, vendor’s product information management systems, warehouse management systems, etc. So choosing a performant accomplice is vital.
In this section, you saw a high-level view of multiple factors that add up to the application’s performance. The factors are also variables i.e., they change over the course of delivery. Sometimes, they tend to be mutually exclusive, forcing us to make tough decisions. Shifting your performance testing to the left will guide the team as a north star in handling the volatile nature of the application performance. Also, it is equally important to consider these factors during performance testing. For instance, have a performance testing environment that is very similar to the production environment in terms of network, infrastructure, etc., as otherwise, you may not have an accurate measure of performance!
Key Performance Indicators
Measuring the application performance means to capture the quantitative key performance indicators (KPIs) that will help the team to course-correct their way throughout development. The earlier you measure them, the minor the corrections are. The following are three such quantitative KPIs.
Response time
Response time refers to the time taken by the application to answer any query made by the user. For example, what is the exact time taken to show the results of a product search to the customer? The average response time for web applications is at 3 seconds, beyond which we face the risk of losing the majority of our customers.
Concurrency/Throughput
Usually, there will be more than a single user accessing the application at any given time. Indeed, some of the high-speed applications such as the stock exchange sites will have millions of transactions happening within a second. As previously mentioned, measuring the total number of concurrent users the application can support successfully will help to scale the application. For example, the application can respond within 3 seconds for 500 concurrent users.
Although ‘concurrent users’ is a commonly used term by the businesses and teams, when we think from the system’s perspective, it receives various requests from end-users and other components, which are queued and picked for processing one after the other by a few parallel threads. Hence, the number of concurrent users indicator doesn’t sit well while thinking from the system’s perspective. A better indicator to measure here will be the ‘throughput.’ Throughput measures the number of requests the system can support during an interval of time.
To understand this better, consider the analogy of cars crossing a very short bridge on a highway in respective car lanes. Let’s say there are four car lanes. Given the type of car, it can swiftly pass the bridge in the range of a few hundred milliseconds. So in a second, the total number of cars crossing the bridge will be 30 to 40. This value of 30 cars per second is the throughput.
Concurrency and throughput are both helpful in server capacity planning and are often used in different contexts to make wise decisions.
Availability
‘Availability’ means the system responds to the users at the same expected performance for a given continuous period. Typically, the websites are expected to be available 24 / 7 except for planned maintenance. Availability is an essential criterion to test because the applications may perform well for the first half-hour. Then responses could degrade over time due to memory leakage or parallel batch jobs consuming the infrastructure capacity or any such unpredicted reasons.
The next step is to understand how to measure these key performance indicators.
Types of Performance Tests
To measure the KPIs, you need to design performance tests accordingly. The following are the three of the most common types or designs of performance tests.
Load/Volume tests
We need to validate if the system performs well for a given volume of users expected by the business. For instance, the search functionality should respond within 2 seconds for a volume of 300 users. The performance test to simulate the volume and validate if the system meets the required targets is called ‘volume tests.’ We may have to repeat such tests multiple times to observe consistency and measure the average to benchmark the application.
Stress tests
The system’s performance will start degrading when more users are stressing it. We need that exact measure of load when the system gets stressed. This number is vital for scaling the application in scenarios like expanding to new countries or peak sales. Normal system behavior is that it performs well for X users. Beyond X users, delays creep into the response time. Finally, at X+n requests, the system responds with errors. We need to know these figures. To get that, we can design the performance test to slowly increase the load on the system, beyond the volume test limits, in small steps and study precisely where the system breaks down. This process of stressing the system to find the breaking point is called ‘stress testing.’
Soak Tests
When the system runs with good volume for a while, there may be degradation in response time due to infrastructure issues or memory leakage, etc. The performance test designed to keep the system under a constant volume of load for a prolonged period and measuring KPIs is called the ‘soak test.’
While designing these tests, a key point to note is to keep them realistic to avoid overheating the application with extreme situations that may never occur. For instance, not all users are logging into the application at the same instant of time. A more realistic use case is that the users log in gradually with a few milliseconds gap. This behavior is called the ‘Ramp-Up.’ Our test cases should include such a realistic design; let’s say, 100 users are ramped up in 1 minute.
Further, users are not robots who perform a login, search for a product, and buy a product within milliseconds. But test cases might end up being designed that way unfortunately. Practically, users take at least a few seconds to think between their actions and take minutes to complete a user flow like buying a product after logging in. This is called the ‘think time’ in performance testing terms. We need to include appropriate think time in our test cases to spread the user actions apart a few seconds or minutes and make it realistic.
Types of Load Patterns
The performance test cases are nothing but simulating different load patterns on the application. Different load patterns can be generated using these three key parameters: ramp-up time, think time, and the number of concurrent users. Following are some of the commonly tested load patterns:
Steady Ramp-Up Pattern
In the steady ramp-up pattern, the users are steadily ramped up within a given period, and then the load is maintained constantly for a sustained period to measure performance. Refer to Figure 3-1. This is typically the scenario in most real-world applications, such as during the Black Friday sales, where the users gradually but steadily come into the system and stay there for some time before dropping out progressively.

Figure 3-1. Steady Ramp-Up of users
Step Ramp-Up Pattern
With the step ramp-up pattern, users are ramped up in batches periodically. For example, 100 users every 2 minutes. Refer to Figure 3-2. This is to observe and measure the system’s performance for each step count of users, which will help benchmark the application for different loads. Step Ramp-Up pattern will be used in performance tuning and infrastructure capacity planning.
Note
Benchmarking is to record the response time with a single user and measure the average from repeated runs.
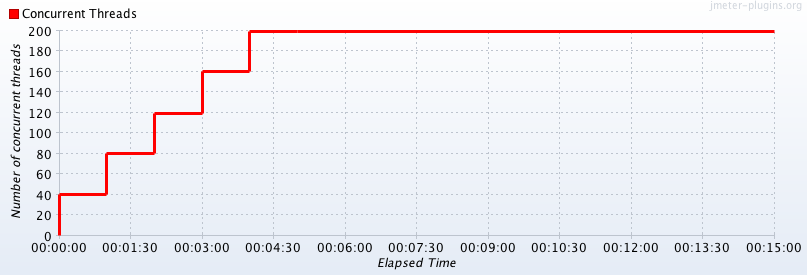
Figure 3-2. Step Ramp-Up of users
Peak-Rest Pattern
The peak-rest pattern is when the system is ramped up to reach peak load and then ramped down to complete rest in repeated cycles. Refer to Figure 3-3. This scenario could be true in some applications like social networking, where the peak comes and goes in cycles.
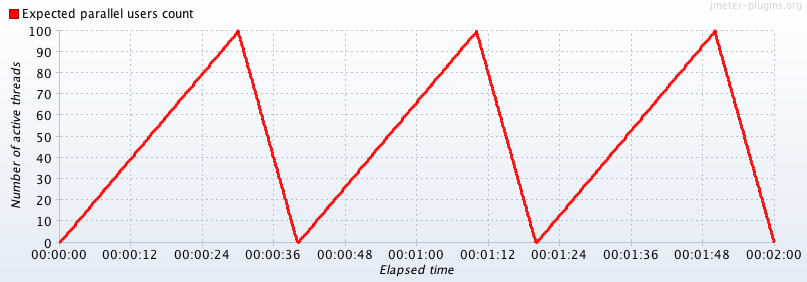
Figure 3-3. Peak-Rest Load Pattern
As you’ll see later in this chapter, performance testing tools will allow you to configure these patterns to fit your needs.
Performance Testing Steps
Now that we’ve discussed the importance of performance, KPIs, and load patterns, next is to know the performance testing steps. Use these steps to plan the necessary time and capacity for shifting your performance testing left.
Define the Target KPIs
The first step is defining the target KPIs based on business needs. The best way to start thinking about the target numbers is to think about them qualitatively and then translate them into numbers.6 For instance, qualitative thinking about performance could lead to goals such as:
-
We should be able to scale the application to one more new country.
-
We should be able to perform better than our competitor X.
-
We want to do better than the last version of the application.
These qualitative goals naturally lead towards the next steps. If the goal is to do better than the last version of the application, we need to measure the performance numbers of the earlier version and see if our current numbers are better. Similarly, if we know the competitor’s performance numbers, we need to validate that our numbers are better than them.
Note
TIP: Business folks tend to call-out performance numbers which may not be the actual usage pattern. Derive the target KPIs from data always.
-
If there is an existing application, analyze the production data to arrive at KPIs and load patterns.
-
If you are building a new application, ask for competitors’ data.
-
If the application is completely new with no reference data, still use data around country wise internet usage, probable peak duration, etc., to work out your target KPIs.
Define the Test Cases
The second step is to use the load patterns and the performance test types to define the different performance testing cases. Our test cases should be around measuring availability, throughput, and response time for all critical endpoints. We need to include both positive and negative scenarios for performance testing as sometimes negative scenarios take more time to respond. The test cases will reveal the test data setup needed to run the test cases.
Prepare the Performance Testing Environment
The performance testing environment should be as close to the production environment so that you can get realistic results. It will also help you to identify any performance bottlenecks in environment configurations.
When we say as close to the production environment, we mean:
-
The respective tiers/components need to be deployed in a similar fashion as in production.
-
Machine configurations like the number of CPUs, memory capacity, OS version, etc., should be similar.
-
The machines should be hosted in the respective geolocation in the cloud.
-
Network bandwidth between machines should be similar.
-
Application configurations like rate limiting should be precisely the same.
-
If there will be batch jobs running in the background, those should be in place. If there are emails to be sent, those systems should be in place too.
-
Load balancers, if any, should be in place.
-
Third-party software should be available at least in a mocked capacity.
Getting a production-like environment is often challenging due to additional costs involved, though we get cheaper cloud provisions. It is a matter of cost vs. value conversation. If you don’t win that battle, prepare to make meaningful tradeoffs on the performance environment setup. Also, it is worth raising to the respective stakeholders early that the performance numbers measured with such tradeoffs might not be foolproof.
Note
A best practice is to request the performance testing environment aside from the QA environment right at the beginning of the project so it’s available when you need it.
Apart from the performance test environment, we also need a separate machine to be the test runner i.e., to run the performance tests. Plan to have individual test runners hosted in different geolocations (this is possible with cloud providers) to observe the respective performance behaviors with network latencies from multiple countries, if your application is intended to serve a global audience.
Prepare the Test Data
Just like how the performance testing environment should be as close to the production environment, the test data should be as reflective as the production data. The performance numbers that you will measure will greatly depend on the test data quality and hence this is a critical step. An ideal situation will be to use the same production data after anonymizing the sensitive user information as it will reflect the actual database size and complexity of data. However, you may find blockers in getting the real production data due to security issues in certain situations. In such cases, prepare the test data that exactly mimics the production data.
Few pointers around creating test data are: -
-
Estimate the size of the production database (e.g., 1 GB or, 1 TB) and set up scripts to populate the test data. It may be necessary that for each test run, the test data must be cleaned and repopulated. So, having the test data creation scripts will be handy.
-
Create variety in test data similar to production. Instead of ‘Shirt1’, ‘Shirt2’ etc., use actual production-like values such as ‘Van Heusen Olive Green V-Neck Tshirt.’
-
Populate a fair share of erroneous values like addresses with spelling mistakes, blank spaces, etc.
-
Have similar distribution of data representing factors like age, country, etc., closer to production.
-
You may have to create a lot of unique data like credit card numbers, login credentials, etc., to run volume tests with concurrent users.
Yes, preparing the test data can be a tedious job! These activities need to be planned well ahead of time in the release cycle. It’s impossible to squeeze it in later as an afterthought and if you did, the test data might not be of good quality resulting in inaccurate performance numbers.
Integrate APM Tools
The next step is to integrate application performance monitoring (APM) tools such as New Relic so that we can see how the system behaved during the performance tests. These tools greatly help while debugging performance issues. For instance, requests may fail during performance test runs due to insufficient memory in the machine, which the APM tools will expose easily.
Script and Run the Performance Tests Using Tools
The last step is to script the performance test cases using tools and run them against the performance testing environment. There are many tools to script and run the performance test cases in a single click and also integrate them with CI to help us shift left. JMeter, Gatling, k6, Apache Benchmark (ab) are some of the popular kids in this playground. These are open-source tools. There are also commercial cloud-hosted tools like Blazemeter, Neoload, etc. Some of these tools provide simple user interfaces to configure the performance tests and don’t require coding. We can get test run reports with graphs, while commercial tools even offer a dashboard view. I will detail how to create test scripts and integrate them with CI using open-source tools in the next section. Performance test runs may actually take time from a few minutes to a few hours depending on the test. So, do a dry run of the scripts with a lesser user count before starting the full fledged test run.
Those are the six performance testing steps. The key to successfully execute all the six steps is to plan capacity for them adequately. Also, plan time and capacity to run the tests, collect reports, debug and fix performance issues, and do server capacity tuning which will complete the entire performance testing cycle!
Performance Testing Exercise
Let us go over the performance testing steps starting from defining the target KPIs to scripting the tests using an example application. For our discussion, we will be using an online library management system where admin users can add, delete books, and customers can view all the books and search a book by its ID. The Rest APIs /createBooks, /deleteBooks, /books and /viewBookByID perform the respective actions in the backend. Let’s get started!
Define the Target KPIs
To arrive at the target KPIs for our library application, assume we got the following data from the business and their in-house marketing team:
-
They are campaigning aggressively for the launch in two European cities and expect 100,000 unique users to join in the first year.
-
They have a study that said users spend 10 minutes on average searching for books, viewing similar books, etc., in a single session.
-
The study also said that a typical user might borrow a book twice every month on average. Hence might access the site twice a month.
-
In Europe, the users are active on the internet between 10 a.m. and 10 p.m. (12 hours) daily.
With that data, we can calculate the following:
-
Total users accessing the site monthly = 100,000 users *2 accesses per month = 200,000 monthly users
-
Average users per day = 200,000 monthly users ÷ 30 days per month = 6,667 daily users. (Note, there could be more users during weekends than weekdays, but we are calculating average users)
-
Average users per hour = 6,667 average daily users ÷ 12 hours per day = 555 hourly users. (Similarly, hourly users could be more during lunch or evening times)
-
To include peak performances, we can be generous and round up to 1000 hourly users.
-
Each user uses the website for a session time of 10 minutes, which is 0.166667 hours.
-
Number of concurrent users = 1000 peak hourly users * 0.166 = 166 concurrent users!
Based on our calculations, these are our target KPIs:
-
For 166 concurrent users, the system should respond within 3 seconds.
-
System throughput has to be 1000 users per hour.
We can get a consensus with the client management on these numbers before we proceed. We can also probe the business to think beyond the first year and check again for target numbers.
Note
This is only a sample calculation to give an idea of how to work out target KPIs. However, the first place to dig, as mentioned earlier, is the existing application’s production data or the competitor’s data, which will give a more accurate picture of KPIs and load patterns.
Define the test cases
Now that we know our target KPIs, we can define appropriate performance test cases based on the library application’s features. Let us recollect the factors we discussed earlier momentarily. The test cases for the library application could include:
-
Benchmark the response times for all four endpoints - /createBooks, /deleteBooks, /viewBookById and /books.
-
Benchmark the response times with negative test cases in all of the four endpoints. Examples of negative test cases here could be deleting a book that doesn’t exist in the library. As discussed earlier, error cases might take more time due to missed validations compared to positive responses.
-
Volume test with 166 - 200 concurrent users for /viewBookById and /books endpoints and validate response time to be less than 3 seconds. Admins only access the other two endpoints; hence volume testing may not be necessary for them.
-
Stress test the customer-facing endpoints with ramp-up steps of 100 users and find the breaking point.
-
Validate throughput of 1000 users in one hour. The user flow could be to select a book from the page where all the books are listed. After skimming the contents of the chosen book, they go back to the page where all books are listed to select a new book again. Users will continue doing this for a total session time of 10 minutes. Include a think time of 45 seconds between each of these actions. Ramp up 10 users every 30 seconds.
-
Soak test for continuous 12 hours to validate that the system is available to users continuously. We could reuse the above throughput test design to run for 12 hours, too, if it is successful.
The remaining steps
I have created and deployed my sample library management APIs in the performance testing environment. I have also functionally tested them once to make sure they are working smoothly. I have set up 50 books as test data. I did it by writing a script in JMeter which I will explain in the tools section. Assume that I have integrated an APM tool too. Last step is to script and run the tests using tools. I will show how to script the library app’s test cases using tools like JMeter, Gatling and Apache Benchmark in the next section.
Performance Testing Tools
As mentioned earlier, the performance testing tools help us to script the different performance test cases. They give us the essential handles like the number of concurrent users, ramp-up time, and think time to configure the load patterns as per the test case. Each tool provides a different way to configure these handles—for instance, JMeter gives GUI, Gatling uses domain specific languages (DSL), and Apache Benchmark (ab) takes these handles as simple command-line arguments. Let us explore each of them to script our library app’s test cases.
JMeter
JMeter is a well-evolved and popular tool in the performance testing space. It is entirely open-source with provisions to integrate with CI and generate beautiful graph reports. It integrates with Blazemeter, a cloud-hosted performance analytics tool if you want to be free from infrastructure management tasks. JMeter is based on Java, and there is a community of active developers who contribute to different valuable plugins. The figures in the “Types of Load Patterns” section are from one of the plugins as well. There is good documentation and tutorials on many use cases, too, for beginners. Let us install the tool and write test scripts for our library application.
To install JMeter, download the zip file from JMeter’s official site. Make sure your local Java version is compatible with the required version for JMeter. Also, ensure the JAVA_HOME variable is set in your environment bash_profile. To open JMeter GUI, run the shell script .jmeter.sh, inside the folder /apache-JMeter-version/bin from the terminal.
The JMeter plugins are pretty helpful as well.You can download the plugins manager from the official site and place the jar under /apache-JMeter-version/lib/ext. After that, restart JMeter. You should then see the menu Options->Plugins Manager.
Note
Conducting load tests on public APIs with a vast load can be considered a DDoS attack! Most performance testing tools give a test site to try performance testing. Refer to their official site to get the test site URL and hit the test sites with only a minimum prescribed load.
JMeter test skeleton
We can see how to set up a basic JMeter test skeleton using our library app. Let us add a simple test to measure our library app’s response time for /books endpoint, which our customers will access to view all the books in the library. The following are the steps to do the same:
-
In the JMeter GUI, right-click on Test Plan -> Add -> Threads (Users) -> Thread Group on the left-hand pane. Name the thread group as ‘ViewBooks.’ Configure parameters Number of Threads = 1, Ramp up = 0, Loop Count = 10 (see Figure 3-4) to record the response time of the endpoint ten different times and average them.
-
Next, we can create the HTTP request sampler. Right-click on Thread Group -> Add -> Sampler -> HTTP Request. Enter HTTP Request data for /books endpoint like server, path, request body (see Figure 3-5) and name the sampler as ‘ViewBooksRequest.’
-
Next, we can add listeners, which will record every request and response during the test run. Right-click on HTTP Request ->Add ->Listeners -> View Results Tree. Similarly, add the listener ‘Aggregate Report’ as well.
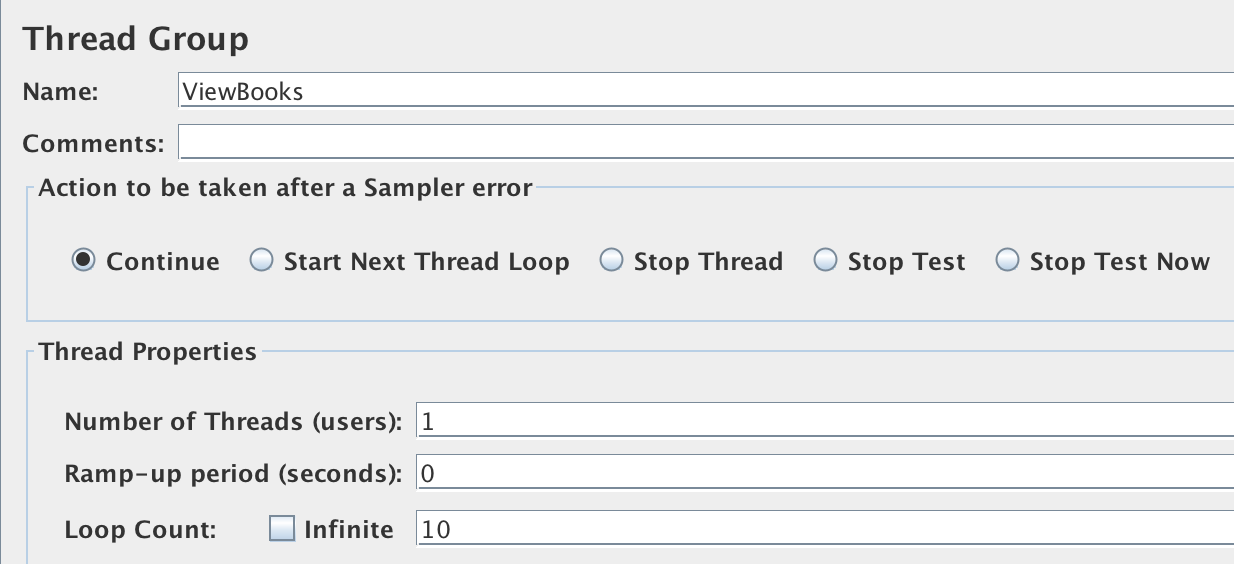
Figure 3-4. Thread Group configuration to run one request ten times
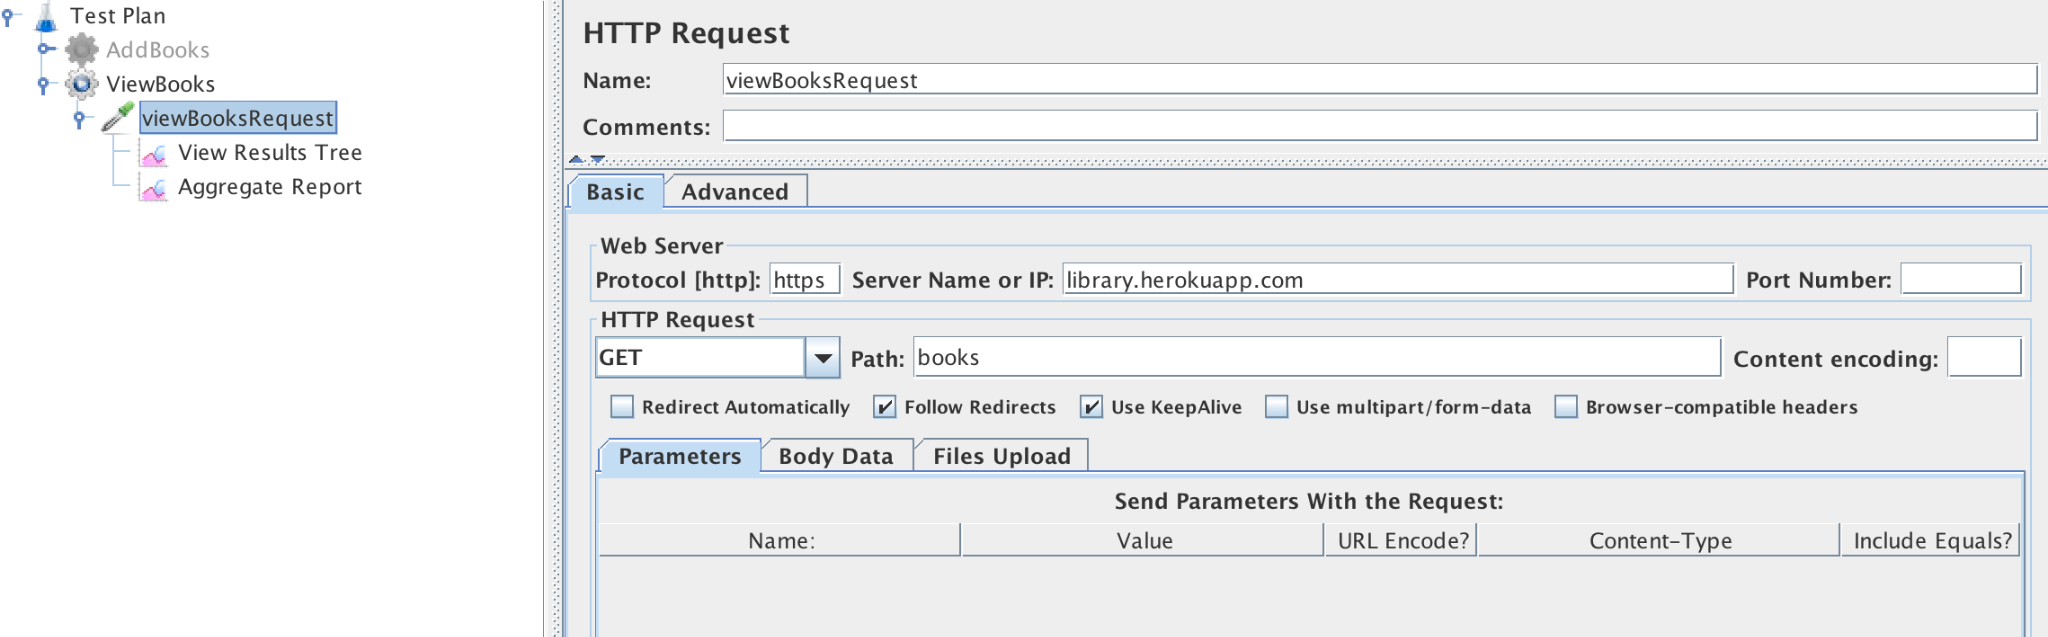
Figure 3-5. ViewBooks HTTP Request configuration
Now, ‘Save’ the basic test skeleton to measure the response time and click the ‘Run’ button. The results will now be available in the two listeners sections.
View results tree listener
Here, we will see the list of individual requests made by JMeter with success or failure indication. JMeter takes Status code 200 as ‘success’; otherwise, it considers the request a failed request. A point to note is that there can be situations in your application where the service will return a 200 status code to indicate that the operation had been executed but may not have produced the intended results. For example, /createBooks endpoint could return 200 status code for duplicate books with a message indicating it is a duplicate. So, in such cases, we need to add explicit assertions on the results (Assertions, like Listeners, are components of JMeter too). The View Results Tree view will also show request and response data on clicking each request for further debugging, as shown in Figure 3-6.
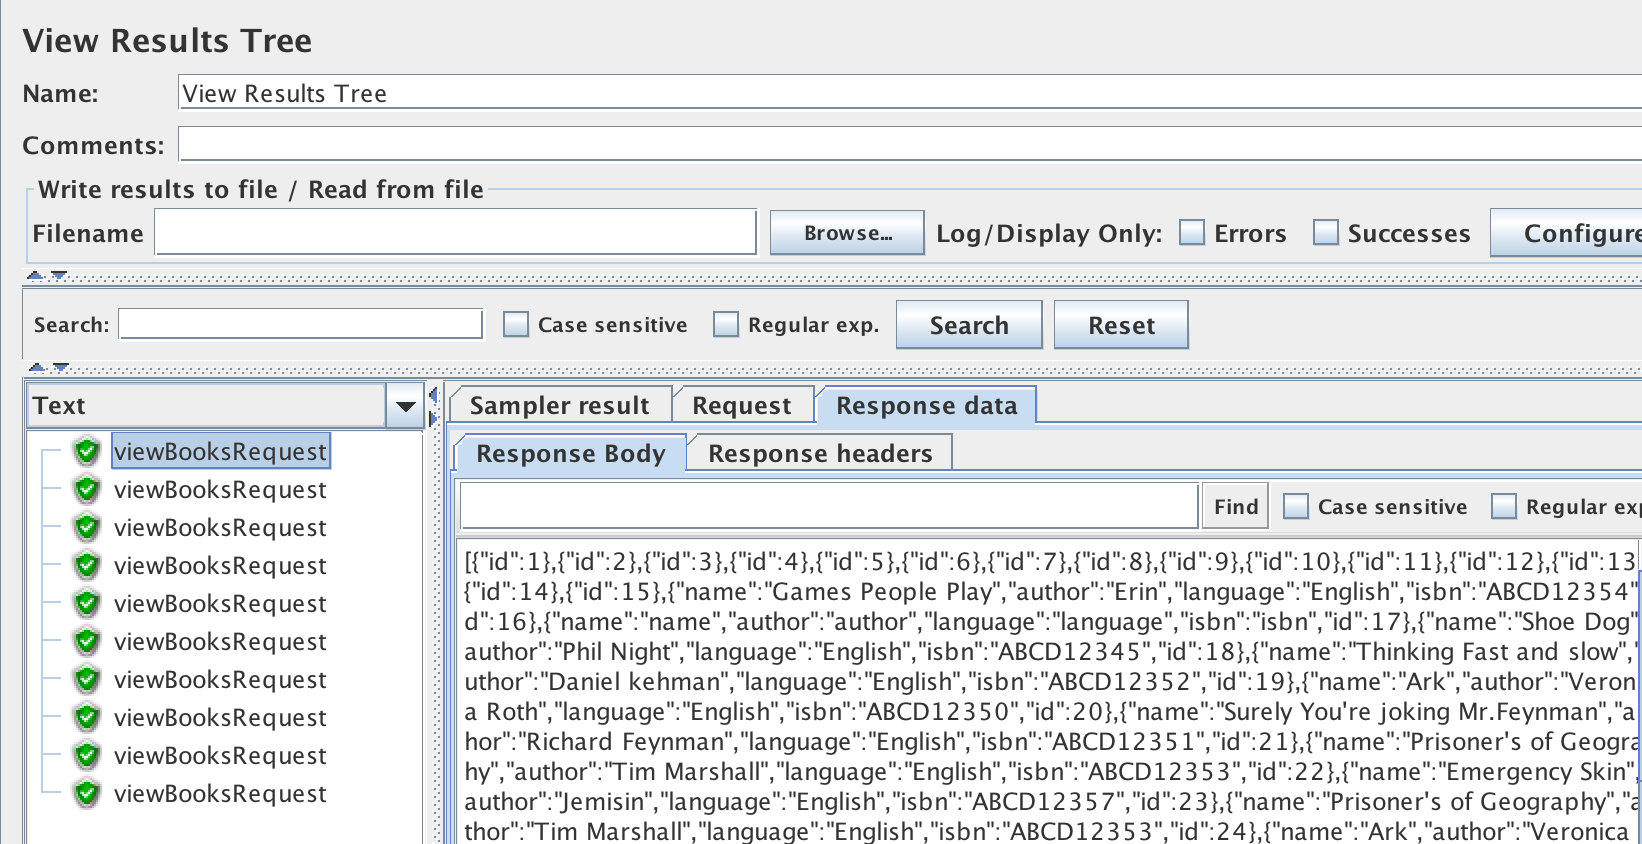
Figure 3-6. View Results Tree Listener Output
Aggregate report listener
Similarly, when we click on Aggregate Report, we will see a table with metrics like Average time, Median, Throughput, etc. For our endpoint, the average response time for 10 samples is 379ms, see Figure 3-7, i.e., the best-case response time is 379ms when the system is not under load.

Figure 3-7. Aggregate Report view for the response time of /books endpoint
Next, we can add load on the /books endpoint and check the response time for 166 concurrent users.
Ways to configure load in JMeter
JMeter offers many controllers to configure different load patterns. Here I present three simple controllers in Jmeter to show how we can use them in our library app’s context.
ThreadGroup Parameters:
Thread Group is a basic JMeter element to configure load. All listeners and controllers have to be placed inside the thread group. Thread group is the place where you configure basic structure of your load tests such as number of parallel threads, ramp up period and the number of times the test has to repeat.
As we saw in Figure 3-4, we configured the thread group parameters to run a single request in loop 10 times to measure response time. Now we can change parameters to Number of Threads = 166, Ramp up = 0, Loop Count = 5. JMeter will spin up 166 concurrent threads with no ramp-up time and loop 5 times to get the average response time.
Concurrency Controller:
Concurrency controller, which comes as a plugin, is a useful controller to design step ramp up load patterns.
Open Options->Plugins Manager. Search for ‘Custom Thread Groups’ under the ‘Available Plugins’ tab and install them. After restarting JMeter, the concurrency controller will be available now. Add the controller to our test by doing a right-click on Test Plan -> Add -> Threads (Users) -> bzm -> Concurrency Thread Group. Here, we can configure the load parameters as Target Concurrency = 166, Ramp-Up time (min) = 0.5, Hold Target Rate Time (min) = 2. Refer to Figure 9-8. By this, we are asking JMeter to ramp up 166 users in 30 seconds and hold them for 2 minutes in the system. Add the HTTP Request sampler like before under this controller, run the test, and view the results in the listeners.
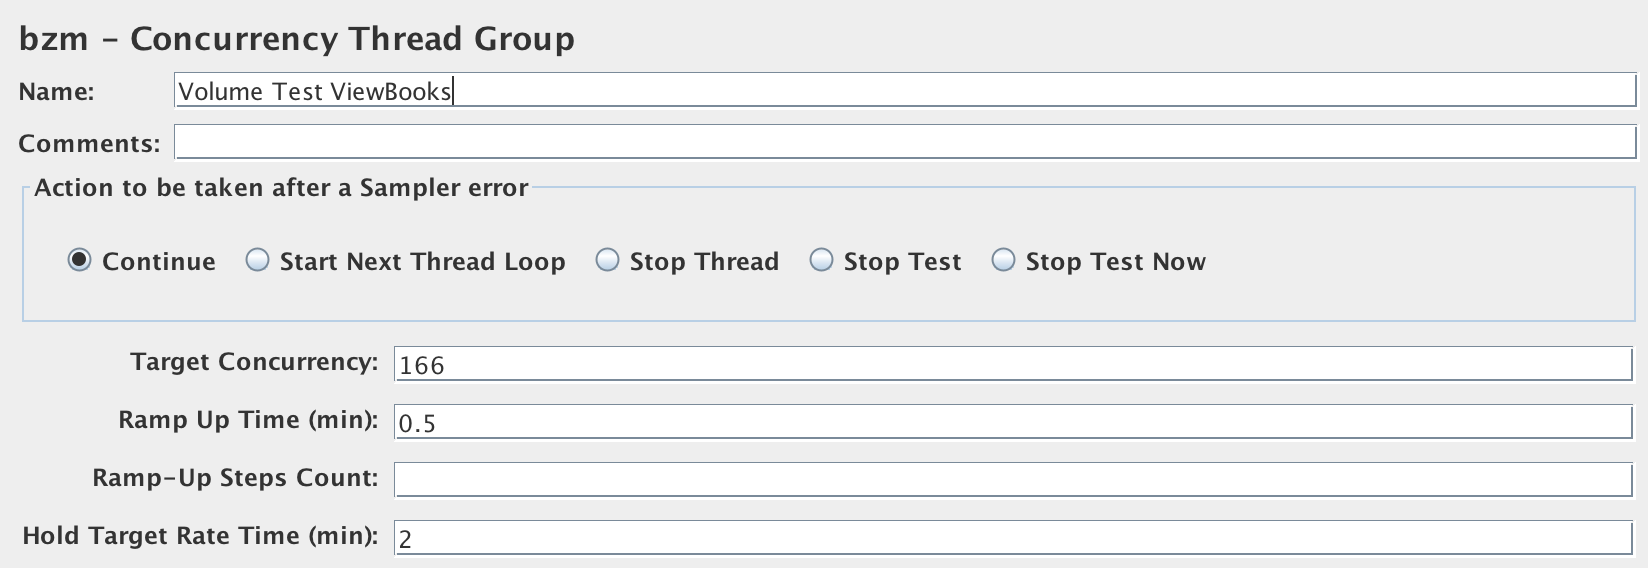
Figure 3-8. Refer 9-8. Concurrency Controller to volume test /books Endpoint
Ultimate Thread Group:
The ultimate thread group controller comes as part of the same Custom Thread Groups plugin we installed earlier. As the name suggests, the controller gives detailed configurability provisions like initial delay before test run, shutdown time after test run to tailor your load pattern.
To add this controller, right-click on Test Plan -> Add -> Threads (Users) -> jp@gc Ultimate Thread Group. For the library app, as seen in Figure 3-9, we can mention the load parameters as Start threads count = 166, Initial Delay = 0, Startup Time = 10, Hold Load for = 60, Shutdown time = 10. These configurations instruct JMeter to spin up 166 concurrent requests within 10 seconds and hold the load for 1 minute; post which ramps down the users within 10 seconds. We can add more rows appropriately to generate the peak-rest pattern, too, here. To run the test, add the HTTP Request sampler like before and view results in the listener.

Figure 3-9. Ultimate Thread Group Controller to volume test /books Endpoint
The results using the simple thread group option (first option) with 166 concurrent users and zero ramp-up time, averaged over five loop counts, is ‘Average = 801 ms and 90% Line = 1499ms’. Refer to Figure 9-10. In other words, 90% of 166 concurrent users get their response back in ~1.5s, and on average, all 166 concurrent users get back their response within 0.8s. The average is lesser because, as we can see from the table, the minimum time to get a response for some users has been just 216ms.

Figure 3-10. Figure 9-10. Volume test results for /books Endpoint
Designing other performance test cases
You have seen various ways to distribute the load on the system using JMeter till now. This knowledge about the tool is a great start to simulate other performance test cases like stress tests, soak tests, throughput validation, etc. To do stress testing, you can use the Concurrency controller to introduce load in steps of x users, until a maximum limit of users, with each step running for a given time. The objective here is to find the load at which the response time slows down and ultimately throws errors.
To do soak testing, you can simulate constant load for an extended time using one of the above controllers, such as the Ultimate thread group. To validate hourly throughput, use ‘Parallel controllers’ to run multiple HTTP requests parallelly while pausing between requests using ‘Timer’ components, i.e., think time.
There are more components in JMeter to help model application-specific use cases. The If, Loop, Random controllers enable to include conditions in tests. There are provisions to provide user credentials if the application needs a login. The login credentials can be fed to the test from an external source like a CSV file to perform concurrent user scenarios. This is called Data-Driven Performance Testing, a feature I used to create test data for our library application which we will see next.
Data-Driven Performance Testing
Our library application has the /createBooks endpoint, which takes request data like name, author, language, and ISBN of the book. I created a CSV file with the request data parameters - name, author, language, and ISBN for 50 books. In JMeter, as usual, add a thread group with HTTP Request sampler for /addBooks endpoint to run 50 times. To wire the CSV file to the HTTP Request, right-click on Thread Group -> Add -> Config Element -> CSV Data set Config. In the CSV Data Set Config window (see Figure 9-11), give the CSV file path and the variables to read from the file. These variables can be accessed as ${variable_name} in the HTTP request body like in Figure 9-12.
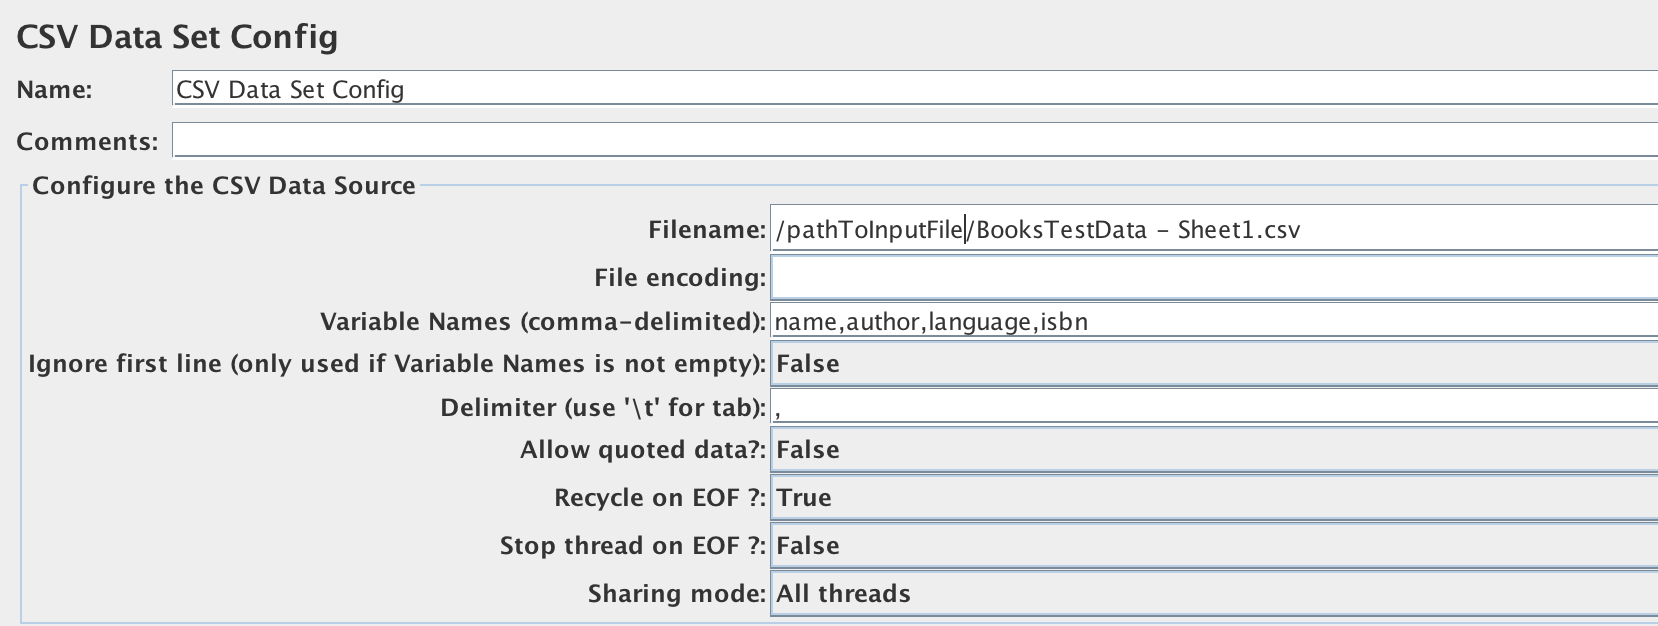
Figure 3-11. Figure 9-11.Configuring CSV Dataset Input for Data-driven testing

Figure 3-12. Figure 9-12. Referencing variables from CSV file
That is how I created 50 books in less than a second! Variables in JMeter can be extracted and referred to using ${variable_name} notation in other places too.
Run as part of CI pipelines
Having seen how to add test cases in JMeter and wire data using external sources, the last step is to run them as part of CI pipelines and shift the performance testing left. For that, save the tests first. It gets saved as .jmx files. To run the tests from the command line:
jmeter -n -t <library.jmx> -l <log file> -e -o <Path to output folder>
We can also configure JMeter to provide exhaustive dashboard reports as needed with further extensions.
Gatling
Gatling provides Scala-based DSL to configure the load pattern. It is also an open-source tool with the option to record user flows. The tests can be integrated with CI pipelines. If you are game to explore Scala, this is a robust tool to simulate load patterns with nuances. We can see the sample Scala script demonstrating how to induce load with think time for one of our library application API in Example 9-1.
Example 3-2. Example 9-1. Sample Scala scripts for load testing
package perfTest
import scala.concurrent.duration._
import io.gatling.core.Predef._
import io.gatling.http.Predef._
class BasicSimulation extends Simulation {
//Defining the HTTP Request
  val httpProtocol = http
    .baseUrl("https://library.herokuapp.com/")
    .acceptHeader("text/html,application/xhtml+xml,application/xml;q=0.9,*/*;q=0.8")
    .doNotTrackHeader("1")
    .acceptLanguageHeader("en-US,en;q=0.5")
    .acceptEncodingHeader("gzip, deflate")
    .userAgentHeader("Mozilla/5.0 (Windows NT 5.1; rv:31.0) Gecko/20100101 Firefox/31.0")

//Defining a single user flow with think time
  val scn = scenario("BasicSimulation")
    .exec(http("request_1")
    .get("/books"))
    .pause(5) // Think time

//Configuring load of 166 concurrent users to do the above user flow
  setUp(
    scn.inject(atOnceUsers(166))
  ).protocols(httpProtocol)
}
Apache Benchmark:
If you want to quickly get some numbers on the application performance without the hassle of learning, configuring tools, Apache Benchmark (ab) is your go-to tool! It is a simple open-source command-line tool. If you are on Mac, ab comes as part of the OS, so you don’t have to worry about installation. To get performance numbers for 200 concurrent users accessing our library app, we can run the following command from the terminal:
ab -n 200 -c 200 https://library.herokuapp.com/books
The results will be printed as follows:
Concurrency Level:      200
Time taken for tests:   5.218 seconds
Complete requests:      200
Failed requests:        0
Total transferred:      1389400 bytes
HTML transferred:       1340800 bytes
Requests per second:    38.33 [#/sec] (mean)
Time per request:       5217.609 [ms] (mean)
Time per request:       26.088 [ms] (mean, across all concurrent requests)
Transfer rate:          260.05 [Kbytes/sec] received
Connection Times (ms)
              min  mean[+/-sd] median   max
Connect:      869 2074  97.6   2064    2289
Processing:   249 1324 299.4   1303    1783
Waiting:      249 1324 299.5   1303    1781
Total:       1192 3398 354.3   3370    4027
Percentage of the requests served within a certain time (ms)
  50%   3370
  66%   3483
  75%   3711
  80%   3776
  90%   3863
  95%   3889
  98%   4016
  99%   4022
 100%   4027 (longest request)
And that’s how you use tools to script your test cases and measure the application’s performance KPIs.
We have dealt with the performance testing topic at good depth until here, but it is not complete yet. We have to turn our focus to front-end performance testing next!
Front-End Performance Testing
Though performance testing tools allow you to mimic application behavior during peak time, there is a gap between the measured performance numbers and the actual user experienced performance. This is because the tools are not actual browsers and they don’t do all the tasks a typical browser does!
To understand the gap, let us explore a bit about browser behaviors. The front-end code is getting rendered on the browsers, and it has three parts to it:
-
HTML code, which is the bare bone structure of the website
-
CSS code which styles the page
-
Scripts to create logic on the page
A typical browser first downloads the HTML code entirely from the server then gets to downloading the stylesheet, images and executing the scripts as per the sequence in the HTML. There is parallelization to an extent when it is downloading images from different hosts etc. But the browser stops parallel processing completely when executing a script as it is possible for the script to change the way the page is made visible entirely. Since there could be scripts at the end of the HTML, the page becomes visible for the user only when the entire document is fully executed.
Performance testing tools don’t do most of these jobs. They hit the page directly and get the HTML code, but they don’t render the page while executing the performance tests. So even when we have measured the services’ response time to be within milliseconds, the end-user will see the page appear only after a further delay because of the additional rendering tasks, which the browser does. According to Yahoo!, this front-end rendering takes almost 80% of the entire page load time!7 Isn’t it shocking?
For example, if you navigate to the CNN home page, the browser will carry out 90 tasks before the page appears to us. Figure 3-13 shows the first 33 of these tasks. If you had been thinking optimizing the web service’s response time alone would create an impact on website performance, here is a piece of evidence for changing that view!

Figure 3-13. CNN Front end Browser tasks during page load
However, let us not question the importance of the KPIs we measured in the previous section. Those are still critical to plan the system’s capacity and troubleshoot performance issues in application code. In other words, KPIs help us to answer questions such as “Will the application support a peak load of 5,000 transactions during Black Friday sales?”. But if we find from our KPIs that the peak response time for our application is 600 milliseconds, it still may not reflect what an end-user experiences. Here is where we have to evaluate the front-end performance metrics additionally. That is what we will see in this section.
Factors Affecting Front-End Performance
There are several factors that contribute to front-end performance. As such, we need to consider these factors when we test for performance metrics.
Front-end code complexity
Best practices such as minifying the Javascript, reducing the number of HTTP requests made per page, proper caching techniques, etc., which, when not followed properly, will lead to lower performance. For instance, each HTTP request takes at least a few milliseconds to complete and when there are many, the time for each request adds up to the total page load time.
Content Delivery Networks (CDNs)
A Content Delivery Network (CDN) is a collection of servers hosted across multiple locations to deliver web content, such as images, to users more efficiently. As we discussed earlier, the geolocation of the server and the user has an impact on the network latency. So usually, the images are stored in CDNs which will have a server that is closer to the user to reduce the network latency. This is much simpler than replicating the application in different geolocations. But the performance of the CDN itself will affect the page load time.
DNS lookups
It typically takes 20–120 milliseconds for a browser to look up the IP address for a given hostname. The browser caches the IP addresses once resolved for subsequent calls. While trying to resolve the DNS, even the Internet Service Provider caches the IP addresses for a while, improving the user’s experience from the second time.
Network latency
The user’s internet bandwidth will call the shots on the overall page load time. The data suggests that the end-users prefer mobile usage over desktop across the globe and the mobile bandwidth tends to be very low at times in different urban and rural areas. Some sites overcome this by serving a ‘lite’ version of their website when the user’s network bandwidth is identified to be very low. On the other hand, it is studied that the users who usually operate with low bandwidth like 3G are used to the slowness and don’t complain unless the performance is jarringly bad.
Browser caching
The browser caches many contents like images, cookies, IP addresses, etc., after the first visit. Due to this, the page load time significantly varies from the first time it renders to the subsequent usages. Caching of elements on the page can be made intentional via code to improve page load time.
Data transfers
If there are volumes of data transfer to and fro between the user and the application, that will affect the overall front-end performance, with the network’s effects adding on.
All these factors could make us feel like they are beyond the team’s control to even think about optimizing them, leaving a puzzle in our heads about where to start! Many folks in the software industry have also felt the pain of dealing with this challenge. That’s where the RAIL model comes in.
RAIL Model
The RAIL model is a way to structure the thought process around front-end performance.8
It is designed to keep the user’s experience at the core of your software development. It defines specific front-end performance goals as well. It is suitable for us to see the front-end performance through this lens and integrate the goals as part of our testing.
The RAIL model breaks down the user’s experience with a website into four key actions: response, animation, idle, and load. All user interactions can be measured according to these aspects.
Response
Have you ever clicked on a button, but it neither changed color nor popped a loading icon, making you wonder if you imagined clicking that button in the first place? That is the input latency. The ‘response’ aspect of RAIL defines the goals for input latency. When a user does some action, RAIL prescribes the website’s response time to the action to be less than 100 milliseconds; failing which the user will sense the lag! This is applicable for all user actions like clicking a button, toggling an element, selecting a checkbox, etc.
Animation
Animation includes visual animations like loading indicators, scrolling, drag, and drop, etc. The user will perceive a lag in animation when each frame is not completed within 16 milliseconds.
Idle
One of the general front-end design patterns is to group non-critical tasks like beaconing back analytics data, bootstrapping a comments box, etc., to later when the browser is idle. This grouping of tasks can be bundled to make blocks of 50 milliseconds, as recommended by RAIL and not more so that when the user comes back to interact, we can respond within the 100-milliseconds window.
Load
This refers to the page loading time. A high-performing website should aim to render the page within 1 second; only then the user feels they are in complete control of the navigation, as per the research mentioned earlier.
The RAIL model guides us to think about what to test for from a usability perspective. It also gives a concrete language to communicate within teams instead of expressing vague feelings like the ‘page seems slow’!
Front-End Performance Metrics
The RAIL model gives high-level goals for different front-end aspects. These high-level goals, in practice, are broken down into smaller, tinier metrics that will help debug issues. A few standard metrics are as follows
First Contentful Paint
It is the time taken by the browser to render the first element of DOM content like images, non-white elements, SVGs, etc. after a user navigates to the page. This helps us understand how long the user has to wait to see some action on the website after opening it.
Time to Interactive
It is the time taken for the page to become interactive. In the urge to make the page performant, the elements are made visible quickly, but they won’t respond to user actions resulting in customer dissatisfaction. Hence just like measuring the time to see the first content on the website, the ‘time to interactive’ helps us understand if the information presented is helpful or just noise.
Largest Contentful Paint:
The time taken for the most prominent element like a big blob of text or image on the web page to become visible.
Cumulative Layout Shift
This is the measure of visual stability, i.e., it helps quantify how often the user will face an unexpected change in page layout. Have you ever started reading an article and the page automatically shifted down, making you lose track of what you were reading? It is frustrating. And this metric measures precisely that. The lower the number, the better is the performance.
First Input Delay
Between the first contentful paint and time to interactive, when the user clicks on a link or makes any interaction on the web page, there will be a delay which is more than the usual delay because the page is still loading. This metric gives that time delay for the first interaction.
Max Potential First Input Delay
This is the worst-case scenario of the first input delay where it measures the time taken by the most prolonged task that occurs between the first contentful paint and time to interactive to complete.
Google classified Largest Contentful Paint, First Input Delay, and Cumulative Layout Shift as the ‘Core Web Vitals’ to help the business folks to understand their site performance in simple terms.9 Most of the front-end performance testing tools capture these three metrics specifically. We can use the tools to capture these metrics as part of CI and hence shift front-end performance testing to the left.
Front-End Performance TestingTools:
WebPageTest, Google Lighthouse, PageInsights, chrome dev tools, etc., are tools that enable us to measure front-end performance metrics. You might have to capture the above metrics for various test cases to understand how different users experience your website in terms of performance. Consider building your test cases along these lines:
-
Users with different types of devices like desktop, mobile, tablet, etc., and which device manufacturers are significant players in the region you wish to serve. This is important because each device will have its CPU, battery, and memory capacity, which affects the user experience.
-
Users with varying network bandwidths - WiFi, 3G, 4G, etc. The internet bandwidth is different in different countries too. A report published in 2021 on internet speeds says Singapore has an average broadband speed of 226.6 Mbps, Spain has 157.22 Mbps, Germany has 114.66Mbps, for example.10
-
Target users distribution based on geolocation.
Plenty of this usage data is available on the internet only a click away. Alternatively, Google Analytics will give the site’s real-time usage analytics if there is an existing application.
I suggest you jot down a list of test cases specific to your application to capture the front-end performance metrics. Here is an example test case for which we can measure the metrics using different tools - ‘A user from Milan, who has a Samsung Galaxy S5, is accessing the site home page using 4G network connection’.
WebPageTest
WebPageTest is a free online tool publicly hosted for everyone around the world to assess their website performance. It is a powerful tool since it evaluates the website performance on real browsers hosted on machines across geolocations. It also can assess performance on their real mobile browsers. The tool can’t get closer than this to replicate a real end-user behavior.
The usage is simple. Enter your application URL on the WebPageTest site, choose the end-user location, browser type, mobile device type, network bandwidth, run the audit, and view the reports with metrics. Since it’s a free publicly available tool, you may have to wait in the queue for a few minutes to view the report. To avoid the wait, you can choose to set it up privately in a local test environment for a fee.
See Figure 3-14, where we have configured our example test case - ‘A user from Milan who has a Samsung Galaxy S5 accessing the Amazon site over 4G’.

Figure 3-14. WebPagetest configuration
We have provided two more inputs for our test case, as seen in Figure 3-14,
- Number of tests to Run
-
As results from just one trial may be faulty due to glitches in network bandwidth, we request to run the test case a few times to observe the average.
- Repeat View
-
To capture performance metrics separately for the first visit and subsequent visits since the metrics could vary for the first visit due to lack of caching.
Click ‘Start Test,’ and the report will be presented shortly. The report has many valuable sections that enable detailed debugging. Each report can be retrieved using a unique ID for 30 days. Let’s discuss a couple of important sections which capture the performance metrics from our report.
Performance metrics table
The performance metrics table (See Figure 3-15) has the Core Web Vitals for the first view and repeat view for all test runs. To benchmark the page load time for this test case, we can take the median of document complete time from all the runs. Specifically, we can notice the ‘Time’ under the ‘Document Complete’ is 3.134s and ‘Largest Contentful Paint’ is 2.105s for the first-time view, which tells us that the user experience is within acceptable limits. The fully loaded time includes the time taken to load all the secondary content, i.e., deferred tasks by the load event, which is substantial ~14s with 230 requests and will not certainly affect user experience.

Figure 3-15. Performance metrics table from WebPagetest report
Waterfall view
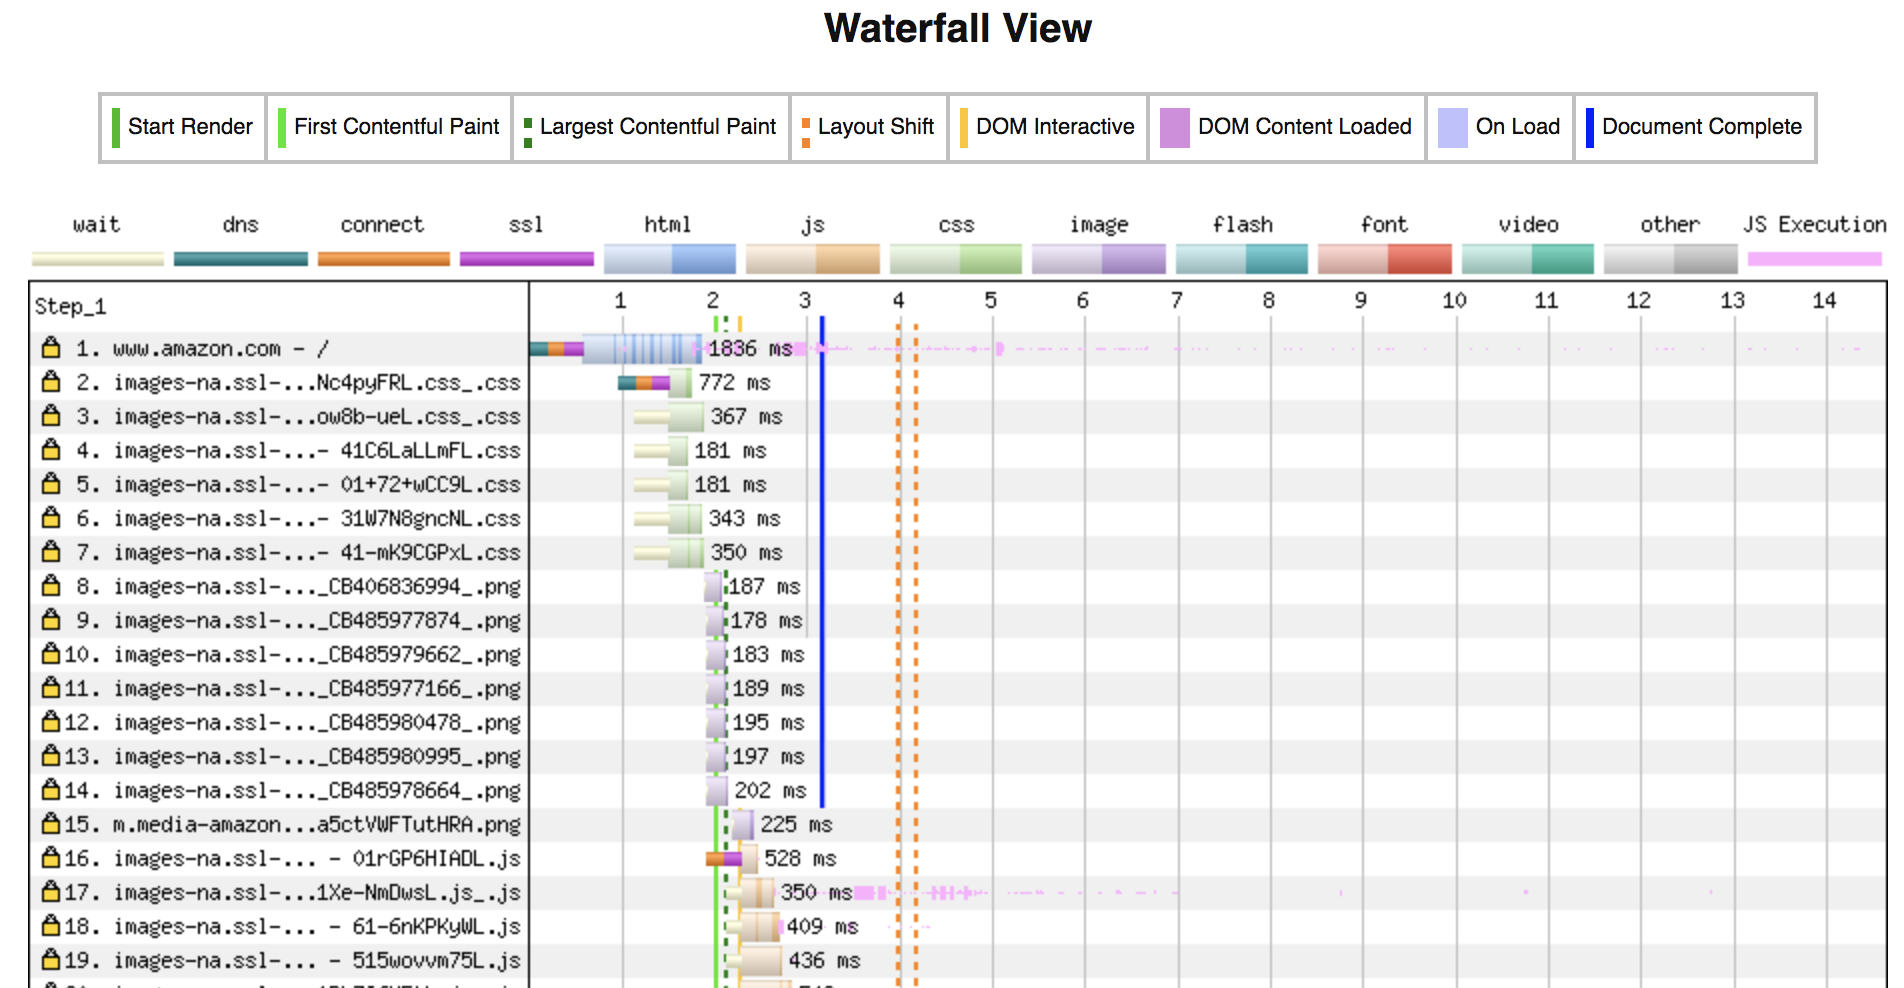
Figure 3-16. WaterFall view from WebPagetest report
The Waterfall view, like in Figure 3-16, shows a beautiful timeline view of how long each task, like DNS resolution, connection initiation, downloading Html, images, run time for scripts, etc., takes to enable further optimization.
You can change the view of the report to show the different domains accessed by the website, which is helpful to trigger optimization ideas further.
WebPageTest provides facilities to pass authentication credentials too. Note that any test credentials you provide will be visible to whoever has access to the report as it is publicly hosted. WebPageTest also exposes its APIs to get the reports programmatically. There is a node module variant to run the tests directly from the command line too. These two options enable integration with the CI pipelines. Both of these options require an API Key which is to be bought for a fee. If you have decided to purchase it, refer to Example 9-2 and Example 9-3 for CLI commands and API usage, respectively.
Example 3-5. Example 9-2. WebPageTest CLI commands to install , run test cases, and view results
//Step 1: Install using npm
npm install webpagetest -g

//Step 2: Run our sample scenario via command line

webpagetest test http://www.example.com --key API_KEY --location
ec2-eu-south-1:Chrome --connectivity 4G --device Samsung Galaxy S5 --runs 3 --first --video --label
"Using WebPageTest" --timeline

//Step 3: Reading test results from the report ID 2345678 generated from the above command

webpagetest results 2345678
Example 3-6. Example 9-3. APIs run WebPageTest test cases and view results
//Step 1: Run our sample scenario via API
http://www.webpagetest.org/runtest.php?url=http%3A%2F%2Fwww.example.com&k=API_KEY&location=ec2-eu-south-1%3AChrome&connectivity=4G&runs=3&fvonly=1&video=1&label=Using%20WebPagetest&timeline=1&f=json


//Step 2: Reading test results from report ID 2345678, returned as the response by the above API

http://www.webpagetest.org/jsonResult.php?test=2345678
Lighthouse
Lighthouse comes as part of Google Chrome and it is also available as a Firefox extension. It audits your website from multiple dimensions, including security, accessibility, and front-end performance. The performance audit report has an overall score and all the page metrics.
One of the advantages of Lighthouse is that it is not publicly hosted and hence no queuing or wait time. Since it is in your browser, there are no security concerns as well. As you are accessing the application on your local Chrome browser, the geolocation of the end-user cannot be altered. You can still throttle your network and CPU and resize to mobile browser resolutions in Chrome to simulate different test cases and obtain metrics using Lighthouse.
It is also available as a CLI tool, thus making it easier to integrate with CI for continuous performance feedback. Zalando, a leading European retail chain, had stated that they could reduce their front-end performance feedback time from 1 day to 15 minutes with Lighthouse CI.11 The tool is entirely free and open-sourced.
Lighthouse is simple to use. If you want to try,
-
Open Chrome Dev tools using shortcut Cmd + Option + J on Mac. Or choose Inspect option from Chrome right-click menu and you will see Lighthouse in other OS.
-
Choose your network throttling preferences under the ‘Network’ tab.
-
Choose your CPU throttling preferences under the ‘Performance’ tab. Default options are 4x, 6x for middle and low-tier mobile devices.
-
Choose your window size from the ‘Responsive’ dropdown
-
Now open the ‘LightHouse’ tab. Select the Performance checkbox and ‘Generate Report.’
In Figure 3-17, I chose ‘Slow 3G’, ‘4x slowdown’, ‘Galaxy S5’ options to measure performance metrics for Amazon.
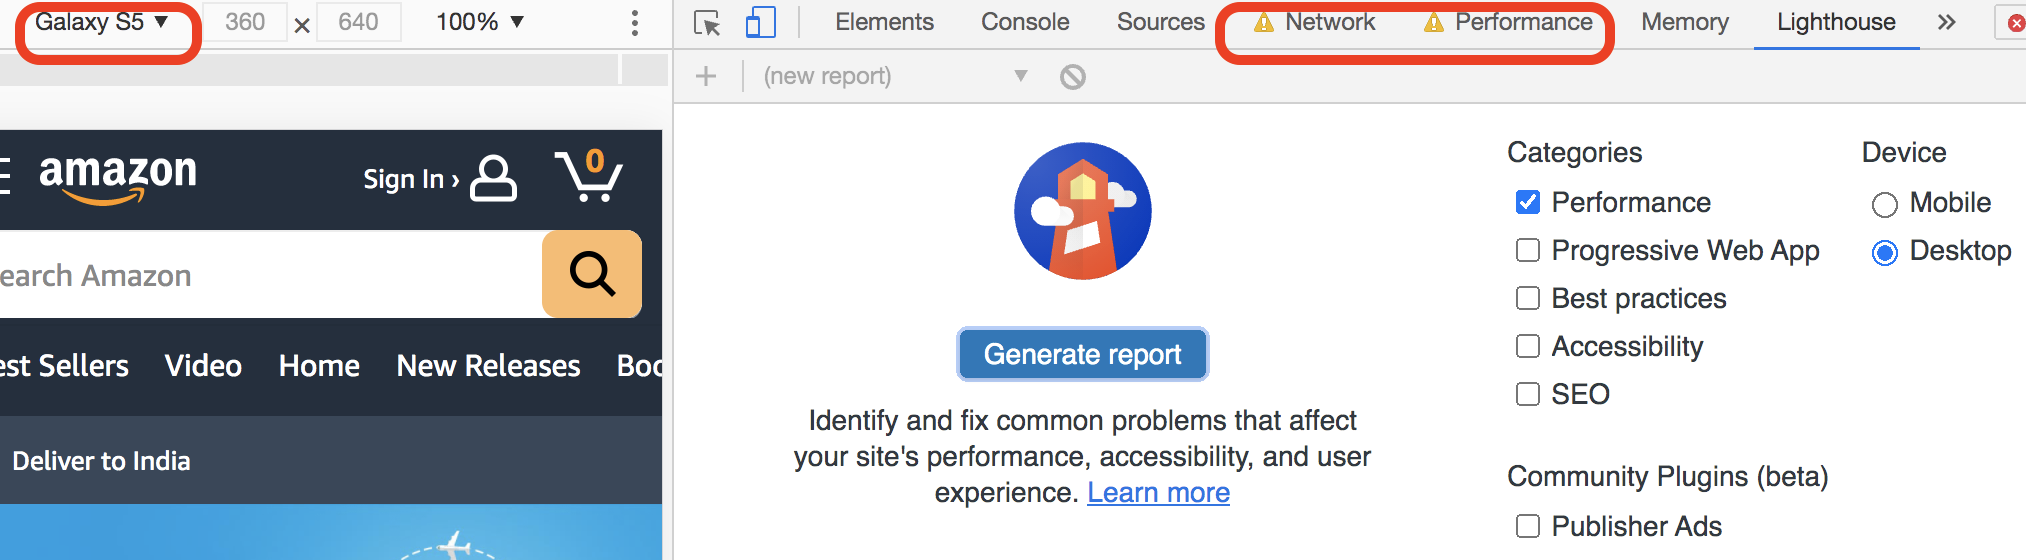
Figure 3-17. LightHouse Window with Network, CPU, Resolution configurations
As seen in Figure 3-18, the results tell us that Amazon does a pretty good job. The ‘Time to interactive’ in such skewed situations is still 3.8s!
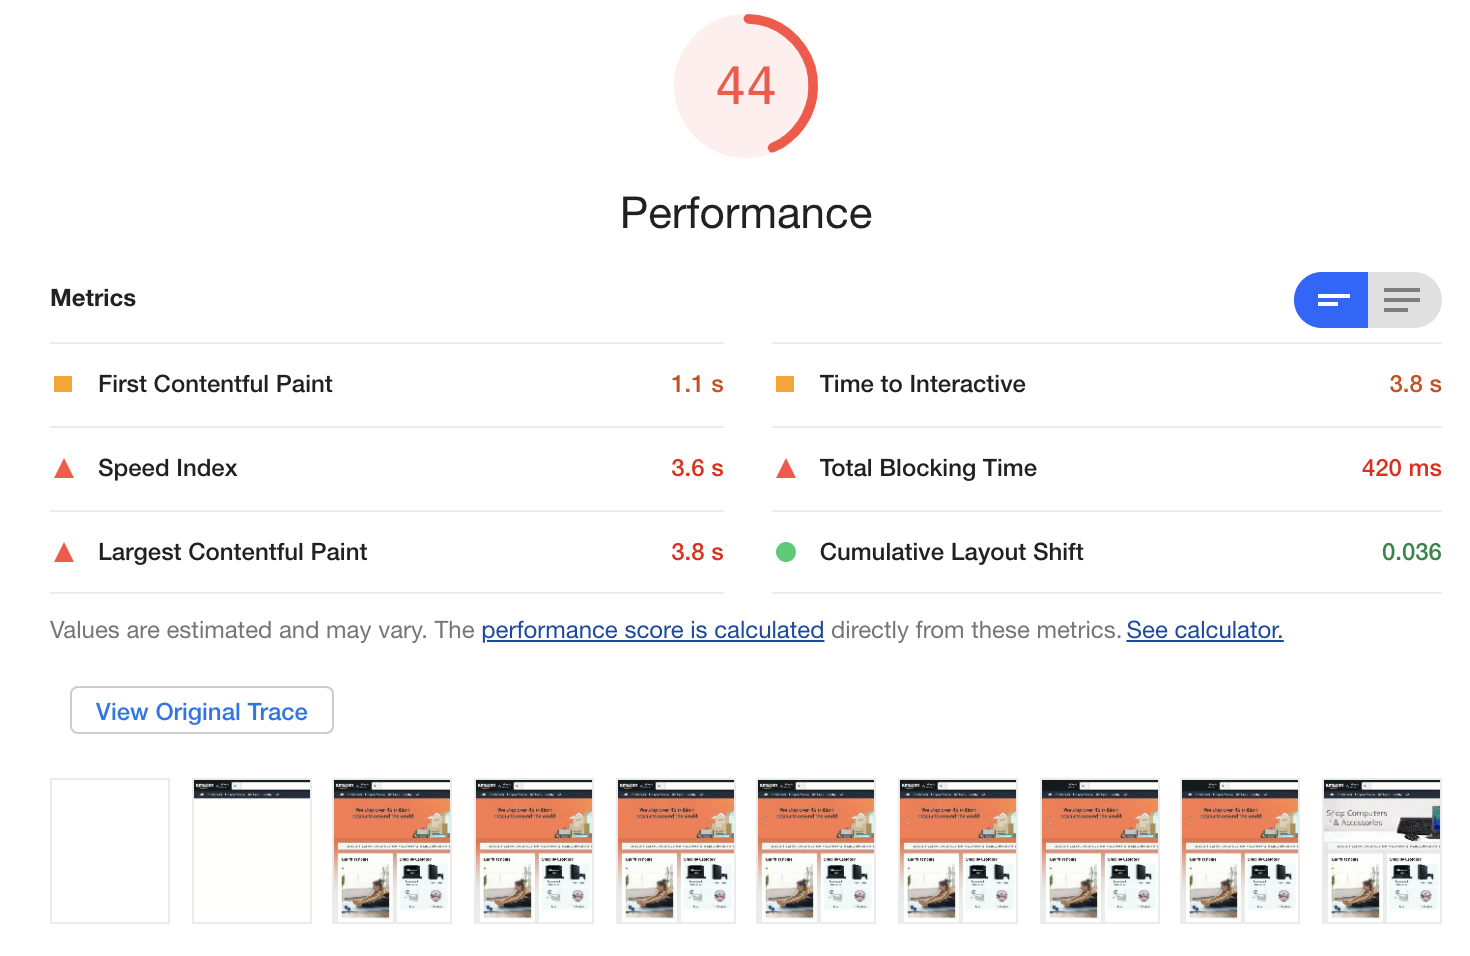
Figure 3-18. LightHouse Performance report
We can use Lighthouse to test various test cases as early as during development itself. To integrate this with CI, we can use the LightHouse node module. Install node module using the command,
npm install -g lighthouse
To run a performance audit,
lighthouse https://www.example.com/ --only-categories=performance
We can see the reports in the current directory. We can use optional parameters to configure the network and CPU throttling and choose device screen sizes.
We can write a wrapper to fail the pipeline if the performance score is less than a threshold; for instance, fail the build if the score is less than 90! We can also define performance budgets (upper threshold value) for each of the web vitals using the Lighthouse Wallet feature.12 This will assert the Lighthouse’s performance results against the defined threshold values for each metric and raise alerts when it is overboard. Cypress-Audit tool enables integration of Lighthouse with Cypress functional test suite, which is another way to plug them into CI.
PageInsights
The previously discussed tools allow us to simulate test cases like in a lab, where we set pre-conditions and observe results. But there are many variations in the pre-conditions in real life as every user has minor differences in network bandwidth, device configurations, etc., which we can’t predict. The only way to know our users’ experience is to do Real-time User Monitoring (RUM) after the application has gone live. Google provides free monitoring services which record the core web vitals and other metrics as and when the users worldwide access the live applications. This data is called the ‘Field data’ or ‘RUM data.’
PageInsights tool tries to give a holistic view of front-end performance by presenting the RUM/field data from across the globe and the lab data by fetching the audit report from Lighthouse, as seen in Figure 3-19. Try entering your live application URL on the PageInsights homepage to see this.

Figure 3-19. PageInsights field data and lab data report
PageInsights also exposes APIs to monitor and alert constantly.
Chrome DevTools
Another handy tool for front-end performance debugging is the performance profiler available under the ‘Performance’ tab in Chrome DevTools. It gives detailed analysis reports around network stack, frames per second, screenshots, GPU consumption, memory, script run time, etc., for the developers to save the extra milliseconds lost in performance. Since it is embedded in the browser itself, it is development-friendly. The profiler allows for throttling the network and CPU while debugging.
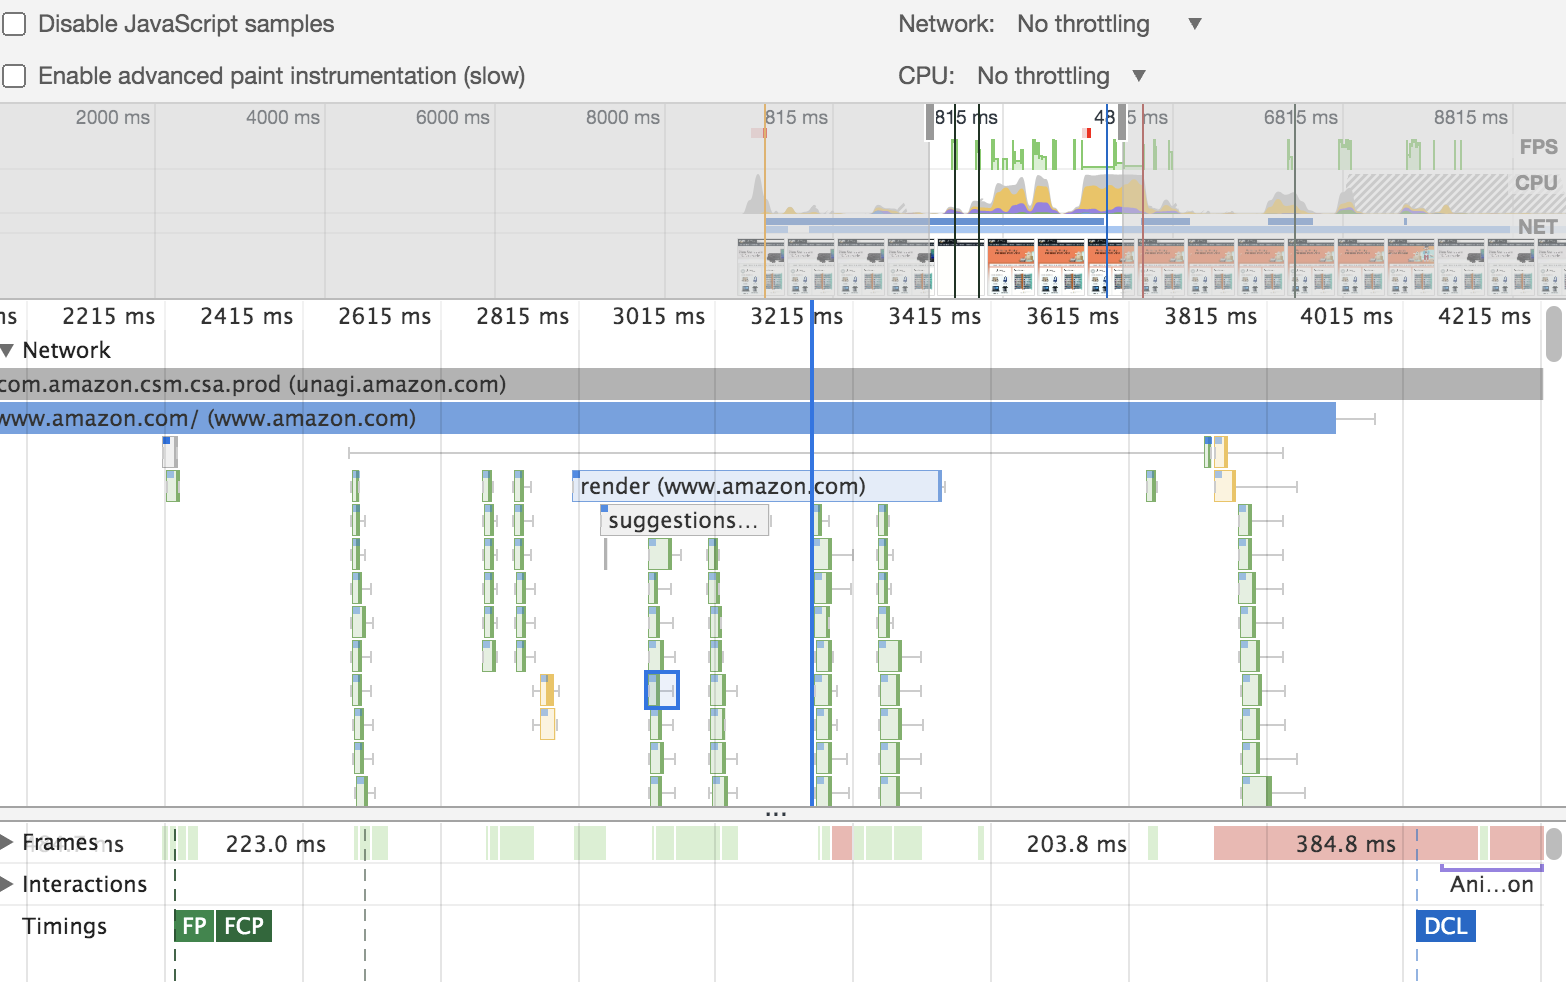
Figure 3-20. A sample report from the performance profiler of Chrome dev tools
Here is how it works: Let’s say that you want to find out how the auto-populate drop-down of your application performs on the UI. First, we’d record the action while manually searching something on the drop-down. The record option is available in the ‘Performance’ tab of the browser. Then, once the recording is stopped, the performance analysis reports are shown in the same tab, like in Figure 3-20.
Performance Testing Strategy
You are now equipped with the required knowledge to conduct end-to-end performance testing for your application successfully. The last part is putting them all together to form your performance testing strategy. Like all other testing, shift-left should be your performance testing strategy as well. Shifting left should start from designing the architecture based on performance numbers to integrating performance tests in CI pipelines for frequent and continuous feedback. Recall that this will not only be useful for the business and the application’s end-users but will also save your weekends. Throughout the chapter, we have learned how to do shift-left performance testing with various tools. Figure 3-21 shows an overview of shift-left performance testing.

Figure 3-21. Shift Left Performance Testing
To shift the performance testing to the left:
-
Arrive at a consensus on performance KPIs with all the application stakeholders from the business, marketing, and technical side before the project starts. Include these numbers as acceptance criteria in stories.
-
Try to get a performance testing environment at the beginning of the project. If not close enough to production, at least have an environment to begin.
-
Include response time validations and if possible, load tests of critical endpoints as part of CI pipelines to get frequent feedback and catch performance issues early. This will also help us see how the degradation happens gradually with additional features and will help in debugging. Based on the time taken to run the load tests, integrate them as part of every commit, if not at least part of nightly regressions.
-
Include front-end performance tests for the frequently visited pages as part of CI pipelines, just like web services.
-
Include various front-end performance test cases (like network, geolocation, etc.) as part of every story acceptance criteria. Validate them during the development and manual testing of stories and features.
-
Plan for application performance testing and debugging activities as part of release cycles. Perform release-level performance testing on a proper performance testing environment with an appropriate load of test data. If the previous list items are executed accurately, this phase should run the tests on the performance testing environment without many surprises.
Performance testing is not complex but takes significant effort!
Key Takeaways
-
Web performance has a steep impact on the sales and profit of the business.
-
Factors affecting the performance of an application could be many ranging from application architecture, third-party service performance, network bandwidth, user geolocation, etc.
-
Availability, concurrency/throughput, and response time are three crucial performance KPIs.
-
Use tools like JMeter, Gatling, or Apache Benchmark, etc., that are suitable for your team to measure the KPIs early and continuously.
-
Front-end performance testing is essential as 80% of the application’s page load time is from the front-end code.
-
Google developed the RAIL model as a thought process for front-end performance.
-
Design your front-end performance test cases with the end-user experience at the core and include different end-user variables like network bandwidth, geolocation, device capabilities to test for user experience.
-
Shift your performance testing to the left and save yourselves from big-bang performance surprises when you have to release tomorrow!
-
Like any other skill, performance testing develops with practice and seeing through many real-time edge cases.
1 Daniel An: New industry benchmarks for mobile page speed, thinkwithgoogle.com, February 2018.
2 Maile Ohye: Site performance for Webmasters, youtube.com, May 2012.
3 Diego Lo Giudice: Shift Left Performance Testing, go.forrester.com, April 2019.
4 Ian Molyneaux: The Art of Application Performance Testing, 2nd Edition, O’Reilly Media Inc., 2014.
5 Jakob Nielsen: Website Response Times, www.nngroup.com, June 20, 2010.
6 Scott Barber: Get performance requirements right—think like a user White paper, perftestplus.com, 2007.
7 Steve Souders: High Performance Web Sites, O’Reilly Media Inc., 2007.
8 Paul Irish: RAIL Model, smashingmagazine, October 2, 2015.
9 Philip Walton: Core Web Vitals, web.dev, April 2020.
10 World Population Review: Internet Speeds By Country 2021, worldpopulationreview.com, 2021.
11 Jeremy Colin: Zalando reduced performance feedback time from 1 day to 15 minutes with Lighthouse CI, web.dev, April 2021.
12 Katie Hempenius: Performance Budgets with LightHouse Wallet, web.dev, June 14, 2019.