
Miscellaneous Design Notes
Abstract
The chapter presents a number of important topics that do not belong to any particular one of the preceding ones, but rather a number of them. It begins with a presentation of various requirements for control surface design. It also details a method to size ailerons based on roll rate responsiveness and fundamentals of pitch and yaw controls. Then a design checklist designed for GA aircraft is presented. It details a number of important issues, intended to help the project engineer identify crucial capabilities and pitfalls, and how to either design them into the airplane or avoid them. This is followed by a number of examples of possible fixes to faulty aerodynamic characteristics. Since the airplane is a compromise of many focus areas, it is always possible the design will suffer in one or more areas. Aircraft designers have been imaginative in the past and have come up with various means to improve this or fix that, without it having been a part of the original design. It is helpful to the aspiring designer to know there are possible solutions to an imperfect design.
Keywords
Control surface; aileron; elevator; rudder; flap; plain flap; Frise aileron; spoiler-flap; slot-lip; flaperon; elevon; differential ailerons; aileron authority; elevator authority; rudder authority; roll damping; responsiveness; crosswind; T-O rotation; stall handling; stall margin; control system; control system harmony; natural damping; fuel tank selector; control system stretching; control system jamming; ground impact resistance; analysis technology; dorsal fin; ventral fin; forebody strakes; taillets; stabilons; control horns; stall strips; wing fence; wing pylons; vortilons; wing droop; cuffs; leading edge extention; vortex generator; trailing edge tab; nacelle strakes; bubble-drag; turbulator; transition ramp
Outline
23.1.1 The Content of this Chapter
23.2.1 Introduction to Control Surface Hinge Moments
23.2.2 Fundamentals of Roll Control
Aileron Authority Derivative Clδa
Derivation of Equations (23-4) and (23-5)
Derivation of Equations (23-6) and (23-8)
Derivation of Equations (23-9) and (23-10)
Estimating Steady-State Roll Rate
STEP 3: Estimate Roll Authority
STEP 4: Estimate Roll Helix Angle
Special Case Aileron Sizing: Constant-Chord Wing
Derivation of Equation (23-11)
Derivation of Equation (23-13)
23.2.4 Fundamentals of Pitch Control
23.2.5 Fundamentals of Yaw Control
23.3 General Aviation Aircraft Design Checklist
23.3.1 Crosswind Capability at Touch-Down
23.3.2 Balked Landing Capability
23.3.3 Take-Off Rotation Capability
23.3.4 Trim at Stall and Flare at Landing Capability
23.3.5 Stall Handling Capability
23.3.6 Stall Margin for Horizontal Tail
23.3.10 One-Engine-Inoperative Trim and Climb Capability
23.3.11 Natural Damping Capability
23.3.13 Control System Stretching
23.3.14 Control System Jamming
23.3.15 Ground Impact Resistance
23.3.16 Reliance Upon Analysis Technology
23.3.17 Weight Estimation Pitfalls
23.3.18 Drag Estimation Pitfalls
23.3.19 Center of Gravity Travel During Flight
23.3.20 Wing/Fuselage Juncture Flow Separation
23.4.1 Stability and Control – Dorsal Fin and Rudder Locking
23.4.2 Stability and Control – Ventral Fin and Deep Stall
23.4.3 Stability and Control – Ventral Fin and Dutch Roll
23.4.4 Stability and Control – Forebody Strakes
23.4.5 Stability and Control – Taillets and Stabilons
23.4.6 Stability and Control – Control Horns
23.4.7 Stall Handling – Stall Strips
23.4.8 Stall Handling – Wing Fence
23.4.9 Stall Handling – Wing Pylons
23.4.10 Stall Handling – Vortilons
23.4.11 Stall Handling – Wing Droop (Cuffs, Leading Edge Droop)
23.4.12 Flow Improvement – Vortex Generators
23.4.13 Trailing Edge Tabs for Multi-Element Airfoils
23.4.14 Flow Improvement – Nacelle Strakes
23.4.15 Flow Improvement – Bubble-Drag, Turbulators, and Transition Ramps
23.1 Introduction
The purpose of this final section is to gather in one place information considered important by the author, but hard to place in any other specific section.
23.1.1 The Content of this Chapter
• Section 23.2 presents requirements for control surface design. It also details a method to size ailerons based on roll rate responsiveness and fundamentals of pitch and yaw controls.
• Section 23.3 presents a design checklist intended to help the project engineer identify important capabilities and how to design them into the airplane. There are many areas where one can go wrong in the design of a new aircraft. The checklist helps to steer away from some of them.
• Section 23.4 presents examples of possible fixes to faulty aerodynamic characteristics. Since the airplane is a compromise of many focus areas, it is always possible the design will suffer in one or more areas. Aircraft designers have been imaginative in the past and have come up with various means to improve this or fix that, without it having been a part of the original design. It is helpful to the aspiring designer to know there are possible solutions to an imperfect design.
23.2 Control Surface Sizing
The proper sizing of control surfaces is of crucial importance in the development of a new aircraft. The handling of aircraft is often described using two adjectives; sluggish or responsive. For the designer, the former is to be avoided and the latter is the goal. However, the aircraft should be designed to be just responsive enough for its mission. Surprisingly, like insufficient responsiveness, too much is detrimental as well, as it inevitably results in greater structural loads that would call for a heavier airframe. It can also lead to pilot-induced oscillation (PIO). For instance, there is no need to design a cargo transport aircraft to roll 360° per second – it is a maneuver not needed to complete its mission. Instead, the responsiveness only needs to amount to what is needed for handling during landing in turbulent wind conditions.
There are two aspects to control surface sizing: (1) responsiveness and (2) hinge moment tailoring. The former is imperative during the conceptual design phase, while the latter is important during the preliminary one. In this section, simple methods to size the three primary control surfaces, aileron, elevator, and rudder, will be presented. Only a rudimentary introduction will be given on hinge moments.
23.2.1 Introduction to Control Surface Hinge Moments
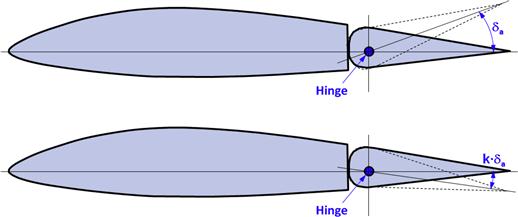
In a conventional, human-operated control system, the pilot must react the aerodynamic hinge moments that results from deflecting a given control surface. Consider the control surface in image A of Figure 23-1, which consists of an airfoil and a flap. Hinge moment analysis effectively returns the magnitude of the actuation force F, which multiplied by the bellcrank dimension d is the hinge moment. The force required to deflect the surface depends on parameters like the geometry of the airfoil and flap, deflection angle (δ), and the AOA of the combination. The force is applied using a stick, a yoke, a “steering wheel,” foot pedals, and, sometimes, a hydraulic or electrical actuation system. There are a number of ways to affect the magnitude of the aerodynamic hinge moment for any given geometry:
(1) One of the most effective means is to modify the overhang by shifting the hingeline (see B and C in Figure 23-1). Shifting it aft reduces the hinge moment. Shifting it forward increases it.
(2) The geometry of the leading edge can also be used to modify the moments, although it must be used with an aft-shifted hingeline, because this will expose it to the airflow (see bottom image of Figure 23-1). For instance, a more “square”-shaped leading edge (see E and F) will decrease the hinge moment as it generates a strong suction peak on the flap ahead of the hinge.
(3) The geometry of the trailing edge can also be modified (see G and H). For instance, a rounded TE (G) will generate a low-pressure region that is located far aft of the hinge –reducing the hinge moment. On the other hand, a sharp protrusion (H) will induce a high-pressure region and increase it.

FIGURE 23-1 The hinge moment (HM) is reacted as a force, either directly by the pilot or by a control system (typically hydraulic or electric). It can be modified by various means.
Hinge moments are highly affected by the geometry of the controls, including the hinge location and shape of the control surface. A general expression for the hinge moment is given below:
![]() (23-1)
(23-1)
where
The hinge moment coefficient is then given by:
![]() (23-2)
(23-2)
The tailoring of hinge moments is a process used to fine tune the hinge moments of a particular control surface so that some desirable stick forces will be sensed by the pilot. This is an essential task for GA aircraft, especially smaller ones, in which the pilot generates the actuation forces. It is also important for the development of boosted control actuation and autopilot integration.
Table 23-1 shows typical flap chord sizes by control surface type and their usual deflection limits. Of course, there are exceptions from these numbers, but typical values are between the numbers presented.
TABLE 23-1
Typical Ranges of Control Surface Flap Chords and Deflection Angles
| Control Surface | Chord Size, Cf | Deflection Angles, δ |
| Aileron | 0.20 to 0.35 | 15° to 25° TEU 15° to 20° TED |
| Elevator | 0.20 to 0.35 | 20° to 27° TEU 15° to 20° TED |
| Rudder | 0.20 to 0.40 | 20° to 25° TEL 20° to 25° TER |
| Flaps | 0.25 to 0.40 | 0° to 10° TEU (cruise flaps) 25° to 50° TED |
23.2.2 Fundamentals of Roll Control
The purpose of the ailerons is to provide control about the airplane’s roll axis, by modifying the rolling moment coefficient, Cl (do not confuse with the section lift coefficient, which shares the same variable name). The most effective way to accomplish this is to modify the airfoil in the outboard region of the wing by changing its camber by deflecting a control surface. This modifies the distribution of lift along the wing, un-symmetrically, which generates a rolling moment. The effect of deflecting ailerons on the distribution of section lift coefficients predicted by potential flow theory can be seen in Figure 23-2. The ailerons are deflected some 15° and the wing’s AOA amounts to 8° at 100 KCAS. Also, Figure 23-3 shows the resulting impact on the flow field behind the wing. It highlights how the wing that travels up generates higher lift-induced drag than the opposite wing, causing a phenomenon known as adverse yaw.
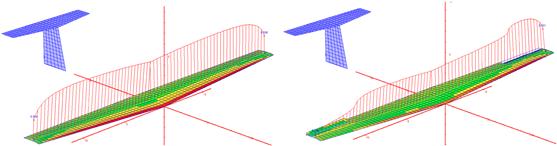
FIGURE 23-2 Typical impact of deflecting ailerons on the section lift coefficients.1
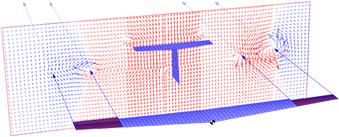
FIGURE 23-3 Impact of aileron deflection on the flow field behind the aircraft predicted by the potential flow theory. Note the difference in the size and source of the various wingtip vortices.2
There are three common types of ailerons used in modern airplanes; plain flap ailerons, Frise ailerons, and spoiler-flap ailerons, also called spoileron (a combination of spoilers and ailerons). Schematics of these are shown in Figure 23-4. Other aileron types include the flaperon (a combination of flaps and ailerons) and elevon (a combination of elevators and ailerons). There also exist some highly specialized types of ailerons such as the slotted-lip aileron and some research project ailerons such as microjet ailerons.
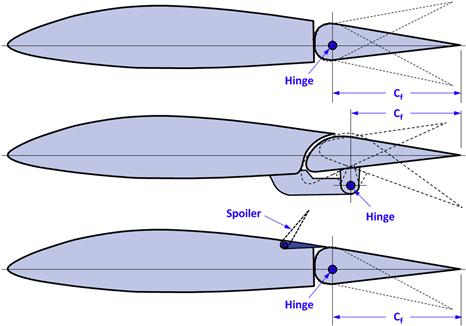
FIGURE 23-4 Three common types of ailerons: plain flap (top), Frise (middle), and spoiler-flap (bottom).
Plain Flap Ailerons
The plain flap is the most common type of aileron configuration. They are very effective and inexpensive to manufacture. For this reason, they can be found on a wide range of aircraft, ranging from primary trainers to commercial aircraft. As can be seen in Figure 23-4 the aileron on the up-going wing is deflected trailing edge down (TED) and the down-going wing is deflected trailing edge up (TEU).
Frise Ailerons
The Frise aileron (see Figure 23-4) was invented by the famed designer Leslie George Frise BSc FRAeS (1897–1979).3 Frise ailerons were first developed during the 1930s [1]. Their purpose is twofold: (1) to reduce stick-forces at high airspeeds and (2) to eliminate adverse yaw. This is accomplished by offsetting the hingeline below the wing surface, introducing a large radius motion to the control surface. The LE of the one deflected TEU will be exposed to the airstream, which, in turn, generates a suction peak which helps reduce the hinge moment. The one deflected TED has its aerodynamic center offset from the hingeline, also helping to reduce the hinge moment.
The aileron reduces or eliminates adverse yaw by forcing the leading edge of the aileron deflected TEU, downward and outside the regular outside mold line. This exposes it to the airstream and increases the drag on that side of the wing (the down-going side). The drag generates a yawing moment and reduces the tendency of the wing to yaw “out of the turn” or opposite the bank. If the leading edge of the aileron is round like the one shown in the figure, a powerful low-pressure region is generated that lowers the hinge moment. This explains its use in both fast and large aircraft before the advent of hydraulically boosted control systems. If the nose is too sharp the lower surface may stall, which can cause severe buffeting [1].
Frise ailerons have seen use on many different aircraft types, among them the B-17, Bell P-39, Grumman F6F-3 and TBF, the Spitfire, Hurricane, Focke-Wulf 190, Curtiss Wright C-46 and DC-4, and many Cessna models.
Spoiler-Flap Ailerons
Several airplanes feature this type of aileron (e.g. Mitsubishi MU-2, Boeing B-52, and others). This aileron type usually features a flap that is deflected TED on the up-going wing and a small spoiler on the down-going side. As the spoiler is deployed it reduces lift on the down-going side, but also increases drag, therefore counteracting adverse yaw tendency. The aileron on that side may or may not deflect TEU at the same time. However, a common complaint is that such aileron systems tend to be sluggish at low airspeeds, as separated flow creeps forward toward the leading edge of the wing, and reduces the effectiveness of the spoiler. This control system may display peculiar side-effects on swept wings. As an example, it is well known that B-52 pilots complain about a significant nose pitch-up moment associated with aileron deflection. It turns out that as the spoilers are deployed the center of lift moves forward, destabilizing the aircraft so it pitches nose-up. An assertive nose pitch-down correction is required by the pilot.
Slot-Lip Ailerons [2,3]
The slot-lip aileron is a lateral control device that regulates the flow of air through a slot made into the wing using a small flap (see Figure 23-5). The flap conforms to the shape of the upper surface of the wing when not in use and is designed reduce the flow of air through the slot. The slot must not be completely closed in the neutral deflection. However, when deployed, air will flow freely through the slot and modify the wing flow-field such that the aircraft can be rolled.
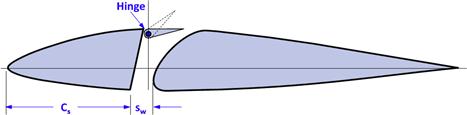
Slot-lip ailerons were investigated in the 1930s in the reports NACA TN-5475 and NACA R-6026. Among results were excessive lag in the control response, which was found to depend on the distance of the device from leading edge (denoted by Cs in Figure 23-5). This lag was found to be excessive unless the device is located some 80% of the chord measured from the leading edge. In general, the aileron was found to result in sluggish response, which explains its rare use in aircraft design.
It was also found that the slot must be open, albeit less open when not in use for roll control. The device delays the stall of the wing tip, while maintaining roll damping, although this is only true if the device is located farther aft than 50% of chord from LE (which is where the resulting lag is high). The aileron was found to increase the drag of the wing by about 10% in cruise and 35% in climb. If simplicity and safety are of higher importance than cruise and climb performance the slot-lip aileron might be useful. It is featured on the Fairchild F-22 test airplane and the GAF N-22 Nomad.
Flaperon
A flaperon is a control surface that serves the role of a flap and aileron. It is typically used with full span flaps. Flaperons are presented in Section 10.4.1, Lift distribution on wings with flaps deflected.
Elevon
An elevon is a control surface for which the elevator serves as an aileron in addition to its normal function. It is used for flying wings and tailless delta-wing aircraft. It can also be found on some variable-sweep winged supersonic fighters.
Differential Ailerons
Figure 8-60 of Section 8.3.10, The effect of deflecting a flap, shows that as a flap is deflected the drag of the airfoil will increase. On a typical aileron configuration, consisting of two plain flap ailerons, the aircraft is banked by deflecting one aileron up and the other one down. The drag of the down-deflected aileron increases over that of the opposite wing, introducing a yawing moment that tends to point the nose of the aircraft in a heading opposite to the banked one.
As stated earlier, this phenomenon is called adverse yaw. Adverse yaw is more pronounced for aircraft with large aspect ratios (AR > 8). In order to help remedy this tendency, differential ailerons are employed. For such ailerons, the deflection angle for the down-deflected aileron is smaller than that of the up-deflected one (see Figure 23-6). This results in less increase in drag and, thus, less adverse yaw. A typical ratio between the up and down traveling ailerons is 1:0.75. This means that if one aileron is rotated 10° TEU, the opposite one will rotate 7.5° TED.
Aileron Design Requirements
Among critical design points for ailerons are the following:
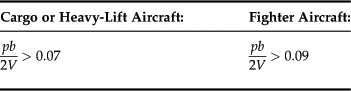
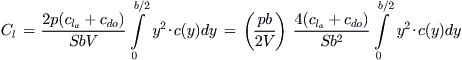
Another term for responsiveness is roll authority. Although responsiveness at slow speeds is imperative (low dynamic pressure requires greater deflection or control surface area, or a combination of the two), high-speed functionality is of great importance as well. It has been known for a long time that a pilot’s conception of adequate roll control is tied to the helix angle made by the wing as the airplane rolls at a given airspeed [4, p. 352], denoted by pb/2V, where p is the roll rate in radians per second for full aileron deflection, b is the wing span (in ft or m), and V is the airspeed (in ft/s or m/s). Thus, it is recommended that for specific types of aircraft the ratios in Table 23-2 are met or exceeded:
For the aircraft designer this means that the physical dimensions of the ailerons can be determined based on the desired roll rate. A step-by-step design approach is presented below. However, first we must define two important stability derivatives: the aileron authority derivative and roll damping.
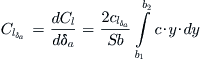
Aileron Authority Derivative Clδa
The aileron authority is used to evaluate the roll capability of an airplane. A method, called the strip integration method, can be used to estimate it. However, it requires the change in the airfoil’s lift coefficient with aileron deflection (denoted by clδa) to be known. Note that capitalization is used to separate Clδa (aileron authority) from clδa (change in lift coefficient with aileron deflection).
 (23-3)
where
Units: per radian or per degree.
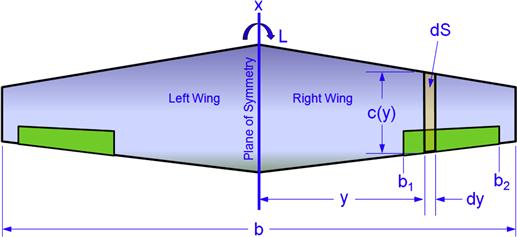
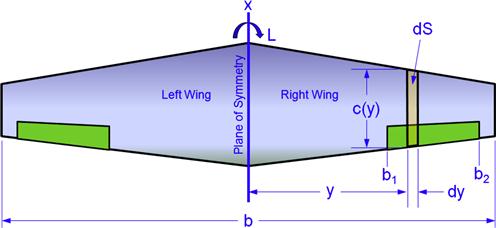
The dimensions b1 and b2 can be seen in Figure 23-7. Note that the expression overestimates the roll authority by not accounting for end effects on either side of each aileron. Example 23-1 compares the analytical Clδa to one calculated using potential flow theory, which does account for the tip effects.
Let’s simplify the solution of Equation (23-3) for two common wing planform shapes.
CASE 1: Straight tapered wing with taper ratio λ:
![]() (23-4)
(23-4)
CASE 2: Rectangular wing (λ = 1):
![]() (23-5)
(23-5)
Derivation of Equation (23-3)
Consider Figure 23-7, which shows the top view of a wing planform. For this derivation it is assumed the aileron on the wing that rotates up is deflected trailing edge down (TED), while the opposite one is deflected trailing edge up (TEU). The lift increases on the former and decreases on the latter, resulting in asymmetry in the lift which generates a rolling moment.
When the aileron is deflected TED, the section lift coefficient in the area of the ailerons will increase by a magnitude clδa·δa and decrease by that same amount on the opposite wing (assuming there is no aileron differential). Thus, the section lift coefficient at a specific spanwise station y becomes:
where cly is the value of the section lift coefficient at station y with the aileron in the neutral position. The general definition of the rolling moment coefficient is:
![]() (iii)
(iii)
where L is rolling moment in ft·lbf or Nm and is typically a combination of moment due to the aileron deflection, La, and restoring moment due to roll rate, Lp. Here we are only concerned with the former. We start by writing the section lift for the up- and down-moving sides at an arbitrary spanwise station y as follows:
![]()
The infinitesimal moment attributed to the area at spanwise station y will thus be the difference between the two forces acting at a distance y from the plane of symmetry:
![]()
This allows us to write the infinitesimal rolling moment due to δa as follows:
![]() (iv)
(iv)
The total moment over the entire span of the ailerons is thus (here the term Cl is used to avoid complicating things with subscripts, even though we are only considering the influence of the aileron deflection):
 (v)
(v)
from which we get the following dependency on the aileron deflection (notice the difference between Cl (rolling moment coefficient) and cl (the section lift coefficient)):
 (vi)
(vi)
QED
Derivation of Equations (23-4) and (23-5)
Assume a straight tapered wing whose taper ratio is λ, root chord CR, and span is b. A parametric representation of the chord as a function of y is given by Equation (9-21):
![]() (9-21)
(9-21)
If the wing features a single airfoil, the lift curve slope with may be assumed constant. Therefore, we can write the aileron authority as follows:
Inserting the limits and manipulating algebraically yields:
![]()
Consider the special case for a rectangular wing, when λ = 1, for which S = CR·b:
![]()
QED
EXAMPLE 23-1
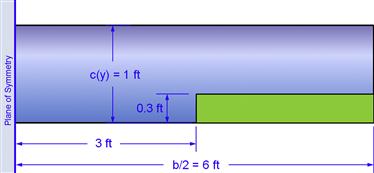
A UAV is being designed with a Hershey bar wing whose dimensions are shown in Figure 23-8. Determine the aileron authority if change in lift with aileron deflection, Clδa, has been found to equal 0.05524 per degree (i.e. 10° deflection increases Cl by 0.5524).
Solution
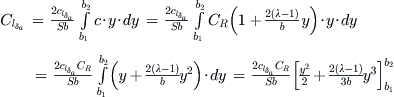
From the figure we see that b1 = 3 ft and b2 = 6 ft. We also see that the wing area S amounts to 12 × 1 = 12 ft2, the wing span is 12 ft, and the chord is a constant 1 ft. Therefore we can evaluate the aileron authority from Equation (23-3), noting that the chord is constant:
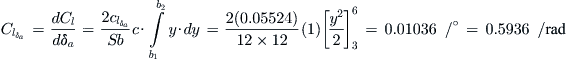
Compare this to Equation (23-5), which results in:
![]()
Additional information: a potential flow model of this wing is shown Figure 23-9, and assumes a symmetrical airfoil. In fact, the value of clδa = 0.05524 /° came from this model and was obtained by deflecting the entire trailing edge (as CL with flap neutral at 2° = 0.51742. CL with flap deflected 1° at 2° = 0.57266; therefore, clδa = (0.57266 − 0.51742)/1° = 0.05524 /°). Therefore, it already includes some tip effects, although this will be compounded when a smaller span aileron is deflected.
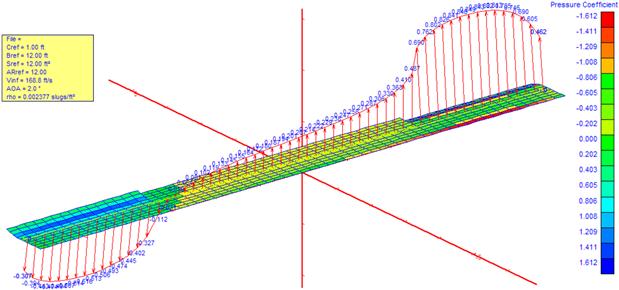
The VL solution accounts for end effects and yields a Clδa of 0.4134 /rad. The distribution of section lift coefficients along the span is shown in the figure. It clearly shows how the section lift coefficients rise gradually rather than instantly, as the strip integration method assumes. Therefore, the roll authority is less than indicated by Equation (23-3).
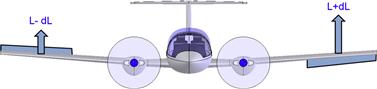
Roll Damping Derivative Clp
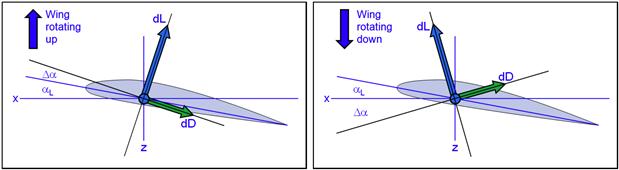
As the wing rolls it becomes asymmetrically loaded as one half rotates up while the opposite one rotates down (see Figure 23-10). This rotation changes the local AOA along the wing. The wing rotating downward is subject to increased local AOAs, while the opposite holds for the wing that rotates up. This asymmetry in the spanwise AOAs creates a moment that resists the roll of the wing. It is called roll damping and is a function of the roll rate, p (in units of degrees/second or, preferably, in radians/second). The derivative is evaluated with respect to the ratio (pb/2V), where b is the wing span, and V is the airspeed. The product pb/2 represents the rotation speed of the wingtip (in units of m/s or ft/s, provided p is in rad/s). When divided by the airspeed V the ratio represents the helix angle (in radians) formed by the motion.
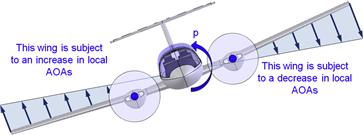
FIGURE 23-10 Arrows show relative airspeed due to roll to the right. This increases the AOA on the right wing (which is to the left in the figure) and decreases it on the left one.
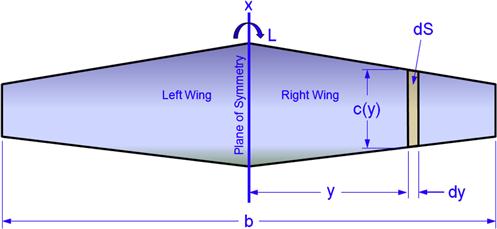
If S and b are the reference wing area and span, c(y) is the wing chord as a function of the spanwise station y, and q is the dynamic pressure, the rolling moment can be calculated using the following expression:
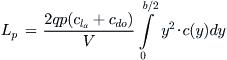 (23-6)
The rolling moment coefficient due to roll damping in terms of (pb/2V) is then calculated as shown below:
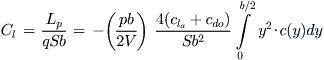 (23-7)
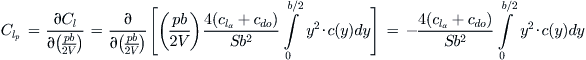
The change in rolling moment coefficient due to roll rate p is called the roll damping coefficient and can be found from:
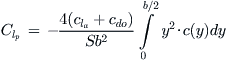 (23-8)
Units: per radian or per degree. The closed-form solution for two common wing planform shapes is given below.
Let’s simplify the solution of Equation (23-8) for two special but common wing planform shapes.
Note that the lift curve slope is the predominant factor in Equation (23-10) as its magnitude is generally much larger than that of the drag coefficient. With this in mind, consider Figure 9-47, which shows how the lift curve changes as a function of AOA. Although the figure is for an entire airplane, airfoils behave in a similar manner. Below stall, at low AOA, the value of clα is positive, so the value of Clp < 0 and this will slow down rotation. However, in the immediate post-stall region clα is negative and the value of Clp > 0, which is a pro-rotation effect. Consequently, the roll damping derivative plays an essential role in the nature of autorotation during spinning.
Derivation of Equations (23-6) and (23-8)
Consider Figure 23-10, noting that the roll rate p (in deg/s or rad/s) changes the local angle of attack by an amount Δα along the entire wing, where Δα is a function of the spanwise station y and airspeed V and is given by:
![]() (i)
(i)
Figure 23-11 shows a cross-section of the airfoil at an arbitrary wing station y on the up- and down-going wings. The first row shows the original angle-of-attack (AOA). The second row shows the change in AOA due to the roll, and the bottom row shows the combination of the two. Figure 23-12 shows pertinent wing dimensions for this derivation.
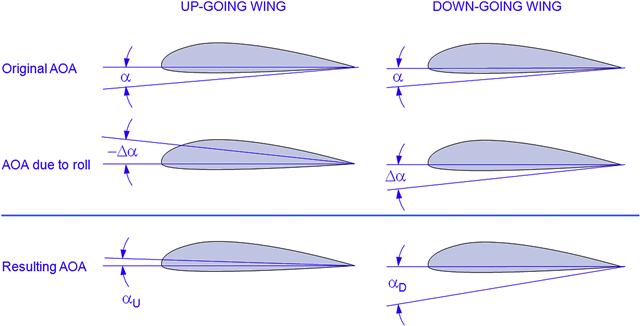
The change in the section lift coefficient due to the roll rate, Δcly, can now be expressed as shown below:
![]() (ii)
(ii)
Where clα(y) and cdo are the airfoil’s 2D lift curve slope and drag coefficient at the specific flight condition at wing station y. Now, consider the drag coefficient of the airfoil at that station:
![]() (iv)
(iv)
We can now write the infinitesimal lift and drag as follows:
where q is the dynamic pressure and c(y) is the chord at station y.
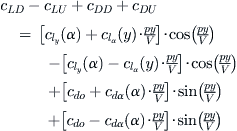
Now we must estimate the projections of the lift and drag onto the z-axis, which is normal to the axis of rotation (the x-axis). Refer to Figure 23-13, which shows the alignment of the x-z axes with respect to the lift and drag. The rotation takes place about the x-axis and the retarding moment (roll damping) is generated through the force that acts perpendicular to it, the z-axis. Therefore, we can determine the roll damping force:
![]() (vii)
(vii)
Ultimately, the moment due to roll is caused by the asymmetric loading on the wing, or, more precisely, its projection onto the z-axis. The image shows we can define the projections of the lift and drag coefficient on the z-axis as follows (note that positive z is down):
![]() (viii)
(viii)
![]() (ix)
(ix)
![]()
![]() (x)
(x)
![]() (xi)
(xi)
![]() (xii)
(xii)
![]()
![]() (xiii)
(xiii)
The roll damping is caused by the difference between dZU and dZD, integrated across the wing (note that the limits of integration are 0 to b/2). The difference between the two is given by:
![]()
Consider the summation of the lift and drag coefficients. Inserting the coefficients as defined above results in:

Simplifying and assuming the 2D clα to be constant along the span:
![]()
Therefore, the summation is:
![]() (xiv)
(xiv)
If the roll rate is low enough to assume small angle relations (cos Δα ≈ 1 and sin Δα ≈ Δα), we can rewrite Equation (xiv) as follows:
![]() (xv)
(xv)
The total restoring moment due to roll, Lp, is thus:
 (xvi)
(xvi)
Or:
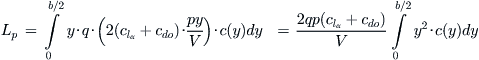 (xvii)
From the definition of the rolling moment coefficient we get:
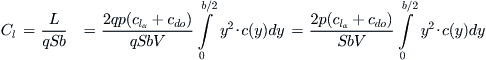 (xviii)
Preparing this in terms of (pb/2V) (since that’s our intended to differential) leads to:
 (xix)
(xix)
Finally, we can determine the roll damping derivative by differentiating with respect to (pb/2V) and then evaluate the geometric integral. Note that since the effect retards the motion it is always negative:
 (xx)
(xx)
QED
Derivation of Equations (23-9) and (23-10)
Assume a straight tapered wing whose taper ratio is λ, root chord CR, and span is b. A parametric representation of the chord as a function of y is given by Equation (9-21):
![]() (9-21)
(9-21)
Inserting this equation into Equation (xx) and expanding we get Equation (23-9);
We get Equation (23-10) for a rectangular wing, when λ = 1, for which S = CR·b:
![]()
QED
EXAMPLE 23-2
Determine the roll damping of the wing of EXAMPLE 23-1 and compare to that of the vortex-lattice method. Assume cdo = 0.010.
Solution
Begin by calculating the lift curve slope for the wing, Clα, here using Equation (9-57), assuming M ≈ 0, and the airfoil’s 2D lift curve is 2π. Also assume the following wing characteristics:
β = Mach number parameter (Prandtl-Glauert) = (1 − M2)0.5 ≈ 1
Therefore:

So we find that the roll damping using Equation (23-10) amounts to:
![]()
In comparison, using the same vortex-lattice model as shown in Figure 23-9, the roll damping was found to equal −0.6366 /rad with ailerons deflected 15° and −0.6388 /rad with neutral ailerons. The model analysis accounts for tip effects, which is not the case for the analytical method of Equation (23-10).
23.2.3 Aileron sizing
With the preliminaries out of the way in the preceding section, it is now possible to present the following method to help with the sizing of the ailerons. The procedure involves estimating the steady-state roll rate using the aileron authority and roll damping derivatives.
Estimating Steady-State Roll Rate
When the ailerons are deflected the airplane begins to roll (see Figure 23-14). The motion consists of a transient acceleration that disappears once the roll rate increases and after which there is a steady roll rate. This the steady-state roll rate, which is helpful in determining a pilot-desired responsiveness.
The steady-state roll helix angle is determined from:
![]() (23-11)
(23-11)
Note that the steady-state roll rate (in rad/sec) can be determined from:
![]() (23-12)
(23-12)
STEP 1: Initial Dimensions
Establish initial dimensions based on Figure 23-15. Also determine the likely aileron deflection angle, δa. Note that the control system will stretch in flight, reducing the maximum ground deflection. This means that a control system designed for a maximum deflection of, say, 15° on the ground may only deflect as much as 75% of that in flight. Some control systems are so poorly designed4 that they may only achieve 25% of the maximum deflection. At any rate, 75% is a reasonable “first stab” estimate for an average control system. This would mean that a maximum deflection of 15° is closer to 11.3° in flight.
STEP 2: Estimate Roll Damping
Using the geometry from STEP 1, estimate roll damping, ![]() . Use Equation (23-8) for an arbitrary wing planform shape, Equation (23-9) for a straight tapered wing, and Equation (23-10) for a “Hershey bar” wing.
. Use Equation (23-8) for an arbitrary wing planform shape, Equation (23-9) for a straight tapered wing, and Equation (23-10) for a “Hershey bar” wing.
STEP 3: Estimate Roll Authority
Using the geometry from STEP 1, estimate the roll authority, ![]() . Use Equation (23-3) for an arbitrary wing planform shape. Use Equation (23-4) for a straight tapered wing, and Equation (23-5) for a “Hershey bar” wing.
. Use Equation (23-3) for an arbitrary wing planform shape. Use Equation (23-4) for a straight tapered wing, and Equation (23-5) for a “Hershey bar” wing.
STEP 4: Estimate Roll Helix Angle
Determine a desired “target” roll helix angle per Section 26.4.2 using Equation (23-5). If the calculated value is less than the selected target enlarge b1 or b2, or both. Note that b2 can never be larger than b/2 and 0 < b1 < b2.
Special Case Aileron Sizing: Constant-Chord Wing
The following expression can be used to determine the spanwise location of the inboard edge of the aileron, for a given outboard edge. It only applies to constant-chord (“Hershey bar”) wings.
where
Derivation of Equation (23-11)
Assume the wing is rigid and the rolling motion is caused by deflecting the ailerons to an angle δa. Further assume the roll rate p is impeded by the roll damping due to a local change in AOA along the wing (with a minor contribution from the vertical tail). Therefore we can write the equation of rolling motion for the aircraft as follows:
![]() (i)
(i)
where IXX is the aircraft’s moment of inertia (in slugs·ft² or kg·m²) ![]() is the roll acceleration in rad/s², L is the rolling moment in ft·lbf or N·m, and δa is the aileron deflection in degrees.
is the roll acceleration in rad/s², L is the rolling moment in ft·lbf or N·m, and δa is the aileron deflection in degrees.
![]()
QED
Derivation of Equation (23-13)
Begin with Equation (23-11) and solve for Clδa:
![]() (i)
(i)
Insert Equation (23-5):
![]() (ii)
(ii)
Since our target is to determine the inboard station, b1, for the aileron we solve for it:
![]() (iii)
(iii)
QED
EXAMPLE 23-3
A UAV is being designed with a Hershey bar wing whose dimensions are shown in Figure 23-16. The maximum aileron ground deflection is 20°. Assuming that 75% of that will be achievable in flight, determine the roll rate for maximum aileron deflection at V = 100 KTAS if change in lift with aileron deflection, clδa, has been found to equal 0.05524 per degree. NOTE that this geometry is analyzed in EXAMPLES 22-1 and 22-3. Compare the results to that obtained from the Vortex-Lattice code SURFACES presented in the same examples.

Solution

STEP 3: Determine the Roll Helix Angle
Based on this the roll rate at 100 KTAS can be found from Equation (23-5), where the maximum achievable deflection amounts to 20° × 0.75 = 15°:
![]()
STEP 4: Determine the Roll Rate p
![]()
Determining the roll rate using the vortex-lattice solution from SURFACES (see Examples 23-1 and 23-2):
![]()
The VL solution accounts for tip effects.
Maximizing responsiveness
Some airplanes require flap span to be maximized to meet requirements for stall speed. This means that the aileron span is less than ideal. The designer can attempt to improve the effectiveness of the remaining ailerons by positioning the centroid of the aileron planform as close as possible to the location where their spanwise section moment reaches maximum.
Consider the tapered wing planform (halfspan) in Figure 23-17, which shows the spanwise section moment (analogous to section lift or section lift coefficient) van be defined as follows:
![]()
where
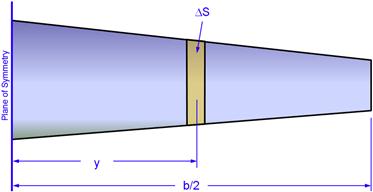
Figure 23-18 shows the variation of the section rolling moment coefficient along the span of the wing shown in Figure 23-2. It shows that the peak of the section moment coefficients on the wing with the ailerons neutral occurs near the 85% spanwise station. This is where one should try to place the aileron centroid of small ailerons to help achieve maximum responsiveness. The location of this peak is highly dependent on the wing geometry.
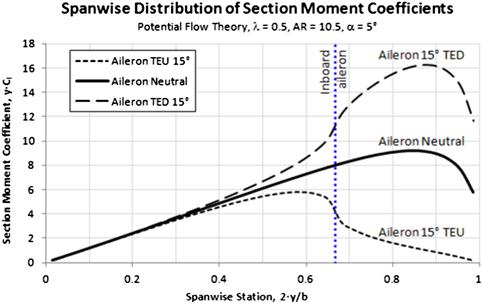
FIGURE 23-18 Distribution of section moments along the wing (in Figure 23-2).
23.2.4 Fundamentals of Pitch Control
The purpose of the elevator is to provide control about the airplane’s pitch axis, by modifying the pitching moment coefficient, Cm. Figure 23-19 shows the pitching moment coefficient, Cm, versus angle-of-attack (AOA) for an airplane with a conventional tail. This graph does not belong to any specific aircraft type, but rather shows typical results from a wind tunnel test for such an aircraft. The three curves represent the Cm for the complete aircraft with different elevator deflections and show how deflecting the elevator will allow the pitching moment curve to be moved around. The top curve shows the Cm with the elevator deflected 20° TEU (δe = −20°) as would happen for a nose pitch up (climb or stall). The center curve depicts the elevator in a neutral position (δe = 0°), and the bottom depicts the elevator deflected 15° TED (δe = +15°), as would happen if the airplane’s nose were pitched down (e.g. a dive). The separation between the curves represents the effective elevator authority for the aircraft. The curves show the classic linear downward slope required for a naturally statically stable aircraft and then a transition into nonlinear curves associated with the post-stall AOAs. When the airplane is operated at low AOAs, the airflow is mostly attached and the Cm changes linearly. However, with higher and higher AOAs larger areas of the airplane become covered with separated flow and this is the main cause for the non-linearity.
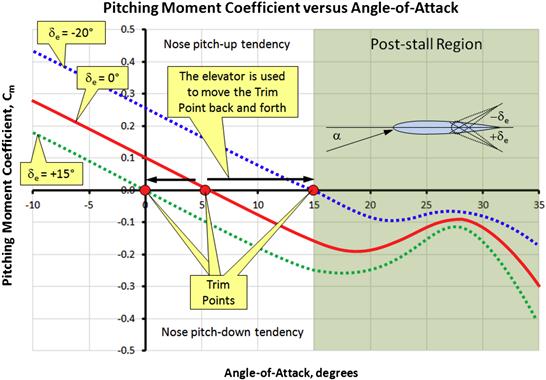
Now, consider the linear section of the curves as they intersect the horizontal axis at different AOAs. For instance, the top curve (labeled with δe = −20°) intersects the AOA axis at a α ≈ 15°, the center curve at a α ≈ 5.5°, and the bottom curve at a α ≈ 0°. Each of the three points indicates that the airplane’s Cm has reached zero – in other words, the aircraft is trimmed at that particular AOA. For that reason, they are called trim points. Trimmed means that as long as the slope of the curve is negative, the airplane will “want” to stay at that attitude (AOA) until disturbed again – the trim point is an equilibrium point. It is important to keep the following in mind. In order for the airplane to remain trimmed in this fashion, two things have to happen: (1) The slope of the Cm must be negative, and (2) the value of Cm must be zero. If the slope is positive, the airplane will continue to pitch and will not stop at Cm = 0. The whole purpose of putting a tail on an airplane is to force the pitching moment curve for the airplane to have a negative slope. And the whole purpose of featuring an elevator is to allow the pilot to move the trim point back and forth. This way, there exists one and only one trim point for any airspeed and the airplane must also have enough thrust to maintain flight at that airspeed, whether it is generated mechanically or by gravity (as for sailplanes). Note that for real airplanes there is only one curve, and not three as shown in the graph, and the pilot can move it back and forth at will. The three curves are only shown to indicate the trim range.
The importance of the three curves is that they also indicate the controllability or the control authority of the aircraft. For instance, if the pilot moves the elevator to the neutral position (the center curve), the aircraft would be trimmed at approximately α ≈ 5.5° as stated earlier. If he deflects it to −20° it would trim at α ≈ 15° and so on. The airplane might have a maximum elevator deflection of −25°, allowing the pilot to bring it to an even higher AOA and to stall if necessary. The curves show that the pilot can control the trim AOA by simply deflecting the elevator and that way move the trim point to a higher or a lower AOA. This, of course, is elementary information that any student of aerospace engineering is exposed to.
The required size of the elevator should be based on the investigation of the capability of the aircraft at the extreme conditions stipulated in Sections 11.2, 23.3, and the additional tools provided in Appendix C1.6. Such an investigation should plot the required AOA and elevator deflection over the entire speed range of the aircraft and include the extremes of the CG envelope. The sizing should ensure the required elevator deflection is less than what is available, per Section 23.3.
23.2.5 Fundamentals of Yaw Control
The rudder sizing depends generally on two conditions: crosswind requirements and, if the aircraft is multiengine, on one-engine-inoperable (OEI) asymmetric thrust requirements. Additional requirements would be spin recovery; however, this is particularly challenging to analyze because of the separated flow field the rudder operates in. For this reason, the rudder is generally sized for the crosswind and asymmetric thrust and there is a good chance it will be adequately sized for spin recovery, provided the fin is not blanketed by a horizontal tail or fuselage.
Figure 23-20 shows the yawing moment coefficient, Cn, versus angle-of-yaw (AOY) for an airplane with a conventional tail. Like Figure 23-19, this graph does not belong to any specific aircraft type either, but rather shows what results one would expect from a wind tunnel test. The three curves represent the Cn for a complete aircraft with the rudder deflected left, neutral, and right. As with the elevator, it shows how deflecting the rudder will shift the yawing moment curve up or down, so the airplane is trimmed with the nose pointed to the left or right. The left-most curve shows the Cn with the rudder deflected 20° trailing edge left (TEL) (δr = +20°) as would happen for a nose-left slip. The center curve depicts the Cn with the rudder in a neutral position (δr = 0°), and the bottom one depicts the rudder deflected 20° trailing edge right (TER) (δr = −20°), as would happen for a nose-right slip. The separation between the curves represents the effective rudder authority for the aircraft. The curves show the classic linear upward slope required for a naturally statically and directionally stable aircraft. It also shows that below a certain AOY (typically around 12–15°) the Cn is linear, but beyond becomes nonlinear curves associated with the post-stall AOYs.
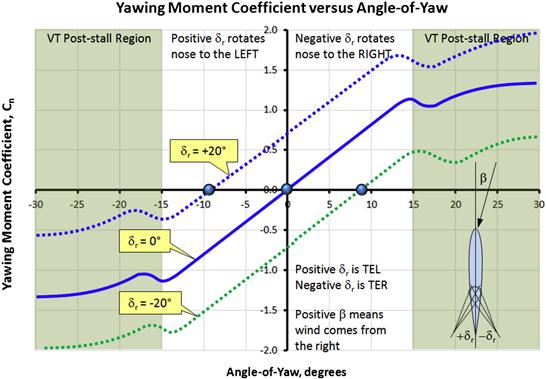
FIGURE 23-20 Yaw control explained. VT stands for vertical tail, TEL for trailing edge left, and TER for trailing edge right.
As discussed in Section 11.2.8, Requirements for static directional stability, the slope of the Cn curve must be positive as shown in Figure 23-20 for the aircraft to be directionally stable. This is indicated by the magnitude of the stability derivative Cnβ, i.e. the directional stability. The required size of the rudder should be based on the investigation of the capability of the tail at the extreme yaw conditions stipulated in Sections 23.3. Such an investigation should evaluate the AOY the airplane can be trimmed to with a given rudder deflection over the entire speed range of the aircraft and take into account the extremes of the CG envelope. The sizing should ensure the required rudder deflection is less than what is available, per Section 23.3.
23.3 General Aviation Aircraft Design Checklist
The purpose of the following checklist, which is compiled based on the author’s own experience, is to help the designer of new aircraft steer away from likely pitfalls during the design process. The designer should try and meet all the capabilities listed below, most of which are intended to increase the safety of the airplane. The list is based on aircraft that boast a long and safe operational history. Any airplane that meets the requirements below will provide ample controllability and good handling. Note that many of the concepts are introduced in various chapterss of the book, but are collected here for convenience.
23.3.1 Crosswind Capability at Touch-Down
The airplane should be capable of maintaining straight and level5 flight while yawed 12–15° (β) at an airspeed amounting to 1.2 × VS0, where VS0 is the stalling speed in the landing configuration, with sufficient power to maintain the airspeed. This corresponds to a crosswind component of approximately:
![]() (23-15)
(23-15)
How to Assess
This capability should be evaluated by a trim analysis at β = 15° and V = 1.2VS0, with the CG in the most adverse location and with power required to establish a 3° approach angle. The control surface deflection required to trim the airplane should comply with the following:
A factor like 0.75 is intended to leave 25% deflection capability remaining to allow the pilot to respond to gusts. If met, this requirement prevents the control surfaces from being undersized.
23.3.2 Balked Landing Capability
The airplane should be capable of climbing in the landing configuration with full power at the reference airspeed and the CG at the most adverse location (forward for conventional aircraft). At this condition the dynamic pressure is low, which will require large control surface deflection. If met, this requirement prevents the HT from being undersized (also see Section 23.3.3, Take-off rotation capability). Paragraph 14 CFR 23.73 defines reference airspeed as follows:
Normal, Utility, and Aerobatic piston-powered aircraft with W0 ≤ 6000 lbf:
![]() (23-16)
(23-16)
Normal, Utility, and Aerobatic piston- and turbine-powered aircraft with W0 > 6000 lbf:
![]() (23-17)
(23-17)
Commuter category aircraft with W0 > 6000 lbf:
![]() (23-18)
(23-18)
where
VS0 = stalling speed in the landing configuration.
VS1 = stalling speed in the take-off configuration (max T-O flap setting).
How to Assess
The capability should be evaluated by a trim analysis. It must be possible to trim the aircraft at VREF and it must be capable of a 3% climb gradient while at:
(2) at the forward end of the proposed CG envelope,
(3) in the most adverse configuration (typically the landing configuration).
Control system stretch must be taken into account (see Section 23.3.13, Control system stretching).
23.3.3 Take-Off Rotation Capability
The aircraft must offer a large enough elevator authority to allow the airplane to be rotated at airspeeds below the liftoff speed, VLOF, with the CG in the most adverse location (forward for conventional aircraft). If met, this requirement (also see Section 23.3.2, Balked landing capability) will prevent the HT from being undersized for elevator authority.
How to Assess
This capability can be evaluated using the formulation required to comply with Section 13.3.4, Tricycle landing gear reaction loads. Also, see Example 13-1. Strictly speaking, the analysis should demonstrate that the load on the nose landing gear can indeed be brought to zero before the airplane reaches its lift-off airspeed, VLOF.
23.3.4 Trim at Stall and Flare at Landing Capability
The aircraft must be designed with enough elevator authority to drive it to the desired stalling speed in the most adverse configuration as detailed below. The stalling speed is the lowest airspeed at which the airplane can maintain level flight. If the airplane has insufficient elevator authority it will not experience a normal “stall-break” (i.e. the sudden nose-drop that indicates the stall event). Instead it will descend rapidly at airspeed higher than the stalling speed. As far as aviation authorities are concerned, this becomes the airplane’s minimum airspeed. This can result in a serious design predicament, especially if the aircraft is designed to comply with regulations such as 14 CFR Part 23, which has a stall speed limit of 61 KCAS for single-engine aircraft, or Light-Sport Aircraft regulations, which have a stall speed limit of 45 KCAS (14 CFR 1.1).
Another easily overlooked characteristic is the ability for the pilot to flare the aircraft in the most adverse configuration during touch-down. There are examples of aircraft that have been certified with insufficient elevator authority. Such airplanes pose a serious risk to unsuspecting pilots. It is the purpose of regulatory authorities to ensure such aircraft don’t slip through the cracks. Any certified aircraft discovered to suffer from insufficient elevator authority should have a forward CG limitation imposed on it.
Strictly speaking, the stall speed is the airspeed below which the airplane’s nose pitches down uncontrollably. When we say trim at stall (see below), we mean the airspeed just above the stall speed.
How to Assess
It must be possible to trim the aircraft at VS0 while at:
(2) at the forward end of the proposed CG envelope,
(3) in the most adverse configuration (typically the landing configuration).
Control system stretch must be taken into account (see Section 23.3.13, Control system stretching).
23.3.5 Stall Handling Capability
The aircraft should be designed with forgiving stall characteristics. This means it should offer natural resistance to wing roll at stall (which often leads to inadvertent spins) and be devoid of deep stall tendencies. The designer can tailor the wing to help promote resistance to roll off (see Section 9.6.4, Tailoring the stall progression). This can be accomplished with geometric wing twist, or washout, but also by selecting a high-lift airfoil as a tip airfoil, even at the cost of cruise performance. While such tailoring is debatable for aircraft such as high-speed passenger airplanes equipped with stick-pushers or shakers, it should be the norm for General Aviation aircraft. Deep stall tendency is prevented by a proper location of the horizontal tail. T-tails are prone to this condition; however, they are often desirable due to stylish appearance or some other reasons, such as to introduce end-plate effects for directional stability or lengthing the tail arm of short fuselages. Such airplanes should be tested to validate that the condition does not exist and, if it does, they should be fitted with adequate ventral fins to remedy it.
How to Assess
Roll-off at stall – provide adequate wing washout, even if it means a slight detriment to cruise efficiency. Consider an airfoil at the wingtip that has higher Clmax than the inboard airfoils, even if this calls for an airfoil that has a turbulent boundary layer. Refer to Section 9.6.4, Tailoring the stall progression for more details.
Deep-stall condition – demonstrate compliance in a wind tunnel (or by other reliable and acceptable means) that no trim points exist in the post-stall region, in particular where elevator authority is diminished due to flow separation.
23.3.6 Stall Margin for Horizontal Tail
Airplanes of conventional tail configuration may suffer from a horizontal tail stall if subjected to extreme wing downwash conditions, such as those that result from the deployment of high-lift devices. This can increase the angle-of-attack on the stabilizing surface so it stalls. This may cause nuisance such as a broken nose gear and ground-struck propeller, if the HT stalls during flare, to dangerous in-flight handling problems that may cause the airplane to pitch over, nose-first, when flaps are deployed.
How to Assess
During the design phase perform an analytical stability check on the airplane in its most adverse condition, with full flaps and most adverse forward CG, and estimate the spanwise distribution of section lift coefficients along the HT. This check should be accomplished using a vortex-lattice or doublet-lattice solver as the minimum and, ideally, a Navier-Stokes solver or a wind tunnel test. It is not enough to calculate the total lift coefficient required by the HT as this will not fully indicate how far from this value the section lift coefficients deviate. For instance, the total lift coefficient generated by the HT in Figure 23-21 amounts to about 0.95, while the section lift coefficients peak at almost 1.1. The maximum section lift coefficient on the control surface should be no more than about 0.2 from the airfoil’s maximum lift coefficient in the worst-case scenario.
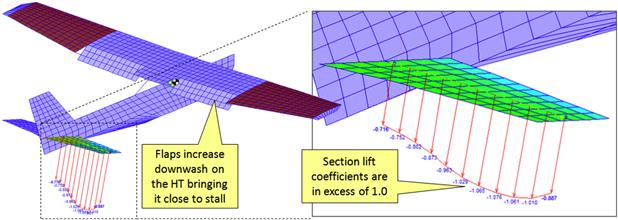
FIGURE 23-21 A vortex-lattice model of a high-wing aircraft with an all-movable stabilator reveals the section lift coefficients on the stabilator are close to their maximum values. This corresponds to a condition in which the airplane is being flared for landing. Airspeed is 55 KCAS, AOA is 10°, flaps are deflected 30° and the stabilator 15°.
23.3.7 Roll Authority
The airplane must meet the desired or the most appropriate roll capability that suits the class the airplane is being designed for. This will prevent the ailerons from being undersized. An aerobatic airplane will have a steady-state roll rate exceeding 130°/sec at its cruising speed and sometimes in excess of 360°/sec. A responsive GA aircraft can roll as fast as 90°/sec and a sluggish one at perhaps around 30°/sec. Roll requirements are stipulated in 14 CFR 23.157, Rate of Roll. The paragraph is split into two parts: take-off and approach for landing, as follows.
Take-Off Requirement
The airplane must have flaps in the T-O position and retractable landing gear should be in the stowed position. Single-engine aircraft must be at maximum T-O power. Multiengine aircraft must have the critical engine inoperative (see Chapter 14, The anatomy of the propeller) and the others at the maximum T-O power. The airplane shall be trimmed at airspeed equal to the greater of 1.2VS1 or 1.1VMC or as close as possible in trim for straight flight. In this condition, the airplane must be capable of rolling from −30° to +30° (or the other way around) within the following time constraints:
![]() (23-19)
(23-19)
Approach Requirement
The airplane must have flaps in the landing position and retractable landing gear must be extended. All engines must be operating a power setting for a 3° approach angle. The airplane shall be trimmed at VREF. In this condition, the airplane must be capable of rolling from −30° to +30° (or the other way around) within the following time constraints:
![]() (23-20)
(23-20)
How to Assess
During the conceptual or preliminary design phase, the designer should evaluate the aileron authority derivative (see Section 23.2.2, Fundamentals of roll control) and calculate the steady-state roll rate at the high- and low-speed ends of the flight envelope (see Section 19.2.11, Flight envelope). This should then be compared to the requirements of 14 CFR 23.157 to evaluate whether the design will comply. It is imperative not to overlook the fact that the aileron span cuts into the span of the flaps. Therefore, if the solution to a potentially sluggish design is to add aileron span, the impact on the stalling speed of the vehicle should be evaluated as well. However, the evaluation should not stop there. The designer should calculate the aileron authority derivative for other aircraft as well for comparison; in particular, aircraft that are known to be considered sluggish by its pilots. Sluggishness should be designed out of the aircraft during the conceptual design phase – failing to do so may require difficult design fixes once the proof-of-concept aircraft demonstrates lack of responsiveness.
23.3.8 Control System Harmony
Design the control system so the harmony in control forces will be aileron:elevator:rudder = 1:2:4. This means that the effort required to actuate the elevator will be about 2 times that of the aileron and the rudder about 4 times that of the aileron. This calls for awareness of how to estimate hinge moments of control surfaces and control system gains.
23.3.9 Climb Capability
With all engines operating, the airplane must have enough power to maintain the following steady climb gradients (also see Section 18.3, General climb analysis methods, on how to calculate VY) at sea level:
Normal, Utility, and Aerobatic piston-powered aircraft with W0 ≤ 6000 lbf:
![]() (23-21)
(23-21)
![]() (23-22)
(23-22)
where VY = best rate of climb airspeed in KTAS.
These are legal minimums6 at maximum continuous power (MCP) conditions at sea level. The airplane may have landing gear retracted and flaps in the take-off position. The value of VY for multiengine airplanes shall be greater or equal to the greater of 1.1VMC and 1.2VS1. For single-engine aircraft VY shall be greater or equal to 1.2VS1.
Normal, Utility, and Aerobatic pistons and turbine powered aircraft with W0 > 6000 lbf:
These are legal minimums at take-off power at sea level. The airplane shall have landing gear extracted unless it can be retracted in fewer than 7 seconds. Flaps shall be in the take-off position.
How to Assess
Demonstrate through analysis, assuming conservative conditions, by evaluating the capability on a hot day (ISA+20°C) at S-L and diminished propeller efficiency or jet engine thrust. Although not a direct requirement, multiengine aircraft should be evaluated in the take-off condition. Consider redesign if the condition is marginally met, including more powerful engines.
23.3.10 One-Engine-Inoperative Trim and Climb Capability
Multiengine aircraft, in particular twins, must offer safe trim capability and enough power to climb with one engine inoperative (see Chapter 14, The anatomy of the propeller, for important details). Such aircraft must be capable of straight and level flight (albeit with control surfaces deflected).
How to Assess
During the development phase of the aircraft, this capability can be demonstrated through analysis using the analyses methods presented in this book; for instance those of Chapter 18, Performance – climb, using reduced engine power, increased drag coefficient (due to asymmetry), at gross weight, and on a hot day (ISA+20°C). Consider redesign if the condition is marginally met, including more powerful engines.
23.3.11 Natural Damping Capability
The airplane should be designed such that dynamic stability modes are naturally damped. Diverging non-oscillatory modes may be acceptable, albeit undesirable, provided the time to double amplitude is long enough to allow the pilot to effortlessly correct them. However, oscillatory modes should always be convergent.
How to Assess
Perform a detailed dynamic stability analysis of the airplane in all operational configurations (take-off, cruise, and landing) over the operational flight envelope of aircraft. All oscillatory modes should be convergent, as required by applicable airworthiness regulations. Identify regions of divergent dynamic modes, if these exist, and consider the introduction of aerodynamic fixes or limitations of the flight envelope. Ultimately, these can be lifted if findings are rejected by flight test work.
23.3.12 Fuel Tank Selector
Airplanes equipped with multiple fuel tanks and a fuel tank selector should always place it inside the cockpit in the field of view of the pilot. Never place it so the pilot has to look away or “feel” to figure out the currently selected fuel tank. A large number of aircraft crash every year because of fuel starvation attributed to a pilot running out of fuel after “thinking” he had selected the correct tank. Also, when flying by Instrument Flight Rules (IFR), vertigo can result if the pilot is forced to turn away from the instrument panel to view the fuel selector. The convenience of the pilot takes precedence over the convenience of the engineer or the technician routing or installing the fuel selector valve.
How to Assess
When designing the cockpit ensure the fuel tank selector is inside the pilot’s field of view and range of reach. This important control should be treated as if it was between the primary (ailerons, elevator, rudder, throttles, etc.) and secondary controls (flaps, trim controls, speed brakes, etc.) in importance. The detail may have to be developed using a cockpit mockup.
23.3.13 Control System Stretching
As the primary controls (ailerons, elevator, and rudder) are deflected in flight, the aerodynamic loading will stretch cables and loads will be reacted by pulleys and other parts of the control system. This can result in a substantially smaller deflection than what is measured on the ground (see Figure 23-22). The consequence is a serious reduction in control responsiveness.
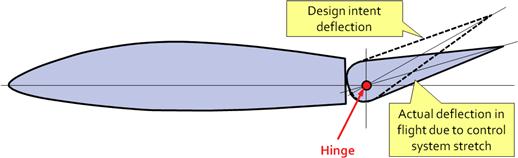
Some control systems are so poorly designed that perhaps some 25% of the ground deflection is available in flight. The result is sluggish responsiveness, if not outright dangerous handling characteristics. Consider an airplane initiating a flare maneuver just before landing at a forward CG. This maneuver may require, say, 10° of elevator deflection. A flexible control system could only result in, say, 5°, with the stick fully aft. An unsuspecting pilot might discover this at the time of touch down and the result may be a broken nose landing gear if not worse. This would most probably be discovered in the flying prototype, where a mishap could jeopardize the success of an otherwise promising design.
A typical design mistake is displayed in Figure 23-23. A couple of pulleys, called A and B, have been mounted to brackets (or intercostals) that are attached to a bulkhead. The bracket for pulley A is considerably longer than for pulley B. As a consequence, when the control system is loaded up, pulley A will be displaced considerably, which will cause cable slack, which will results in a less control surface deflection. It is imperative that the control system designer is aware of such pitfalls so they can be avoided.
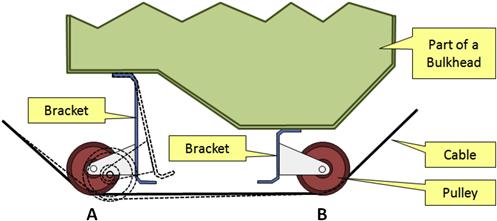
FIGURE 23-23 Control system loads cause the cable-pulley system to flex excessively, rendering it ineffective.
How to Assess
Always perform a load analysis of the control system. In particular, evaluate reaction forces in hardpoint areas, where pulleys are mounted to the airframe. Knowing the reaction forces at each hardpoint, determine the deflection of the structure to which the pulleys are attached. With this information estimate the total deformation of the control system. For instance, consider an elevator control system designed to deflect to a maximum deflection of 20° on the ground. The pilot should be capable of deflecting it to at least 15° with maximum aerodynamic loads applied. If unable to, the control system is improperly anchored to the airframe.
23.3.14 Control System Jamming
Control system jamming is a serious threat in brand new airplane designs. It is easy to overlook how control surfaces could get stuck (or jam) as they flex due to air loads, or how the deformation of the control system might get cables and pushrods into positions that might get things stuck.
How to Assess
Conduct a design review with cognizant engineers fully dedicated to looking at possible control system jamming scenarios. Do not dismiss possible scenarios that seem “outlandish.” It is those scenarios that seem unlikely that may manifest themselves in practice. Get fresh eyes to look at the design as well. Be critical.
23.3.15 Ground Impact Resistance
Airplanes with forward-facing firewalls should feature a canted firewall (see Figure 23-24). This may prevent the aircraft from “digging in” during a possible nose-down-attitude crash and improve the vulnerability of the occupants that might result from the sudden deceleration from an otherwise survivable mishap.

How to Assess
Design a forward-facing firewall so its lower edge is canted aft as shown in Figure 23-24. Awareness is the key and will render the topic a non-issue if this is considered during the conceptual/preliminary design phase.
23.3.16 Reliance Upon Analysis Technology
The current advances in computer analysis methods present a particularly serious pitfall for the aircraft designer. Extremely compelling images generated by such software make it easy for even the most seasoned designer to forget to second-guess the results. However, such results may be way off. Figure 23-25 shows an example of two computational methods as compared to an experiment for the NACA 4415 airfoil as reported in the report NACA R-824 [5]. One uses the widely used code Xfoil and the other is the vortex-lattice code SURFACES. Two important observations can be made by studying the figure.
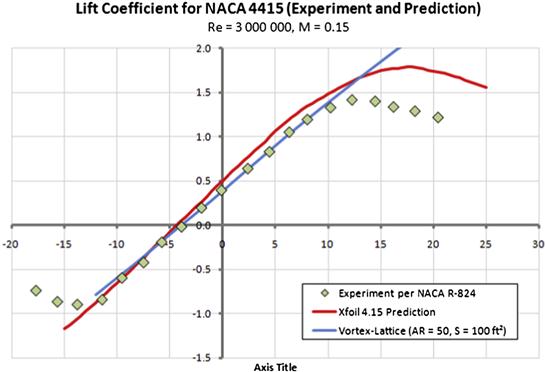
First, inviscid computational methods such as the vortex-lattice method (VLM) do not predict flow separation. While the VLM results are in good agreement with the experiment, this is only true in the linear range. The speed and flexibility of the VLM make it a great tool for the aircraft designer, but only as long as the airflow is mostly attached. For instance, in this particular example, the VLM results are acceptable over the AOA range of −12° < α < 10°.
Second, while Xfoil predicts a “gentle” stall behavior as shown in the experiment, its predictions are off in slope, and both CLmax and αCLmax are too large, just to name a few. The important point is that it is easy for the aircraft designer to take such predictions at face value and, in this case, greatly underestimate wing area. The best advice is to check results for similar airfoils first and fully understand the limitations of the computational method. For this particular example, it is possible the input data was inadequate or some other explanations apply. Perhaps the user did not select the proper options in the program. These words are not intended to judge the software itself, but rather the operator. Just because a computational method offers viscous approximation does not mean the method is bullet-proof.
Figure 23-26shows stall progression predictions by two Navier-Stokes solvers. The left wing half was meshed using a structured grid, and the right one using an unstructured grid. The image shows flow separation patterns at an AOA of 18°. The disparity in predicted pattern is clearly evident. How do you know which prediction better resembles reality? Neither? Obviously it is impossible to say without experiment; however, an aerodynamicist armed with only one solver has no choice but to rely on it – often erroneously. Be careful – your development program may be at stake.

FIGURE 23-26 Two dissimilar predictions of stall progression on a wing design. The left side was predicted using a structured mesh and the right using an unstructured mesh. The left and right sides are geometric mirror images. The left side ended up better resembling experiment and had favorable stall characteristics. AOA is 18°.
Always check the results of any computer analysis software by conducting validation tests. When dealing with aerodynamics design, validation is only acceptable when it consists of comparison to actual wind tunnel tests. When possible, select wind tunnel test results for geometry that most closely resembles the one being analyzed. If such wind tunnel test results cannot be found, select a different geometry as long as it is trustworthy. When dealing with structural tests, validation is only acceptable when compared to actual load tests. Do not compare one analysis method to another one, unless it is validated this way. Such comparison will build trust in software and expose the limitations of the methods. Only an understanding of the limitations of a particular computational method will lead to a proper use.
23.3.17 Weight Estimation Pitfalls
The most common pitfall in the estimation of weight is underestimation. This usually stems from the omission of systems whose weight is poorly defined, but sometimes simply from a human trait – optimism. This is a peculiar human condition that, if left unsupervised, can lead to trouble. Inevitably, an inexperienced designer asked to guess the weight of a component inside some weight range is likely to pick the lower end of the range if the component is destined for use in his own design. Thus, if a component is estimated to be within a weight range of, say, 80 to 120 lbf, the designer is likely to assume it will weigh 80–100 lbf in his aircraft. Of course, this is less of a problem among experienced designers, but a possible pitfall it is nevertheless. The remedy? Realism enforced by thorough checks by people other than the weights engineer.
23.3.18 Drag Estimation Pitfalls
There are two common pitfalls when estimating drag: over- and underestimation. Drag is notoriously hard to estimate correctly. Overestimation may make an otherwise promising idea appear as a slug on paper and lead to the termination of a project before it even begins. Underestimation can lead to a devastating disappointment once the airplane flies, if not program cancellation and possibly a financial catastrophe. It is often caused by significant protrusions being “left out” of the calculations during the conceptual design phase (for instance see Section 15.5.1, Cumulative result of undesirable drag (CRUD)). The remedy? Ensure the drag estimation is thoroughly checked, if not performed, by experienced people, although this does not always suffice. Estimate the drag of a number of airplanes that appear similar to the one being designed. If the drag estimate of the design deviates greatly from those this should raise a flag. While this discussion pertains to the state of the project before a wind tunnel model is even considered, it is possible the right answer won’t emerge until it has been conducted.
23.3.19 Center of Gravity Travel During Flight
Most airplanes experience a movement of the center of gravity (CG) during flight. This is most often caused by the fuel being consumed, but sometimes by mass being purposely dropped as a part of a mission; for instance a military aircraft dropping ordnance, or an aerial firefighter dropping water, or parachutists exiting. The designer should aggressively plot the CG travel as a function of such weight reduction and ensure that at no time will it travel beyond the prescribed CG limits. An airplane with a wide CG limit will be far more forgiving than one with a narrow one. This is discussed in more detail in Section 6.6.13, In-flight movement of the CG.
23.3.20 Wing/Fuselage Juncture Flow Separation
The juncture where the wing joins the fuselage can often bring a surprising increase in drag. It is one of those areas often left to flight testing to evaluate, but by then it might be too late and require expensive design changes. Established companies will spend resources on developing proper wing root fairings; however, the less established ones will often wait until flight tests to assess the severity of the flow separation in the juncture. The initial geometry of the fairing can be designed keeping some straightforward rules of thumb in mind, although ultimately a Navier-Stokes solver or wind tunnel testing is required to complete the shape, as the flow field in this region is simply too complicated to assess by other means.
23.4 Faults and Fixes
While aircraft design is clearly more Science than Art, the combination of the two sometimes plays a profound role in the final product. This can be seen in many decisions that are made during the design process that are biased by contributing influences that range from what is perceived to constitute good looks to improved ergonomics of operation. As a consequence, once operational, the complete geometry often displays characteristics that are undesirable. Usually, such undesirables are not severe enough to terminate the design project, but nevertheless require aerodynamic fixes that help eliminate the undesirable characteristic. This section will address common faults and fixes for various detrimental characteristics and is intended to help the practicing engineer find solutions to possible challenges.
Naturally, some flaws that lead to detrimental characteristics have nothing to do with the interplay of art and science, but are rather a direct consequence of the nature of air, which separates at high AOAs or forms shockwaves when airspeeds are high. We have already seen that some airplanes are designed to operate over a wide range of airspeeds, from mid 100 knots to a couple of times the speed of sound. Such airplanes are presented with serious design challenges that call for the introduction of complex geometry to allows them to operate safely and effectively at either end of the airspeed spectrum. Other aircraft are larger and heavier derivatives of previous aircraft and in order to keep manufacturing costs down use the same external parts (e.g. vertical or horizontal tail). This may lead to the discovery of undesirable flight or handling characteristics at some speed or altitude, which are fixed with the addition of some external geometry.
23.4.1 Stability and Control – Dorsal Fin and Rudder Locking
As stated in Section 11.2.11, The dorsal fin, the primary reason for the installation of a dorsal fin is to prevent rudder locking, a phenomenon that may occur if the yaw angle of the aircraft becomes too great. The phenomenon is discussed in great detail in the section.
23.4.2 Stability and Control – Ventral Fin and Deep Stall
As stated in Section 11.2.12, The ventral fin, there are two kinds of ventral fins: for deep stall or for Dutch roll. The T-tail configuration of the Lockheed F-104 Starfighter was intended to increase its effectiveness through an endplate effect (Whitford [6]) but other airplanes feature T-tails for other reasons, for instance aesthetics. Some of those require a ventral fin to fix a deep stall tendency as a consequence of the design decision. Reynolds [7] presents a good discussion of the development of ventral fins on the Learjet 55. Figure 23-27 shows the ventral fins on a Learjet 60.

23.4.3 Stability and Control – Ventral Fin and Dutch Roll
A ventral fin can also be introduced to increase the vertical or side silhouette of an airplane for the purpose of improving its Dutch roll damping or increase the directional stability of a multiengine aircraft when operating with one engine inoperative (OEI). Ventral fins intended for this purpose are installed in a far more vertical position than those intended to fix deep stall.
23.4.4 Stability and Control – Forebody Strakes
As was discussed in Section 23.3, Preliminary aircraft design checklist, conventional sizing of the vertical tail is contingent upon critical asymmetric flight conditions: cross-wind landings, balked landing, one-engine-inoperative trim capability, and many others. The resulting fin size can be large and increases both drag and airframe weight. The large tail can, therefore, be costly for transport aircraft in terms of fuel costs. Consequently, alternative methods that do not increase drag are attractive and of great interest to the aircraft designer. Additional benefits of such methods are realized when time comes to “stretching” or lengthening the fuselage of an existing design in order to develop a variant aircraft that can carry more passengers or payload. Such changes are frequent in the commercial aircraft industry. Extending the fuselage will destabilize the aircraft, longitudinally and directionally, and can easily call for enlarged stabilizing surfaces.
Research on forebody strakes has been active for a long time. One of the best-known efforts was run by NASA’s Dryden Flight Research Center, Edwards, CA, in which an originally retired F-18 Hornet fighter was restored and equipped as a high angle-of-attack research vehicle (HARV) in a flight research program lasting from April 1987 until September 1996 [8]. The program focused on AOA well above 30° and identified the shape of the nose as a key player in the lateral stability of the test vehicle at high AOAs [9]. The resulting cross-flow on the forebody is considerable and the resulting asymmetry in pressure on the nose can cause a significant side force. This force acts across a large distance between the forebody and the CG, creating a large yawing moment. The effort successfully demonstrated that directional control could be exerted using deployable strakes installed in the nose. This research led to a cooperation between NASA Langley Research Center and McDonnell Douglas Corporation (now Boeing) to develop strake technology for use with transport aircraft. Of course, such aircraft operate at much lower AOAs, something closer to 8° during approach for landing, so a different kind of strake had to be developed.
Shah and Granda [10] studied the use of forebody strakes to improve the directional stability of a wind tunnel model of a generic commercial jetliner. This was done as part of a cooperative research between NASA and Boeing referred to as Strake Technology Research Application to Transport Aircraft (STRATA). The strake is a flat plate that is mounted on the forward part of the fuselage, of which an example can be seen in Figure 23-28 and Figure 23-29. These were mounted to the 50-series of the McDonnell-Douglas DC-9 when it was stretched from the 30-series aircraft. These were also installed on the DC-9-80, also known as the MD-80. Their findings can be summarized as follows:
1. A set of baseline strakes similar in planform and location to those on the MD-80 aircraft improved the model’s static directional stability. As AOA increased, the AOY at which the strakes became effective decreased. This indicates that a critical level of fuselage cross-flow is required for the strakes to become effective.
2. It was found that it is the leeward strake that alters the flow-field and improves stability; the windward strake has negligible effect.
3. The improvement in directional stability is approximately proportional to the span of the strake.
4. The effect of strake chord on stability is non-linear; most of the effectiveness above stall can be achieved with a strake with a small chord.
5. A nose-up incidence of the strake has minimal effect on longitudinal stability; negative incidence has a non-linear and degrading effect.
6. The effectiveness of single or differentially deflected strakes as a directional control device was small and very nonlinear; however, only a limited investigation was conducted in this area.
7. The forebody strakes are de-coupled control effectors – very little impact on static longitudinal and lateral characteristics was seen.
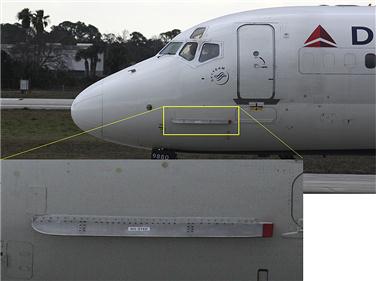
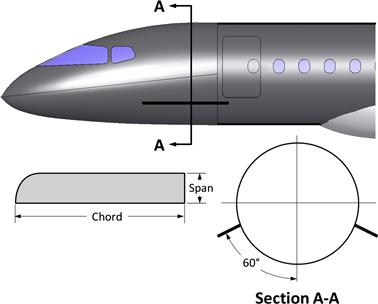
23.4.5 Stability and Control – Taillets and Stabilons
Taillets and stabilons are terms coined for the modification made to the twin-engine Beech 1900 commuter aircraft (see Figure 23-30). The design dates back to the late 1970s and early 1980s, developed from the Beech Super King Air to compete with the Swearingen Metro and the British Aerospace Jetstream. It accommodates 19 passengers in a pressurized cabin and is powered by two 1100 SHP Pratt & Whitney PT6 turboprops driving four-blade propellers, capable of 235 KTAS at 25,000 ft. The Beech 1900D is a variant of the 1900 with an enlarged fuselage that offers a stand-up cabin. This was accomplished without changing the dimensions of the original tail.

FIGURE 23-30 This is what happens when an existing airframe is adapted to modified requirements. A Beech 1900 commuter boasts an assortment of aerodynamic fixes: taillets (small vertical surfaces on each stabilizer), ventral fins (bottom of fuselage), and stabilons (above the lower ventral fins). (Photo by Phil Rademacher)
The increase in drag required more powerful engines, which, combined with the reduction in directional stability due to the larger fuselage, called for the addition of ventral fins and taillets. Each taillet adds about 1.67 ft² of area to the total vertical stabilizing area and improves Dutch roll damping. This prevents the airplane’s yaw damper from being a non-dispatch critical component [11].
The stabilon refers to a couple of 7.75 ft² horizontal ventral fins that are mounted to the lower aft part of the fuselage (again see Figure 23-30). These increase longitudinal stability and allow the center of gravity to be farther aft than otherwise, making the airplane less sensitive to passenger and baggage loading. According to the source [11] (which cites Beech sources) the stabilons increase the aft CG limit from 32% MGC to 40%. They also improve “deep” stall characteristics (see discussion in Section 11.2.12, The ventral fin).
23.4.6 Stability and Control – Control Horns
Control horns are extensions that are placed on control surfaces, such as ailerons, elevators, and rudders, for reducing aerodynamic hinge moments. This is accomplished by adding area of the surface ahead of the hingeline. Control horns come in many sizes and shapes. There are two common types: unshielded and shielded. Shielded control horns are recommended for airplanes that are certified to fly into known icing (FIKI – flying into known icing) as they do not accrete ice like control horns that are more directly exposed to the elements.
23.4.7 Stall Handling – Stall Strips
A stall strip is a small triangular strip made out of metal or rubber that is bonded to the leading edge of a wing to help control the stall characteristics of an airplane (see Figure 23-31). The strip can be seen on the leading edges of most manufactured aircraft, as they must comply with regulations such as 14 CFR Part 23.201, Wings level stall.
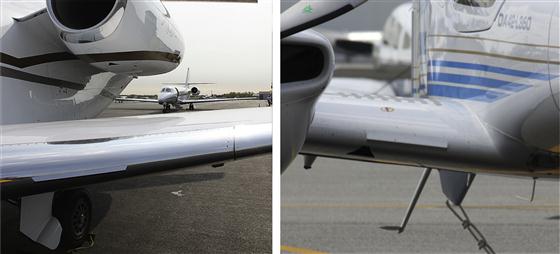
FIGURE 23-31 Stall strips on a Cessna Citation X and Diamond DA-42 Twinstar aircraft. (Photo by Phil Rademacher)
The difficulty in maintaining production tolerances effectively renders all serial numbers of a given aircraft type similar and not precisely the same. Yes, all Cessna 172 aircraft look so similar to the untrained eye that they may appear identical. However, in fact, when compared to the intended outside mold line (OML) they all deviate in one way or another, albeit in minute ways. The same holds for all other mass-produced aircraft. For this reason, when airplanes come off the production line, they are test flown before delivery by the production flight test team and stalled to confirm stall behavior. Then, based on the observation of the test pilot, stall strips are bonded in a specific location on the leading edge.
Stall strips are detrimental in that they may cause an early separation even at climb AOA. This will be manifested as a reduction in climb performance. They can also be detrimental on NLF wings as they may destabilize the boundary layer aft of their location, causing an earlier transition than otherwise.
There are primarily two positions the aerodynamicist needs to be aware of and are important to a properly located stall strip. spanwise station and clocking (see Figure 23-32). During the development phase of a new aircraft, the location of stall strips on the wing becomes a process of trial and error. The experienced aerodynamicist will create a test matrix with potential locations and clocking positions and have the test pilot stall the aircraft and note change using terms like “good,” “bad,” “improved,” or similar. The essential task is to use information from each stall to its utmost as each flight is costly. Using CFD may help, provided there is evidence to support it correctly predicts flow separation. Such evidence should comprise pictures of the flow field and separation area as seen using a tufted wing and subsequent comparison to CFD predictions. In the absence of such evidence, CFD should be used with care great or not at all – incorrect predictions may simply muddy the waters.
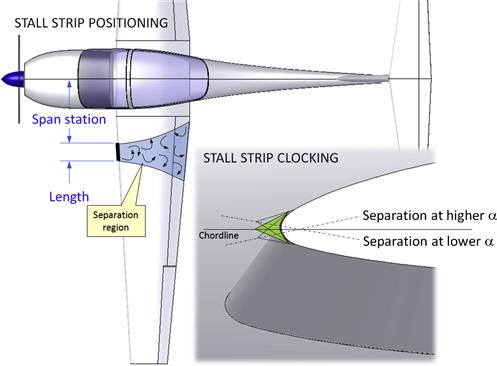
23.4.8 Stall Handling – Wing Fence
A fence is a vertical panel mounted to the upper surface of swept-back wings (see Figure 23-33). The invention is attributed to research from 1937 by the German aerodynamicist Wolfgang Liebe at the Deutsche Versuchsanstalt für Luftfahrt [12, p. 224] (or the DVL – The German Aeronautical Test Establishment). This work was carried out in order to help remedy dangerous wing roll-offs during stall of aircraft such as the Heinkel He 70 and Messerschmitt Me 109.

Early versions of the fence extended from the leading to the trailing edge, while the more modern configuration extends a relatively short distance back. The wing fence is a less common solution today than before and is mostly found on some business jets (e.g. Cessna Citation III, Beechcraft 400 Beechjet, Learjet 35, and Gulfstream II). Earlier commercial types featuring wing fences include the Boeing 727 (see Figure 23-33), Comet 1, Sud-Est Caravelle, and Tupolev Tu-154, to name a few. Wing fences can also be found on many fighter aircraft, such as the MiG-15, North American F-86 Sabre, and even relatively recent aircraft such as the Hawker Hawk (US designation T-45 Goshawk), Fiat G91 and SIAI-Marchetti S211. It can even be found on GA aircraft such as the German Akaflieg Braunschweig SB-13 sailplane and the Australian Eagle 150 tandem wing aircraft.
Fences are sometimes referred to as “boundary-layer fences.” However, a fence can serve in a number of important ways:
(1) It modifies the distribution of section lift coefficients, delaying wingtip stall. This can be seen as the reduction in the magnitude of the distribution of section lift coefficients in Figure 23-34.
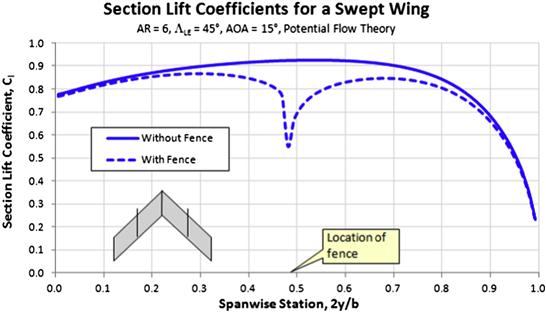
FIGURE 23-34 While the effect of the wing fence is highly viscous, it also affects the flow field in a manner that can be approximated using inviscid potential flow theory. Here, the reduction in section lift coefficients mid-span and outboard is clearly visible, helping to delay tip stall.
(2) The fence blocks the outboard spanwise flow of the low-energy boundary layer and reduces the possibility of wingtip stall on swept wings.
(3) The spanwise flow effectively places the fence at a small AOA, forming a vortex on its outboard side. When the AOA of the wing is low, a single vortex is formed on the outboard side. However, at higher AOAs this develops into a complex two-core vortex with opposite rotation [12, p. 107]. The fence is thus a type of leading edge discontinuity that segments the wing into two lower AR parts whose stall AOAs are higher.
23.4.9 Stall Handling – Wing Pylons
Jet engine pylons on the wing have been shown to improve the stall characteristics of jet aircraft. Abzug and Larrabee [1, p. 174] explain it by pointing out that the bound vortex on the wing induces side-wash on the engine pylon, as shown in Figure 23-35. Consequently, an outboard side force is generated on the nacelle and pylon. The pylon generates a vortex on the upper surface of the wing, whose flow direction can be seen to oppose the outboard spanwise flow. This suppresses early wingtip flow separation.
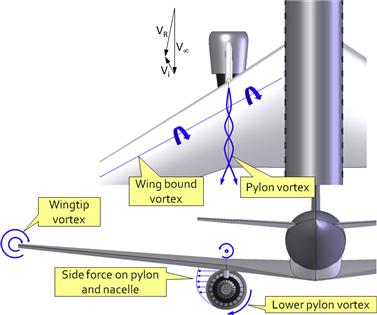
FIGURE 23-35 The bound vortex on the wing induces side-wash on the engine pylon. This forms a vortex on the upper surface of the wing that opposes the wingtip vortex and, thus, causes the normal outflow of air in the spanwise direction. This, in turn creates a vortex on the upper surface whose effect suppresses early wingtip flow separation (Based on Ref. [1]).
It is alleged in Ref. [1] that the effect was discovered by Boeing, most likely when developing the B-47 Stratojet in the late 1940s. Both the Boeing 707 and B-52 Stratofortress feature two pylons per wing and neither had wing fences, so common on swept-wing aircraft of the era. This spurred the development of another aerodynamic fix – a small “pylon” without the nacelle. The device was conceived by Douglas Aircraft aerodynamicists and was mounted to the DC-9, whose engines are mounted at the back of the fuselage. The device was patented under the name vortilon. It was developed as a part of a three-part solution to a possible deep-stall scenario on the DC-9 [13] and mounted relatively inboard, where the vortex it generated at high AOAs favorably improved flow over the horizontal tail. The other two were an enlarged horizontal tail and hydraulically boosted nose pitch-down control.
23.4.10 Stall Handling – Vortilons
As explained above, a vortilon is a small pylon-shaped fence mounted to the lower surface of a wing, usually a swept-back wing. It can be mounted alone (as it is on the inboard wing of the DC-9 commercial jetliner) or in a row (as it is on the outboard wing of the ERJ-145, as shown in Figure 23-36). Its purpose is to shed a vortex at high AOAs that aerodynamically partitions the wing into several low-AR segments, reducing section lift coefficients and delaying stall (see Figure 23-37). It is not as effective as the fence, but adds less drag to the airplane [7].
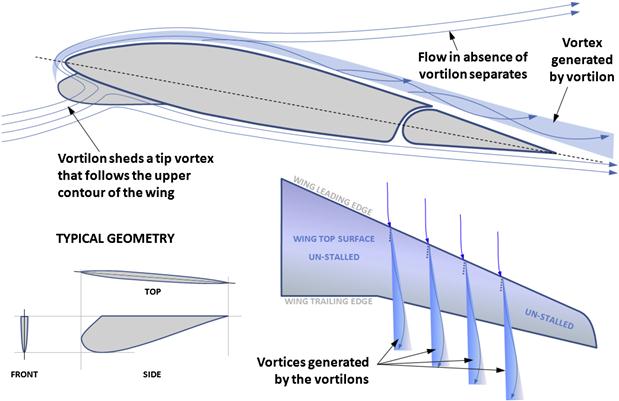
FIGURE 23-37 The vortilon in action (Based on Ref. [7]).
23.4.11 Stall Handling – Wing Droop (Cuffs, Leading Edge Droop)
The term wing droop (also called a cuff or a leading edge droop) is used to describe the enlarging of wing airfoils in the outboard wing region (see Figure 23-38). The cuff presents a discontinuity to the leading edge of the wing. This means that as the AOA increases, the wing is effectively partitioned into two smaller segments. This can be seen in the vortex that begins to form at the discontinuity. The wing partioning results in a reduced AR of the outboard (and inboard) segments, not unlike the one obtained using the wing fence. As we have seen before, a reduction in the AR of a lifting surface means a more shallow lift curve slope and delay of the stall to a higher AOA. Consequently, the cuff provides improved roll stability at stall.
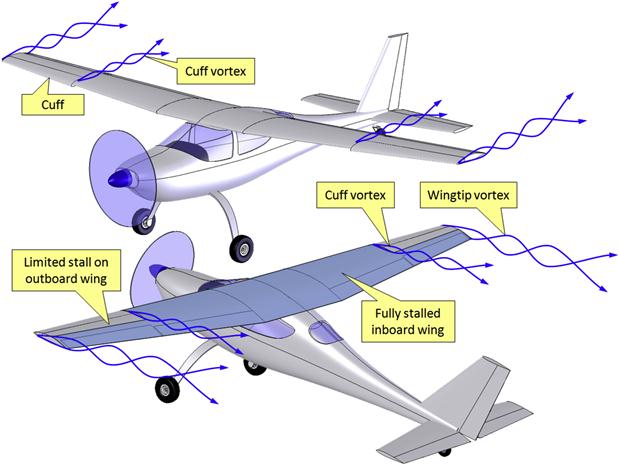
FIGURE 23-38 The workings of the leading edge extention (cuff). It partitions the higher-AR wing into three segments. The outboard segments, effectively, are low-AR wings that stall at a higher AOA. This helps the aircraft retain roll stability.
In 1982, NASA conducted an investigation on the effectiveness of leading edge devices for stall departure and spin resistance on the Piper PA-32 Lance with a T-tail [14]. The investigation revealed that the partial span leading edges eliminated the abrupt stall tendency of the 1/6th scale wind tunnel model and a tendency for autorotation, improving spin resistance. While some of the results are dependent on the geometry of the airplane and Reynolds number, they are still important indicators of the potential benefits of cuffs. Among results were:
(1) The inboard wing of the model stalled at an AOA of 12°, whereas the tip with the wing droop stalled at 32°, improving roll stability and providing spin resistance.
(2) A wing droop starting at span station 0.55 to 0.60 was found to provide the most favorable outboard aerodynamics.
(3) Partitioning of the wing into a lower-AR wing, evident from item (1), lowers the section lift coefficients as the lift curve slope becomes shallower and stalls at a higher AOA.
(4) The wing chord extension means that the lift is generated along a longer chord and this brings down the peak Cp and delays flow separation.
(5) The airfoil of the LEX is modified as well and with the combination of a larger LE radius and camber, Clmax is pushed up as well.
The most serious drawback of wing droops is that they may make spin recovery harder. The feature that improves roll stability at stall – higher lift at the wingtip – is also larger during spin, requiring greater moment to stop. Among other drawbacks is higher drag and added manufacturing complexity. Cuffs for composite aircraft are typically manufactured by two means: as an integrated structure or as an add-on. Integrating the cuff into the wing skin is desirable, as it reduces part count and weight. However, the quality of the laminate layup may suffer due to fiber dryness often associated with sharp corners.
23.4.12 Flow Improvement – Vortex Generators
Strictly speaking, a vortex generator (also known as a VG) is any device that starts and maintains vortex motion in fluid flow. However, generally, the term applies to devices that generate localized vortices on lifting surfaces to improve the airflow over them. There are typically two reasons for their installation; to alleviate buffeting and loss of control effectiveness due to shock interaction at transonic airspeeds [15] or to suppress flow separation at high AOAs at low subsonic airspeeds. The latter will be the focus here. Figure 23-39 shows a common application of VGs: on the lower surface of the HT where it increases the effectiveness of the elevator by delaying separation at high deflection angles and low dynamic pressures.

FIGURE 23-39 A row of vortex generators on the lower HT surface of the Aero L-39 Albatros trainer aircraft delays flow separation on the elevator at low speeds and large deflection (i.e. during flare), improving elevator authority. (Photo by Phil Rademacher)
There is a large amount of information available on VGs in technical journals, like NACA, NASA, AIAA, ESDU, and others, so only basic information will be given here. A good insight is given by Wentz and Seetharam [16], who investigated the effect of VGs on a GA(W)-1 airfoil. They found the VGs to be very effective in suppressing flow separation. The VGs increased the Clα and Clmax, but lowered the αstall. There was a substantial increase in the section drag coefficient, of about 25 drag counts. However, the drag at higher AOAs was lower due to the delay in separation, although the cross-over point was at a CL of about 1.1. Guidelines for the sizing of VGs are given below and are obtained from various sources, including Refs 15, 16 and 17.
| Height: | 1 to 2 times the boundary layer thickness at their position |
| Aspect ratio: | 0.25 to 1.00 (AR = height/chord) |
| Taper ratio: | 0.6 to 0.8 (recommended to help “load up” the VG and make it more effective) |
| Angle-of-incidence: | 10° to 20° |
| Spacing: | 5 to 10 times the height |
| Chordwise location: | approximately 20 boundary layer thicknesses ahead of the separation point |
| Orientation: | for unswept wing use counter-rotating VGs (possibly even in pairs). For swept wings use co-rotating VGs. |
Very small VGs, called micro-VGs, are used in applications where size, or lack thereof, is of importance; for instance to improve flow over control surfaces and flaps. An example is shown in Figure 23-40. Their purpose is to delay flow separation over a specific control surface. In the case of flaps, they have the potential to increase CLmax while having no impact on cruise drag, as they are only exposed to the airflow when the flap is deployed. It is a drawback that they may cause an interference with the free motion and stowage of the flap. Refer to Lin [18] for recommendations regarding sizing, spacing, and location.

23.4.13 Trailing Edge Tabs for Multi-Element Airfoils
Ross et al. [19,20] investigated the installation of a special lift-enhancing tab (or a cove-tab), similar to a Gurney flap on the pressure side of a two-element airfoil (NACA 632–215) with 30% chord single-slotted flap and on a multi-element airfoil. The idea has been patented under US Patent 5,249,080.
A cove-tab with typical dimensions is shown in Figure 23-41. The research indicates the tab must be sized and located based on the geometry of the flap and cove. For this reason, the dimensions shown in the figure do not necessarily hold for all applications. The tab also presents an issue during flap retraction and deployment and may, therefore, have to be mechanically actuated, potentially adding complexity to the installation. It is an advantage that the cove-tab is passive – in other words, it does not require a separate power source to function, like for instance a jet-flap.

The installation and wind tunnel testing of the cove-tab on the two-element airfoil was the focus of Ref. [19]. It was found that it increased the maximum lift coefficient by 10.3% with the flap deflected at 42°, attributed to a reduction in flow separation on the upper surface of the flap. The tab was found to be less effective (even detrimental) for lower deflections. However, a combination of a cove-tab with a Gurney flap and vortex generators on the flap increased the maximum lift at a high flap deflection by 17% over the optimum flap position of the baseline.
Reference [20] investigated various flow mechanics of the cove-tab installation using a Navier-Stokes solver. Among notable conclusions is that as the flap element is moved away from its optimum position the flow separation increases (which explains the reduction in lift). Such a movement can be the consequence of tolerance stack-up or, simply, incorrect positioning during design. Adding the cove-tap will reduce the separation and restore the flap lift to within 1% of the optimum flap lift. This way, it can serve as a “fix” for incorrectly positioned flaps.
The investigation revealed the tab is detrimental to the lift at low flap deflection (T-O configuration) as it appears to reduce the suction peak on the leading edge of the flap. However, at large flap deflections (landing configuration) it delayed flow separation on the flap, greatly improving its capability.
23.4.14 Flow Improvement – Nacelle Strakes
Nacelle strakes are vortex generators commonly found on the engines of modern jet transport aircraft, civilian and military. At high AOAs the strake generates a powerful vortex that makes up for the flow separation and loss of lift due to the presence of the nacelle. The strake typically has a LE sweep of approximately 70° and it is aligned with the airstream at cruise to minimize its interference drag. It can improve the maximum lift coefficient by as much as 0.05–0.1. An example of a nacelle strake on an Airbus A319 commercial jetliner is shown in Figure 23-42.
23.4.15 Flow Improvement – Bubble-Drag, Turbulators, and Transition Ramps
The wings of small radio-controlled aircraft and sailplanes that operate at very low Reynolds numbers (60,000 < Re < 500,000) are often subject to the formation of a laminar boundary layer separation bubble along the leading edge. An example of such a separation bubble is shown in Figure 8-18. Such bubbles can be very detrimental to the flight characteristics of the corresponding aircraft, detrimentally affecting the lift and drag (forming so-called bubble-drag). They can even lead to unpredictable and sudden changes in the magnitude of these forces. Generally, two methods can be used to reduce the bubble-drag: (1) turbulators and (2) tailoring of the transition curve.
Turbulators (also called trip strips or boundary layer trips) are often installed near the leading edge of such aircraft. They are intended to force the laminar boundary layer to transition immediately to a turbulent one to prevent the formation of or reduce the size of the more detrimental separation bubble. The presence of a turbulator has important effects on the lift and drag of the airfoil. It is difficult to accurately predict its influence, calling for trial-and-error approaches in wind tunnel or flight tests. This is further compounded by the fact that a trip strip configuration found suitable for a specific airfoil at a given AOA may be detrimental to it at another operating condition [21].
Tailoring the transition curve refers to the proactive design of airfoils to encourage a more rapid movement of the laminar-to-turbulent BL transition point on the upper surface toward the leading edge. This is shown in Figure 23-43, which depicts how the derivative ![]() is steeper for airfoil A than B. This is referred to as the shape of the transition ramp. In other words, in the lift coefficient range 0 < Cl < 1.0, the transition point, Xtr/C for airfoil A “moves faster” toward the LE than airfoil B. Gopalarathnam et al. [21] show that this results in a lower bubble-drag for airfoil A. This observation makes it possible to design airfoils for operation in low Reynolds number flow that are less likely to suffer this undesirable type of pressure drag.
is steeper for airfoil A than B. This is referred to as the shape of the transition ramp. In other words, in the lift coefficient range 0 < Cl < 1.0, the transition point, Xtr/C for airfoil A “moves faster” toward the LE than airfoil B. Gopalarathnam et al. [21] show that this results in a lower bubble-drag for airfoil A. This observation makes it possible to design airfoils for operation in low Reynolds number flow that are less likely to suffer this undesirable type of pressure drag.
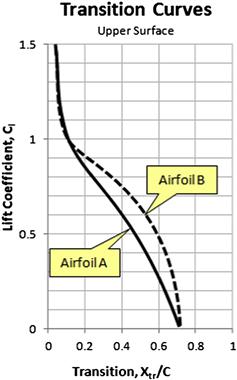
FIGURE 23-43 The shape of the transition curve on the upper surface is a good indicator of a tendency for bubble-drag formation (Based on Ref. [21]).
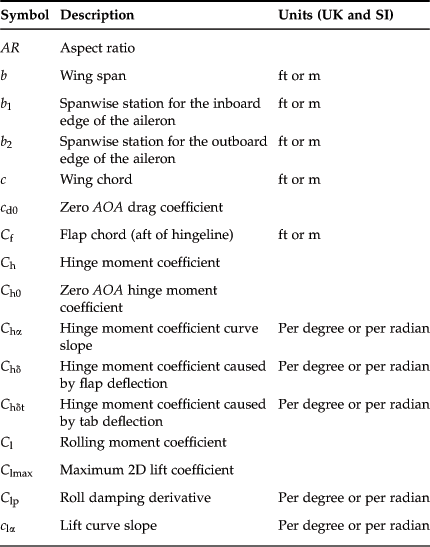

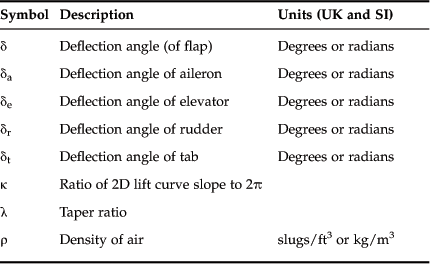
References
1. Abzug MJ, Larrabee EE. Airplane Stability and Control – A History of the Technologies that Made Aviation Possible. 2nd ed Cambridge Aerospace Series 2002.
2. NACA TN-547. Development of the N.A.C.A Slot-Lip Aileron. Weick, Fred E., and Joseph A. Shortal 1935.
3. NACA R-602. Wind Tunnel and Flight Test of Slot-Lip Ailerons. Shortal, Joseph A 1937.
4. Perkins CD, Hage RE. Airplane Performance, Stability, and Control. John Wiley & Sons 1949.
5. NACA-TR-824. Summary of Airfoil Data. Abbott, Ira H., Albert E. von Doenhoff and Louis S. Stivers Jr. 1945.
6. Whitford R. Design for Air Combat. Jane’s Publishing Company Limited 1987.
7. Reynolds P. Ten Years of Stall Testing. AIAA-1990-1268 1990.
8. In: http://www.nasa.gov/centers/dryden/news/FactSheets/FS-002-DFRC.html.
9. NASA-TM-112360. Overview of HATP Experimental Aerodynamics Data for the Baseline F/A-18 Configuration. Hall, Robert M., et al 1996.
10. Shah GH, Nijel Granda J. Application of Forebody Strakes for Directional Stability and Control of Transport Aircraft. AIAA-98–4448 1998.
11. Flight International. November 20th, 1982.
12. Meier Hans-Ulrich. German Development of the Swept Wing 1935-1945. AIAA 2006.
13. Anonymous. The DC-9 and the Deep Stall. Flight International March 25th, 1965.
14. NASA CR-3636. Wind-Tunnel Investigation of Effects of Wing-Leading-Edge Modifications on the High Angle-of-Attack Characteristics of a T-tail Low-Wing General-Aviation Aircraft. White, E. R. 1982.
15. Edwards JBW. Free-Flight Tests of Vortex Generator Configurations at Transonic Speeds. C.P. No. 729, British A. R. C. 1966.
16. NASA CR-2443. Development of a Fowler Flap System for a High Performance General Aviation Airfoil. Wentz, W. H., Jr., and H. C. Seetharam 1974.
17. Tanner LH, Pearcey HH, Tracy CM. Vortex Generators, Their Design and Their Effects on Turbulent Boundary-Layers. A.R.C. 16.487 January, 1954.
18. Lin JC. Control of Turbulent Boundary-Layer Separation Using Micro-Vortex Generators. AIAA 99–3404 1999.
19. Ross JC, Storms BL. An Experimental Study of Lift-Enhancing Tabs on a Two-Element Airfoil. AIAA-1994-1868 1994.
20. Ross JC, Carrannanto PG, Stroms BL, Cummings RM. Navier-Stokes Anaysis of Lift-Enhancing Tabs on Multi-Element Airfoils. AIAA-1994-50 1994.
21. Gopalarathnam A, et al. Design of Low Reynolds Number Airfoils with Trips. Journal of Aircraft. July-August 2003;40.
1Generated with the vortex-lattice code SURFACES.
2Generated with the vortex-lattice code SURFACES.
3Among well-known aircraft whose design he contributed to are the Bristol Fighter (1916), Bristol Bulldog (1927), Bristol Beaufighter (1941), and the Hunting Percival Jet Provost.
4Poorly designed here mean that it results in excessive stretching.
5This means constant heading and altitude.
6Per 14 CFR, Part 23.