
Before we advance to the event system introduced in Java EE 6, let's take a look at the logging services provided by Oracle WebLogic Server.
By default, WebLogic Server creates two log files for each managed server:
access.log: This is a standard HTTP access log, where requests to web resources of a specific server instance are registered with details such as HTTP return code, the resource path, response time, among others<ServerName.log>: This contains the log messages generated by the WebLogic services and deployed applications of that specific server instance
These files are generated in a default directory structure that follows the pattern $DOMAIN_NAME/servers/<SERVER_NAME>/logs/.
If you are running a WebLogic domain that spawns over more than one machine, you will find another log file named <DomainName>.log in the machine where the administration server is running. This file aggregates messages from all managed servers of that specific domain, creating a single point of observation for the whole domain.
Note
As a best practice, only messages with a higher level should be transferred to the domain log, avoiding overhead to access this file. Keep in mind that the messages written to the domain log are also found at the managed server's specific log file that generated them, so there's no need to redirect everything to the domain log.
Here's a typical entry of a log file:
####<Jul 15, 2013 8:32:54 PM BRT> <Alert> <WebLogicServer> <sandbox-lap> <AdminServer> <[ACTIVE] ExecuteThread: '0' for queue: 'weblogic.kernel.Default (self-tuning)'> <weblogic> <> <> <1373931174624> <BEA-000396> <Server shutdown has been requested by weblogic.>
The description of each field is given in the following table:
|
Text |
Description |
|---|---|
|
|
Fixed, every log message starts with this sequence |
|
|
Locale-formatted timestamp |
|
|
Message severity |
|
|
WebLogic subsystem—other examples are WorkManager, Security, EJB, and Management |
|
|
Physical machine name |
|
|
WebLogic Server name |
|
|
Thread ID |
|
|
User ID |
|
|
Transaction ID, or empty if not in a transaction context |
|
|
Diagnostic context ID, or empty if not applicable; it is used by the Diagnostics Framework to correlate messages of a specific request |
|
|
Raw time in milliseconds |
|
|
Message ID |
|
|
Description of the event |
The logging solution we've just created is currently using the Java SE logging engine—we can see our messages on the console's screen, but they aren't being written to any log file managed by WebLogic Server. It is this way because of the default configuration of Java SE, as we can see from the following snippet, taken from the logging.properties file used to run the server:
# "handlers" specifies a comma separated list of log Handler
# classes. These handlers will be installed during VM startup.
# Note that these classes must be on the system classpath.
# By default we only configure a ConsoleHandler, which will only
# show messages at the INFO and above levels.
handlers= java.util.logging.ConsoleHandler
So, as stated here, the default output destination used by Java SE is the console. There are a few ways to change this aspect:
- If you're using this Java SE installation solely to run WebLogic Server instances, you may go ahead and change this file, adding a specific WebLogic handler to the
handlersline as follows:handlers= java.util.logging.ConsoleHandler,weblogic.logging.ServerLoggingHandler
- Tampering with Java SE files is not an option (it may be shared among other software, for instance); you can duplicate the default
logging.propertiesfile into another folder$DOMAIN_HOMEbeing a suitable candidate, add the new handler, and instruct WebLogic to use this file at startup by adding this argument to the following command line:-Djava.util.logging.config.file=$DOMAIN_HOME/logging.properties
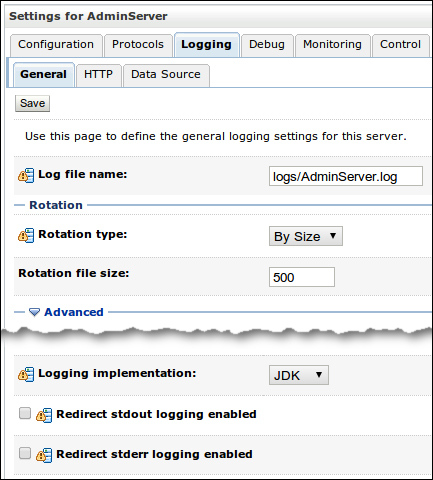
- You can use the administration console to set the redirection of the standard output (and error) to the log files. To do so, perform the following steps:
- In the left-hand side panel, expand Environment and select Servers.
- In the Servers table, click on the name of the server instance you want to configure.
- Select Logging and then General.
- Find the Advanced section, expand it, and tick the Redirect stdout logging enabled checkbox:
- Click on Save to apply your changes.
If necessary, the console will show a message stating that the server must be restarted to acquire the new configuration.
Tip
If you get no warnings asking to restart the server, then the configuration is already in use. This means that both WebLogic subsystems and any application deployed to that server is automatically using the new values, which is a very powerful feature for troubleshooting applications without intrusive actions such as modifying the application itself—just change the log level to start capturing more detailed messages!
Notice that there are a lot of other logging parameters that can be configured, and three of them are worth mentioning here:
- The Rotation group (found in the inner General tab): The rotation feature instructs WebLogic to create new log files based on the rules set on this group of parameters. It can be set to check for a size limit or create new files from time to time. By doing so, the server creates smaller files that we can easily handle. We can also limit the number of files retained in the machine to reduce the disk usage.
Tip
If the partition where the log files are being written to reaches 100 percent of utilization, WebLogic Server will start behaving erratically. Always remember to check the disk usage; if possible, set up a monitoring solution such as Nagios to keep track of this and alert you when a critical level is reached.
- Minimum severity to log (also in the inner General tab): This entry sets the lower severity that should be logged by all destinations. This means that even if you set the domain level to
debug, the messages will be actually written to the domain log only if this parameter is set to the same or lower level. It will work as a gatekeeper to avoid an overload of messages being sent to the loggers. - HTTP access log enabled (found in the inner HTTP tab): When WebLogic Server is configured in a clustered environment, usually a load-balancing solution is set up to distribute requests between the WebLogic managed servers; the most common options are Oracle HTTP Server (OHS) or Apache Web Server. Both are standard web servers, and as such, they already register the requests sent to WebLogic in their own access logs. If this is the case, disable the WebLogic HTTP access log generation, saving processing power and I/O requests to more important tasks.
If you already have an application that uses Log4J and want it to write messages to WebLogic's log files, you must add a new weblogic.logging.log4j.ServerLoggingAppender appender to your lo4j.properties configuration file.
This class works like a bridge between Log4J and WebLogic's logging framework, allowing the messages captured by the appender to be written to the server log files.
As WebLogic doesn't package a Log4J implementation, you must add its JAR to the domain by copying it to $DOMAIN_HOME/tickets/lib, along with another file, wllog4j.jar, which contains the WebLogic appender. This file can be found inside $MW_HOME/wlserver/server/lib. Restart the server, and it's done!
Remember that having a file inside $MW_HOME/wlserver/server/lib doesn't mean that the file is being loaded by the server when it starts up; it is just a central place to hold the libraries. To be loaded by a server, a library must be added to the classpath parameter of that server, or you can add it to the domain-wide lib folder, which guarantees that it will be available to all nodes of the domain on a specific machine.
If you have direct access to the server files, you can open and search them using a command-line tool such as tail or less, or even use a graphical viewer such as Notepad. But when you don't have direct access to them, you may use WebLogic's administration console to read their content by following the steps given here:
- In the left-hand side pane of the administration console, expand Diagnostics and select Log Files.
- In the Log Files table, select the option button next to the name of the log you want to check and click on View:
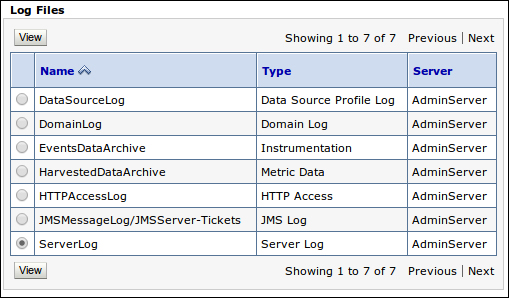
- The page displays the latest contents of the log file; the default setting shows up to 500 messages in reverse chronological order. The messages at the top of the window are the most recent messages that the server has generated.