CHAPTER 3
Global Trade
________________
Advancements in Global Shipping
As consumers in today's global economy, we cannot help but compete with others from around the world when we wish to travel or purchase a good. The ease with which goods (and people) can be transported overseas means that we are all competing to maintain our relative purchasing power at a global level. You may find it difficult to buy the house of your dreams if purchasers from other regions have benefited from higher levels of wealth creation and are able to bid up prices beyond your ability to pay. Whether you realize it or not, you live in a global economy. The same is true for operating a business. Unless government regulations prevent new entrants from entering your market, a bigger, stronger foreign business can come along and threaten your company's existence. The more profitable your business is and the easier it is to enter your market, the greater the threat from potential competitors, especially if the competitor benefits from a lower cost structure.
As the global economy has grown, the trade in goods and services between countries has expanded immensely. Siegel notes that “[f]rom the 1950s to the latest global economic crisis, the growth rate of international trade was almost consistently twice that of economic activity as a whole.”1 Most of the goods traded internationally are transported around the world via a combination of truck, rail, air freight, and marine shipping containers. On average, nearly one-quarter of all trade worldwide is between countries sharing a common border. This form of trade can primarily be conducted using road and rail transportation. For most global trade, however, transporting goods by ship or air is needed to get items where they need to go. The introduction of increasingly larger and faster cargo ships, as well as the expansion of air freight capacity, has caused the transportation of goods to become faster and less expensive. In the 1700s, it took an average of about seven weeks to cross the Atlantic Ocean by ship. Ship building knowledge experienced several marked improvements over the years and by the mid-1800s most merchant ships were larger and faster, being able to cross the Atlantic in as little as two weeks.2
Global trade began a massive transformation in the mid-1960s with the proliferation of the shipping container. The invention of the “roll-on, roll off” (roro) vessel in the 1930s had already created the ability to drive and stow vehicles and heavy equipment either safely inside or externally on the ship's deck. However, many products were still packaged and transported loosely, which often resulted in damaged and lost goods. The invention of the shipping container in 1956 changed all of that. The World Shipping Council explains that “[b]efore the container, products were shipped loose or packaged and bundled in ad-hoc ways. Crates, sacks and barrels had to be manually carried off the ship, and waste and damage was high.”3 Most shipping containers are of a standard size, measuring 20 feet × 8 feet × 8.5 feet, and are referred to as “twenty-foot equivalent units,” or TEUs. The benefit of using a standardized container to ship goods is that they can be quickly unloaded from a ship onto a train or tractor-trailer and transported to almost any destination on the planet. The container also protects the goods while they are being shipped and can allow for perishable goods to remain refrigerated as they are transported over great distances.
Significant advancements in shipping have continued since then at a steady pace. In 1980 the largest container ship was the Neptune Garnet, which had a capacity of 4,100 TEU.4 Today, the largest ships can carry more than 20,000 shipping containers and are appropriately referred to as Ultra Large Container Ships (ULCSs). Furthermore, despite their massive size these ships are fast, being able to cross the Atlantic Ocean in as little as 10 days. As of 2021, the largest container ship in the world, the HMM Algeciras, has close to six times the capacity of the Neptune Garnet at just under 24,000 TEU. To put this into perspective, compared to the merchant ships of the early 1800s, container ships today can cross the Atlantic Ocean with more than 500 times the amount of cargo and travel four to five times the distance each year. Undoubtedly, ships will continue to evolve, becoming either larger, faster, or more fuel-efficient, and hopefully thereby more environmentally friendly. This is becoming critical in light of growing concerns over climate change and the increasing importance of environmental factors, which we discuss in Chapter 8. Larger cargo capacity and shorter transport times have in turn driven down the cost of shipping goods around the globe significantly.
Quickly recognizing the benefits of container shipping, ports around the world were eager to adapt themselves to container shipping and today this is how most goods are transported globally, with an estimated 90% of everything we buy transported by ship.5 Of course, ships cannot reach every corner of the globe and so combining ships with rail and road transport is necessary. This movement of goods via a combination of ship, rail and road is known as intermodal transport, with container ports serving as the critical junction points connecting land and sea. In 2019 the top ten container ports in the world, shown in Figure 3.1, handled nearly 250 million TEU arriving and departing by both land and sea.6
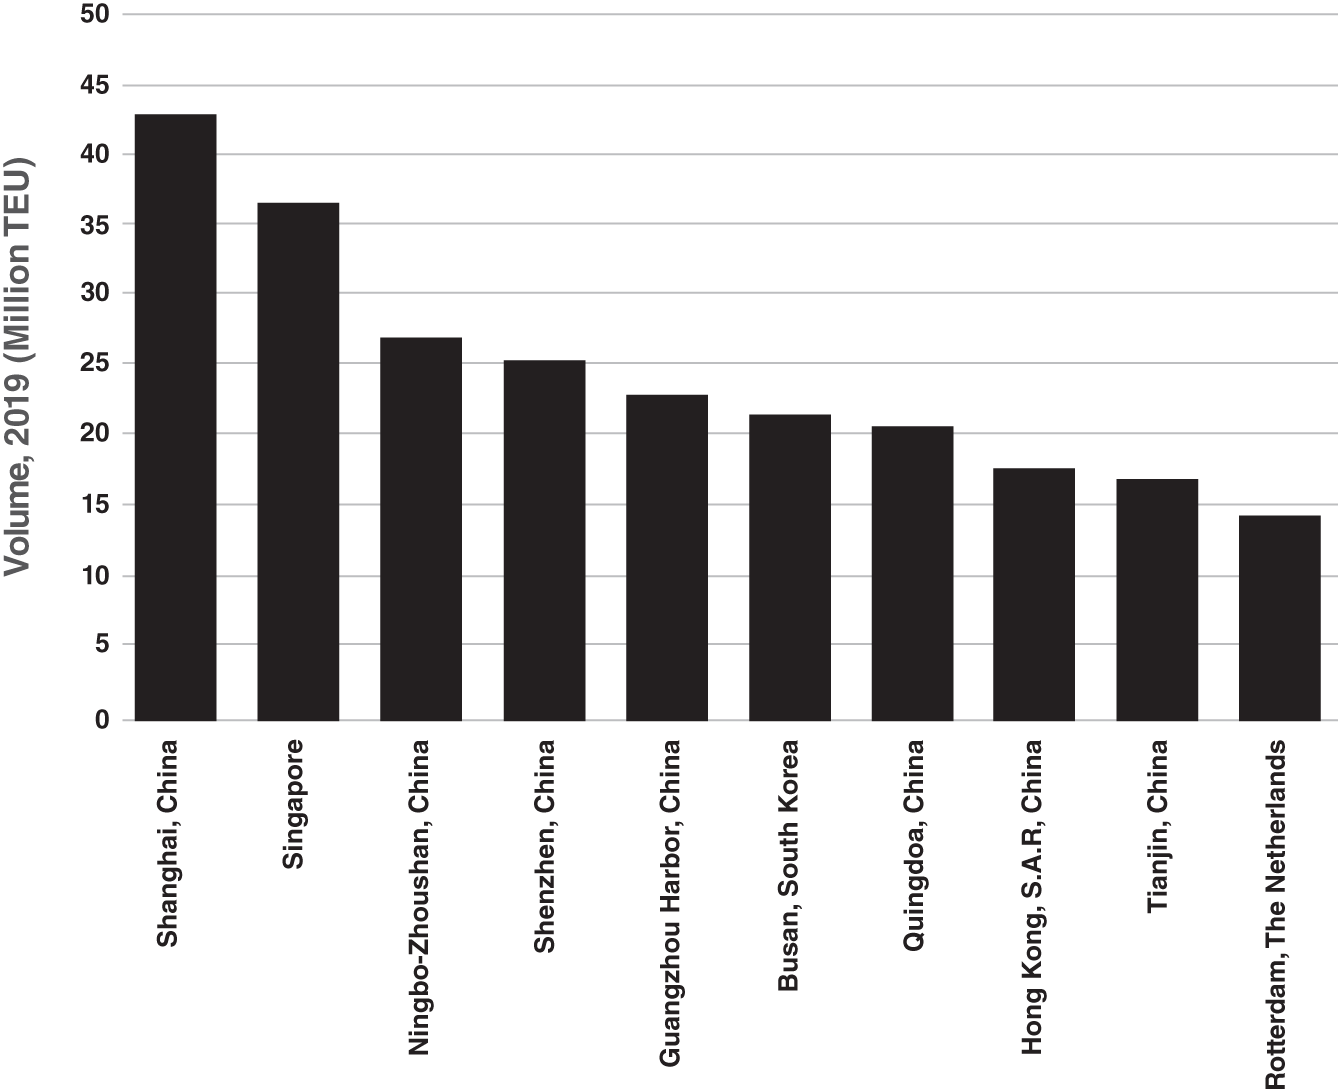
FIGURE 3.1 The 10 Largest Container Ports in the World (2019)
Source: World Shipping Council, “The Top 50 Container Ports,” https://www.worldshipping.org/top-50-ports, accessed December 26, 2021.
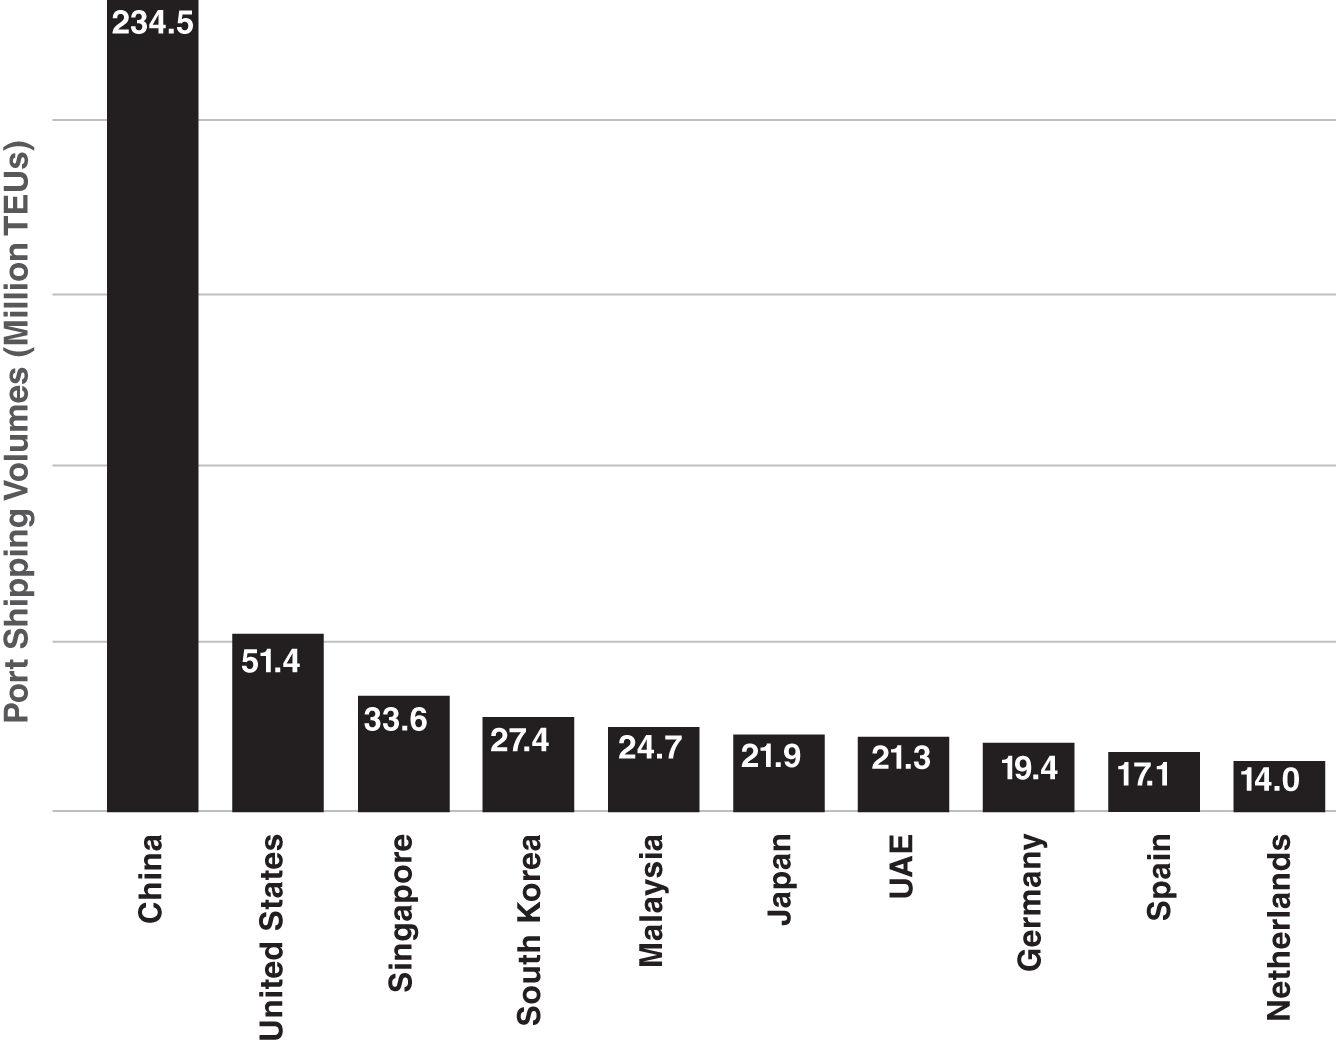
FIGURE 3.2 Shipping Volumes by Country (2019)
Source: The World Bank, https://data.worldbank.org/indicator/IS.SHP.GOOD.TU, accessed December 26, 2021.
With an average loaded weight of 10–12 tons per container,7 these ports collectively managed the safe transit of approximately 2.5 billion tons of cargo and nearly one-third of the 795 million TEUs in total container port traffic in 2019.8 Disruption in any one of these ports has the ability to affect the delivery of goods around the world. You will note that many of the world's busiest container ports are located in Asia. Figure 3.2 shows total shipping volumes by country, with five of the top 10 countries located in Asia.
What is readily apparent from Figure 3.2 is that Chinese ports have become a critical component of the global supply chain. Due to an imbalance in trade, where more goods are shipped from rather than to Asia, many containers leave Asian ports full but must be returned empty to meet future shipping needs.
Air Freight
If time is of the essence, air freight can bring the time needed to transport goods around the world down to mere hours. Higher transportation costs prevent air freight from being a larger portion of global trade, but it is still very significant, with approximately 57.5 million tons of cargo carried in 2020. Most air freight shipping occurs between North America and Asia (26.9% of the worldwide total), Asia and Europe (20.8%), and Europe and North America (12%). Air freight volume between the Middle East and Asia is also significant at 6.8% of the total.9 The World Bank estimates that air freight is priced four to five times that of road transport and 12 to 16 times that of sea transport. These higher costs combined with the limited size of cargo planes has a direct impact on the types of goods that are shipped by air. “Commodities shipped by air thus have high values per unit or are very time-sensitive, such as documents, pharmaceuticals, fashion garments, production samples, electronics consumer goods, and perishable agricultural and seafood products. They also include inputs needed to meet just-in-time production and emergency shipments of spare parts.”10 Air freight is therefore critical in manufacturing processes since companies frequently exchange samples and technical drawings. Another limiting factor for air freight is the inability of planes to safely transport certain hazardous materials.
Trends in Global Trade
Faster speed of transport and reduction in per-unit shipping costs over the years has served to create deeper and more complex connections between businesses in different countries. In addition, increasing levels of global economic development have resulted in a greater number of manufacturers capable of producing high-quality, technologically advanced components. Where a company might have previously had no choice but to secure the supply of a critical part locally to guarantee availability, lower cost, and speed of delivery, it may now be more economical to source the component from an overseas supplier. Increasing wealth at the global level has also played a role, allowing consumers to reach further around the world to buy the goods they most desire. These trends can be seen in Figure 3.3, which shows the growth in worldwide exports from 1988 to 2019.
Despite downturns in 2009 and 2014–2016, global trade has continued to expand, with worldwide exports totaling US$20.5 trillion in 2019.11 Although not reflected in Figure 3.3, the 2020 global pandemic caused global trade to weaken and resulted in calls for increasing domestic production to ensure supply of critical components like semiconductors. Of course, any such changes to the supply chain would likely come at the expense of global trade. Even with this potential setback, however, it is very likely that international trade will continue to expand well into the future.
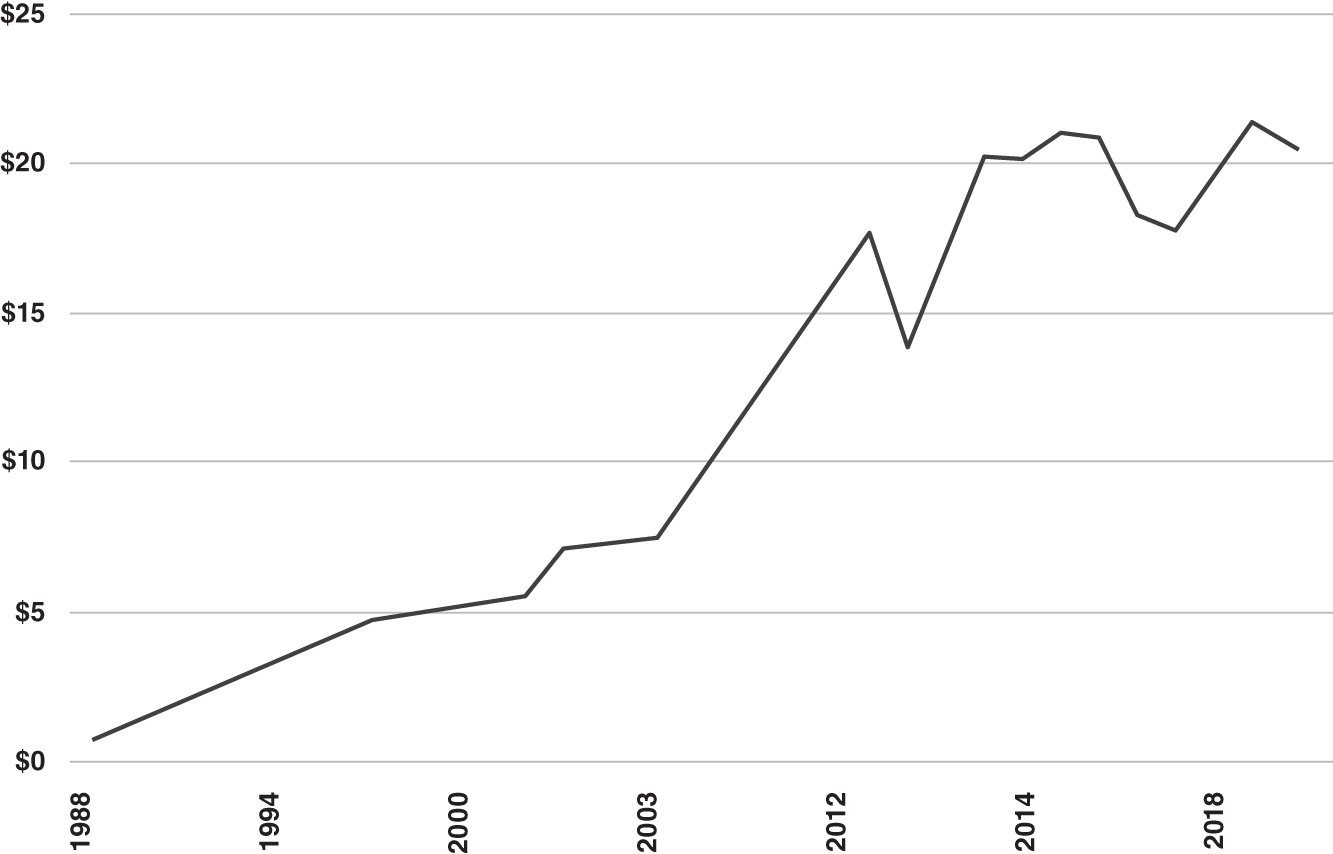
FIGURE 3.3 Worldwide Exports (Trillions USD)
Data source: World Integrated Trade Solution, https://wits.worldbank.org/CountryProfile/en/Country/WLD/Year/2016/TradeFlow/Export/Partner/all/Product/Total.
Global Trade Routes
Most goods are transported between countries along specific routes around the world. Whether by rail, road, air, or sea, these trade routes tend to be made narrow, either by man or nature, and are therefore subject to bottlenecks. As noted earlier, the majority of global trade is conducted by sea, with geographical constraints causing most ships to follow specific routes, which are subject to bottlenecks, or “chokepoints,” as they are also known. These are typically the shortest or safest route between two points. These chokepoints are therefore of strategic importance to countries and represent significant risks to global trade as they are vulnerable (to varying degrees) to accidents and acts of aggression. Avoiding rough seas and pirates are among the obstacles shipping companies need to overcome when transporting goods. These routes are heavily trafficked, which means they can become blocked, and the consequences can be costly. The key global shipping routes for oil and petroleum are shown in Figure 3.4.
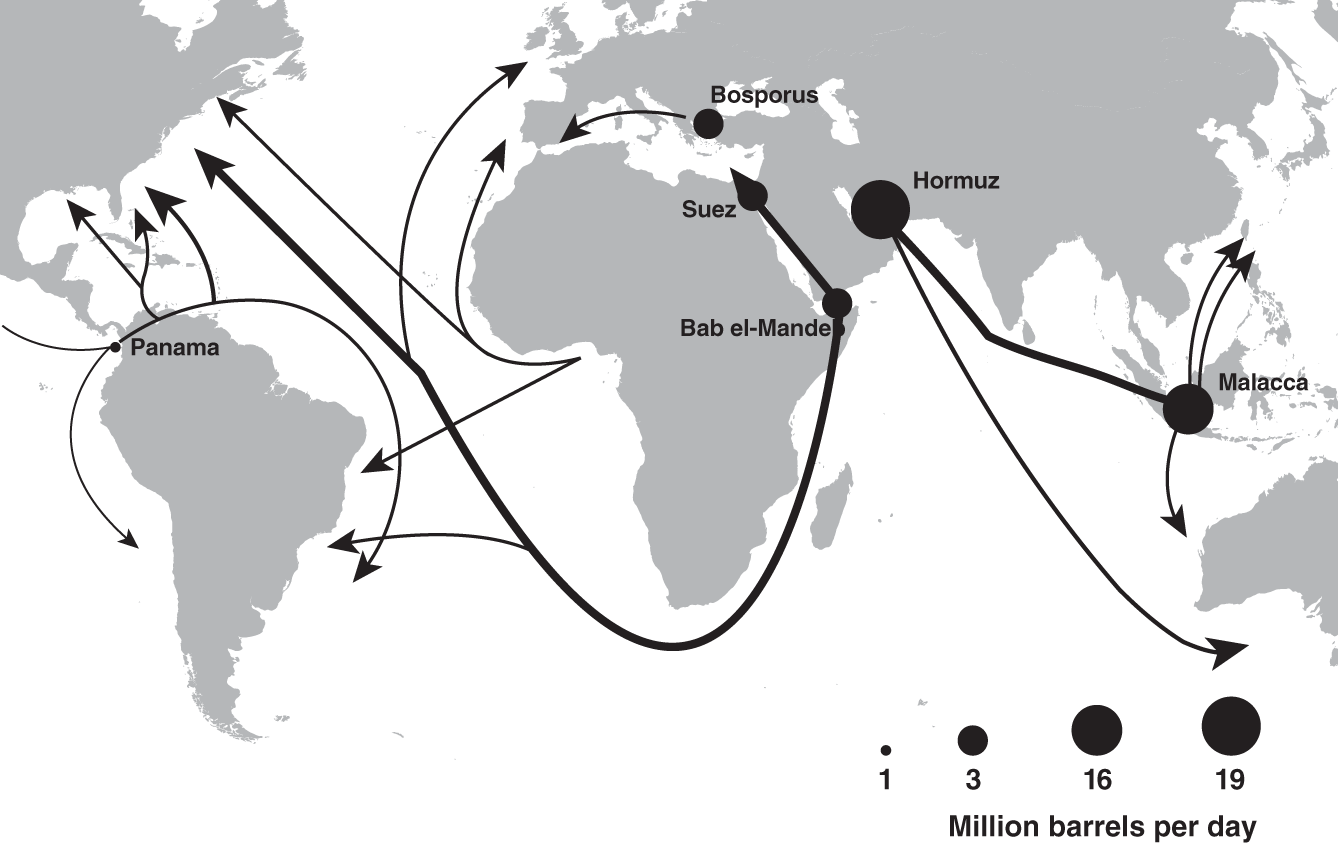
FIGURE 3.4 Major Petroleum Shipping Routes
Source: Energy Information Administration, as of 2017, adapted from https://www.eia.gov/todayinenergy/detail.php?id=330 and https://www.eia.gov/todayinenergy/detail.php?id=32292.
The Danish Straits
The Danish Straits (Figure 3.5) consist of the waterways connecting the Baltic Sea to the North Sea and thereby the Atlantic Ocean. In addition to significant container shipping traffic, approximately 3.2 million barrels of oil was shipped per day via the Danish Straits in 2016.12 Both the Danish and Turkish Straits are key access points for trade with Russia and are therefore critical to Europe's energy supply and its economies.
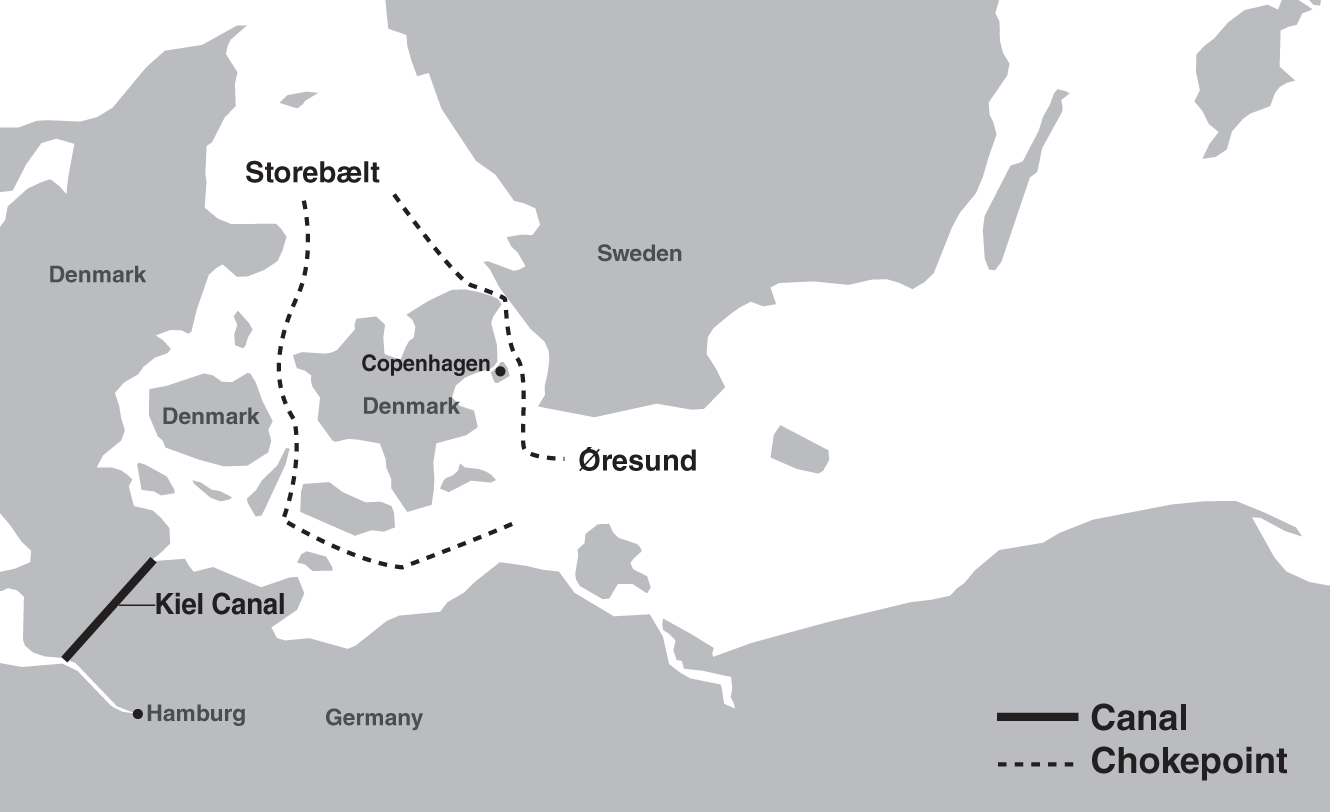
FIGURE 3.5 The Danish Straits
The English Channel
At 350 miles (563 km) long, the English Channel (Figure 3.6) separates Britain from France and connects the Atlantic Ocean with the North Sea. With 500–600 vessels passing through the English Channel each day, it is the busiest shipping route in the world and is critical to European trade. The English Channel connects major ports in Northern Europe (among the busiest in the world) to the rest of the globe.
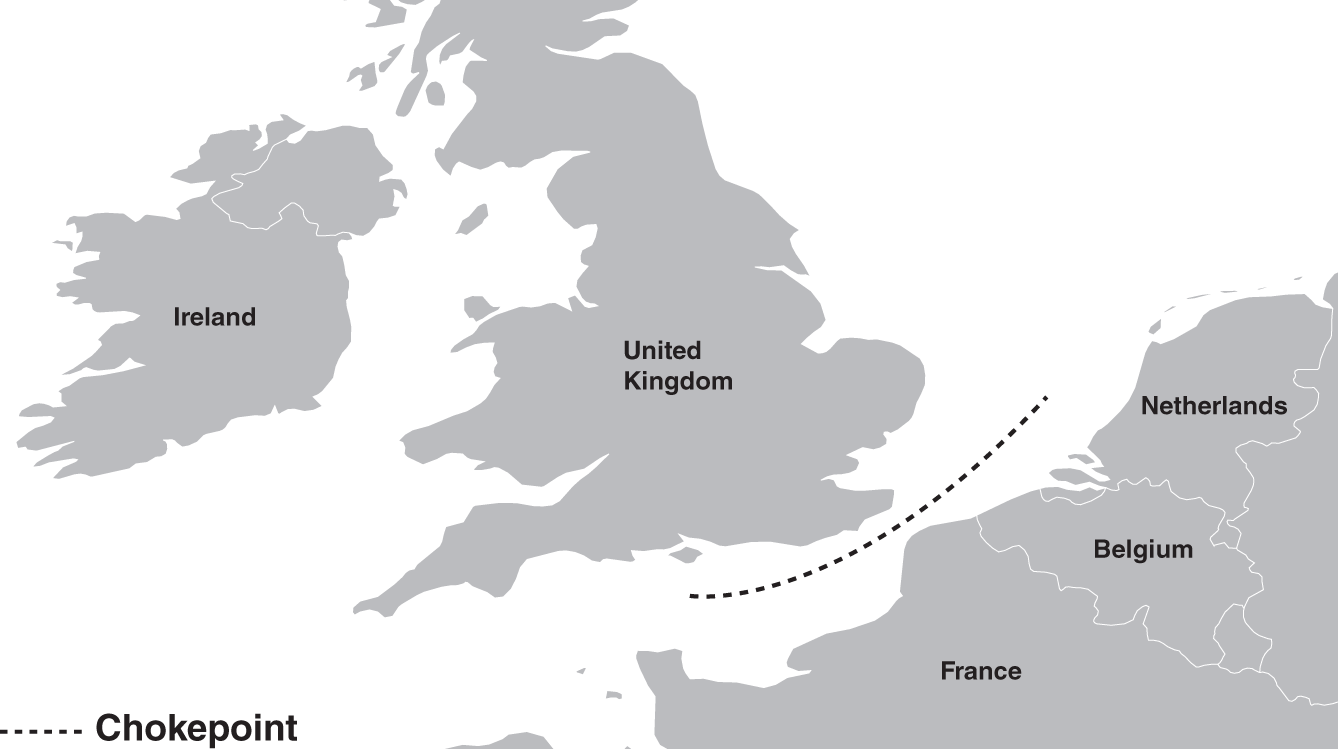
FIGURE 3.6 The English Channel
The Strait of Malacca
A 580 mile (933 km) long stretch of water between Malaysia and Indonesia, the Strait of Malacca (Figure 3.7) is the shortest sea route between China and India. At its narrowest point, the Strait of Malacca is only 1.7 miles wide and it connects the Pacific and Indian Oceans via the South China Sea. Energy products transiting the Strait of Malacca reached 16 million barrels per day in 2016, making it the second-largest oil trade chokepoint in the world after the Strait of Hormuz.13 It facilitates trade within Asia as well as between Asia and Europe.
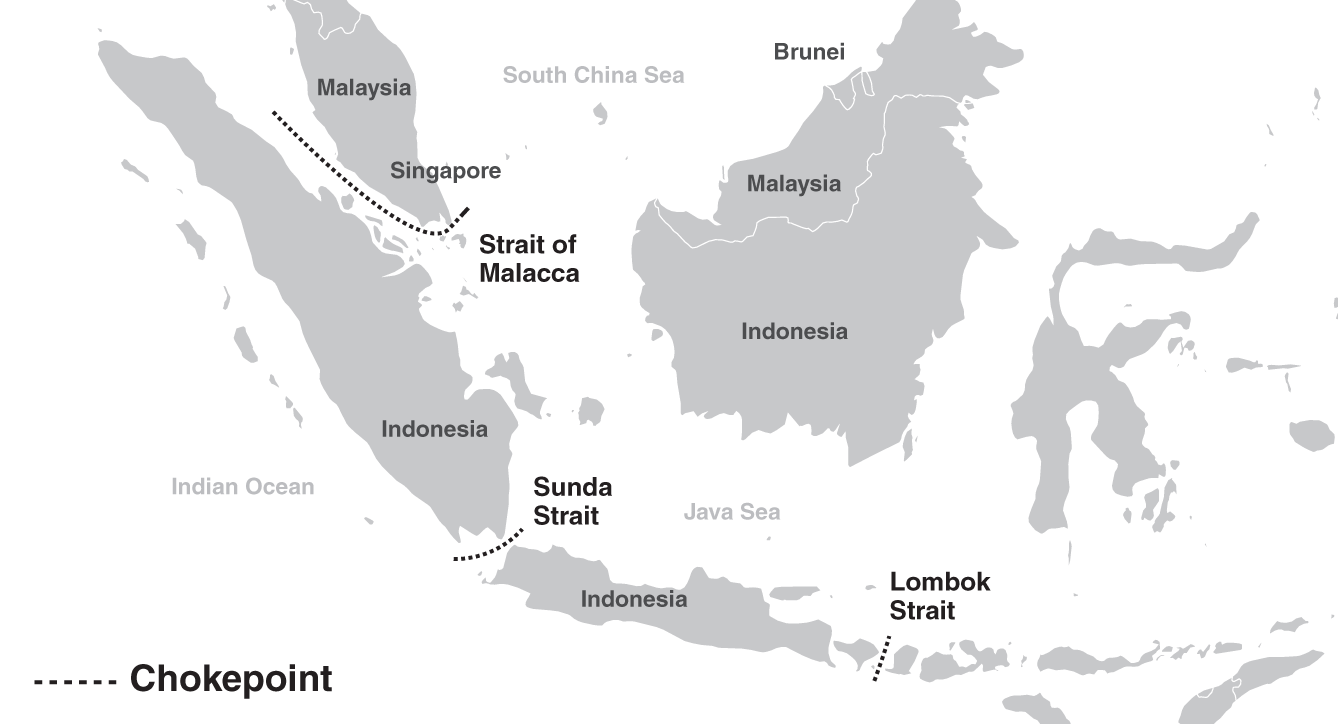
FIGURE 3.7 The Strait of Malacca
The Panama Canal
Completed in 1914, the Panama Canal (Figure 3.8) consists of three locks that allow ships to transit between a 65 km (40 mile) wide strip of land between the Caribbean Sea and the Pacific Ocean via Gatun Lake, which sits 85 feet above sea level. The journey takes between 8 and 10 hours and saves the vessel from having to circumvent the hazardous waters off Cape Horn at the southern tip of South America, a trip that could add two weeks and significant costs to the journey. The Panama Canal manages close to 12% of American seaborne trade.14
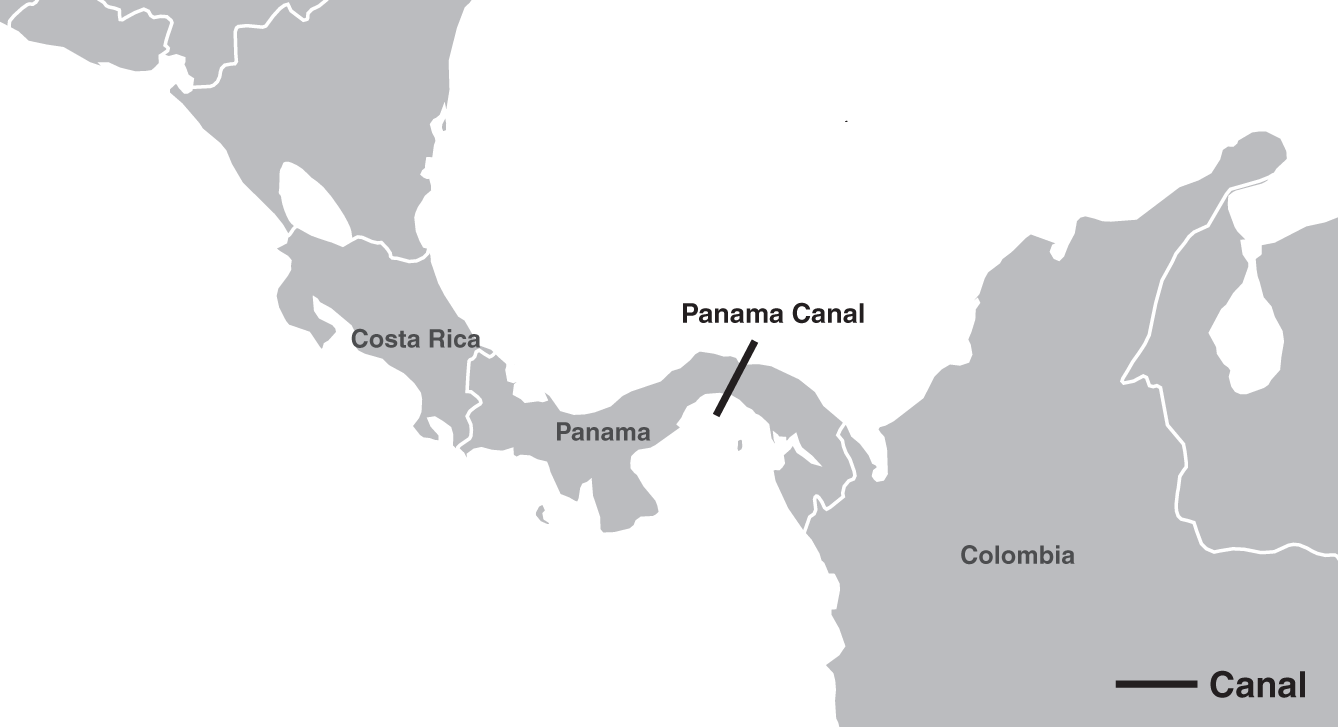
FIGURE 3.8 The Panama Canal
The Turkish Straits
The Turkish Straits (Figure 3.9) are made up of the Bosporus and Dardanelles Straits, which link the Black Sea with the Mediterranean Sea and then the world's oceans. “Only half a mile wide at the narrowest point, the Turkish Straits are among the world's most difficult waterways to navigate because of their sinuous geography. About 48,000 vessels transit the Turkish Straits each year, making this area one of the world's busiest maritime chokepoints.”15 Approximately 2.4 million barrels of crude oil and petroleum products were transported through the Turkish Straits per day in 2016.
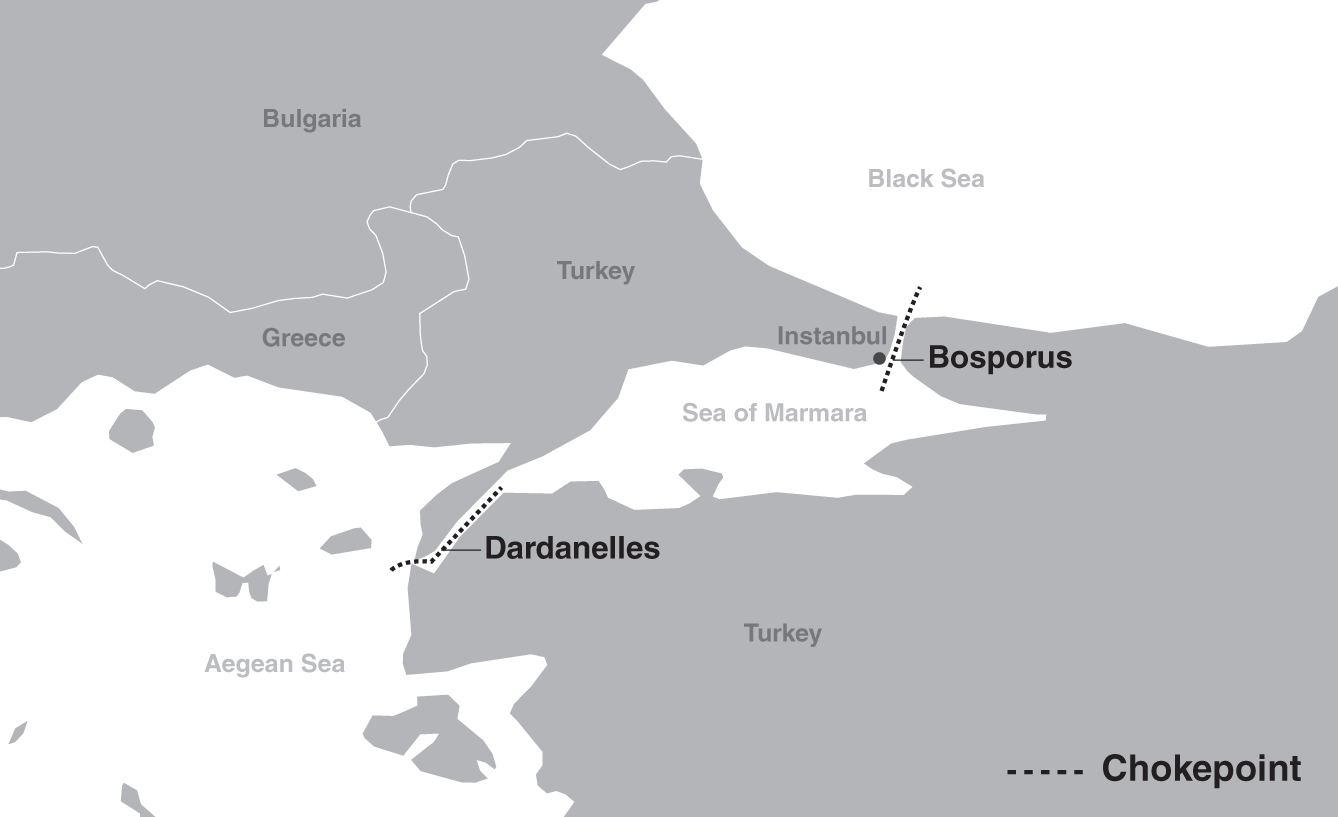
FIGURE 3.9 The Turkish Straits
The Suez Canal and the Strait of Hormuz
Completed in 1869, the Suez Canal offers the fastest sea route between the Indian Ocean and the Mediterranean Sea and, by extension, the Atlantic Ocean (see Figure 3.10). The Canal is narrow and cannot support two-way traffic, causing the 120-mile journey to take about 16 hours to complete. It is estimated that nearly 19,000 ships and over 1 billion tons of cargo passed through it in 2019, making it a critical chokepoint in the global supply chain network.16 If ships could not use the Suez Canal, they would have to either wait for the passage to clear or circumvent the Cape of Good Hope at the southern tip of Africa, which would add significant delays and fuel costs to their voyage. This occurred in March 2021 when one of the largest container ships in the world, the 242,500-ton Ever Given, became stuck in the southern portion of the Suez Canal. The Ever Given, with a length of over 1,300 feet and capable of carrying more than 20,000 shipping containers, blocked hundreds of other vessels from passing through the Canal for a period of six days. With around 12% of global trade moving through the Suez Canal, it is estimated that this accident cost the global economy close to US$10 billion per day.
Located between Iran and Oman in the Persian Gulf, the Strait of Hormuz is strategically important because it is home to one-third of all seaborne-traded crude oil, making it the most important passageway for oil transportation worldwide.17 With an average flow of 21 million barrels per day, the Strait of Hormuz handled close to 21% of global petroleum liquids in 2018. An estimated 76% of crude oil moving through the Strait of Hormuz was destined for Asian markets, principally China, India, Japan, South Korea, and Singapore.18
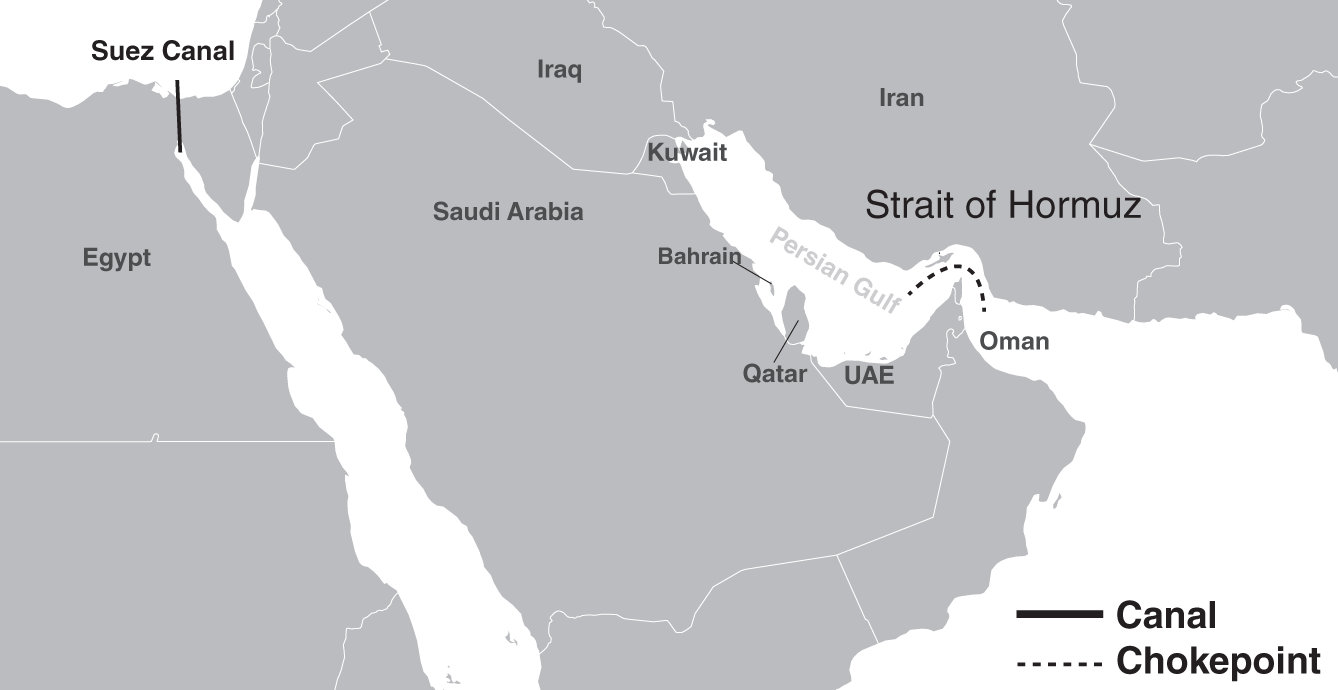
FIGURE 3.10 The Suez Canal and the Strait of Hormuz
The St. Lawrence Seaway
The St. Lawrence Seaway (Figure 3.11) runs 2,300 miles between Canada and the United States and is comprised of the St. Lawrence River, St. Lawrence Seaway, and the Great Lakes. The Seaway connects the industrial centers in the midwest United States and Canada to the Atlantic Ocean.
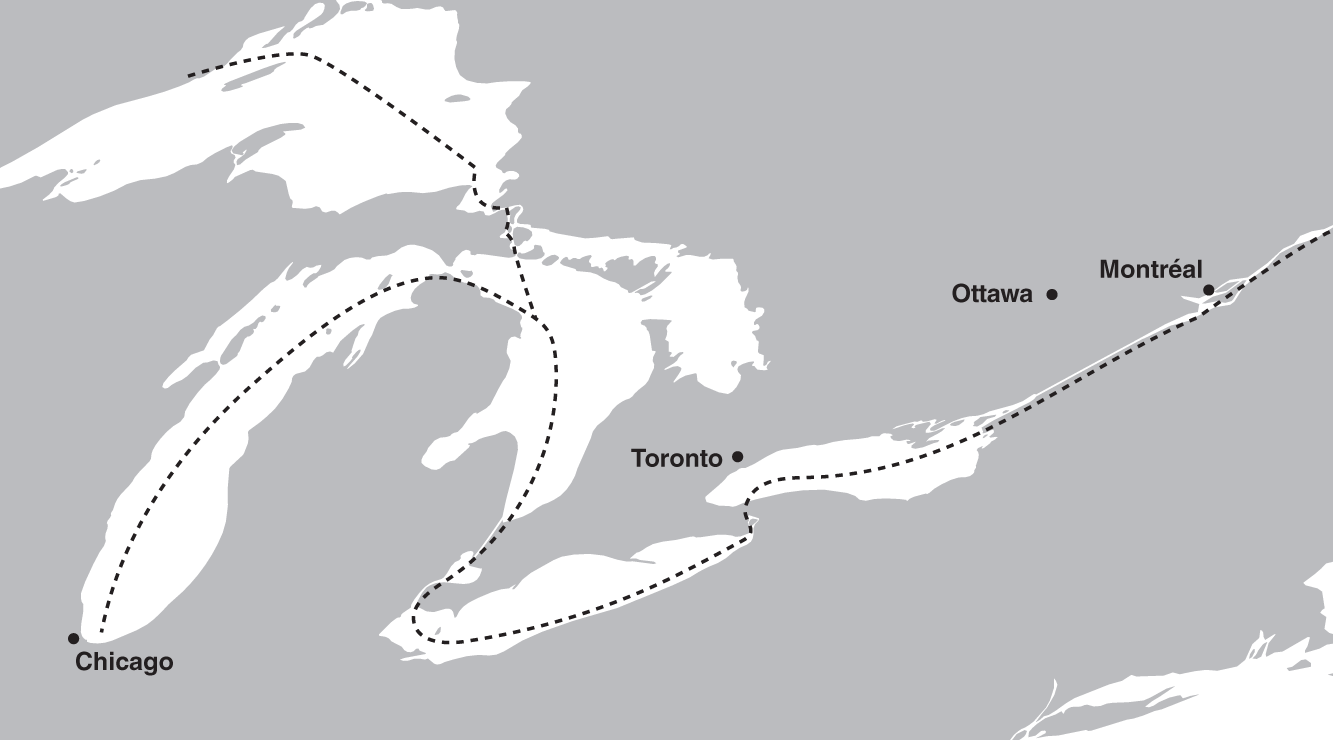
FIGURE 3.11 The St. Lawrence Seaway
The Baltic Exchange Dry Index
As with most products and services, shipping costs vary based on supply and demand. One indicator of the strength of global trade is the Baltic Exchange Dry Index (BDI). This index was created in January of 1985 for the purpose of tracking the average price paid for shipping dry bulk goods by sea. Figure 3.12 illustrates how shipping costs can fluctuate significantly.
Periods of strong global economic growth tend to result in higher shipping costs since demand for goods increases, but the supply of available ships also plays a critical role in determining the price paid to ship goods. As with many other business and economic factors, shipping costs have an automatic self-correcting mechanism. Increased demand for goods drives up shipping costs, which increases profitability for shipping companies. Shipping companies then invest in more ships to meet the higher level of demand, thereby increasing the supply of ships. At the same time, the manufacturers whose products are being shipped experience a drop in profitability due to the higher shipping costs they must pay. In response, manufacturers increase the price of their goods, which causes consumers to buy less of them, thereby reducing demand for goods. The reduction in demand for goods combined with the increased supply of ships causes shipping prices to fall and the entire process starts over. This type of cycle is seen across many aspects of the global economy and is discussed in more detail in Chapter 5.
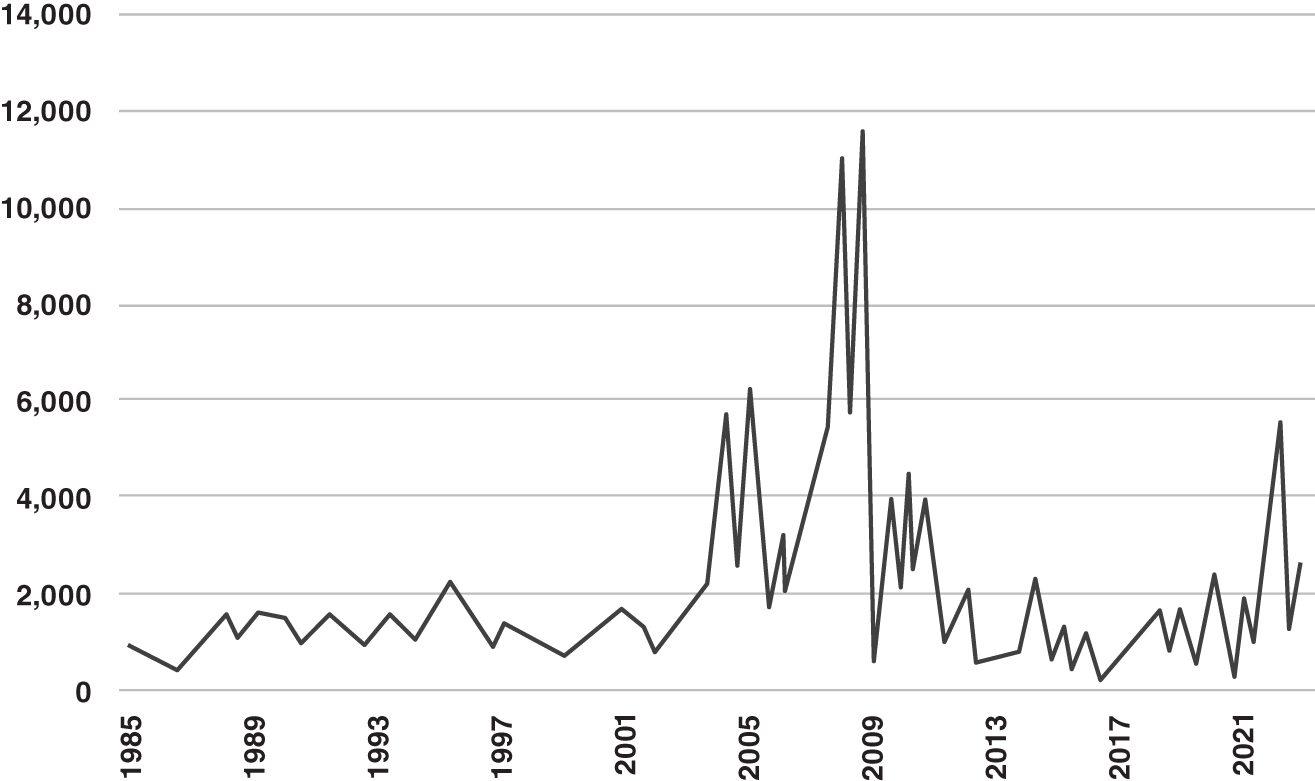
FIGURE 3.12 The Baltic Exchange Dry Index
Data source: Bloomberg, as of April 30, 2022.
Trade Agreements
Another factor that has contributed greatly to the growth in global trade is the propagation of regional trade agreements and free trade zones. Free trade agreements have proliferated in recent years, growing from only 50 in 1990 to more than 280 in 2017.19 While certain agreements are focused on specific areas of trade and commerce, others are broad-based. Designed to promote regional trade and economic cooperation, these agreements go beyond simply reducing tariffs, often addressing issues such as competition policy, intellectual property rights, and rules concerning government procurement. Mechanisms for dispute resolution are also key elements of most trade agreements. Broad-based trade agreements, which the World Bank refers to as deep agreements, increase goods trade by more than 35% and trade in services by more than 15% on average.20 In some cases, these deep trade agreements cover a specific geographic region, creating what is referred to as a free trade zone. The most noteworthy free trade agreements are summarized below.
The United States–Mexico-Canada Agreement (USMCA) is a free trade agreement covering a population of nearly half a billion people. Formerly the North American Free Trade Agreement (NAFTA), the trade deal was renegotiated and signed in 2018, coming into effect on July 1, 2020. In 2019, trilateral trade between these three countries exceeded US$1.1 trillion. Since the inception of the original NAFTA agreement in 1994, merchandise trade between the three countries has grown by over 250%.21
The European Union is a political and economic union of 27 member states, which includes Austria, Belgium, Bulgaria, Croatia, Cyprus, Czechia, Denmark, Estonia, Finland, France, Germany, Greece, Hungary, Ireland, Italy, Latvia, Lithuania, Luxembourg, Malta, Netherlands, Poland, Portugal, Romania, Slovakia, Slovenia, Spain, and Sweden. The EU economy accounts for approximately 15% of the world's trade in goods, with total GDP of €16.4 trillion in 2019 (when the UK was still part of the EU).22
The Association of Southeast Asian Nations (ASEAN) Free Trade Area (AFTA), signed in 1992 in Singapore, now includes Brunei, Cambodia, Indonesia, Laos, Malaysia, Myanmar, Philippines, Singapore, Thailand, and Vietnam and is one of the largest free trade areas in the world. ASEAN later signed free trade agreements with Australia, New Zealand, China, India, and Korea, as well as the ASEAN-Japan Comprehensive Economic partnership. The ASEAN free trade area is home to more than 661 million people and generated GDP of nearly US$3 trillion in 2020.23
The Southern Common Market (Mercosur) agreement is designed to promote trade as well as economic and political cooperation in South America. Its members include Argentina, Brazil, Paraguay, Uruguay, and Venezuela. Bolivia is in the process of joining Mercosur. Mercosur member states are home to more than 295 million people and produced GDP of approximately US$4.6 trillion in 2019.24
The Common Market of Eastern and Southern Africa (COMESA) is designed to promote economic cooperation between its 21 member states, which have a joint population of over 583 million and produce total GDP of more than US$805 billion. Its member states include Burundi, Comoros, Democratic Republic of the Congo, Djibouti, Egypt, Eritrea, Eswatini, Ethiopia, Kenya, Libya, Madagascar, Malawi, Mauritius, Rwanda, Seychelles, Somalia, Sudan, Tunisia, Uganda, Zambia, and Zimbabwe.
The Regional Comprehensive Economic Partnership (RCEP) is a free trade agreement among 15 countries, including the 10 ASEAN member states of Brunei, Cambodia, Indonesia, Laos, Malaysia, Myanmar, the Philippines, Singapore, Thailand, and Vietnam, plus China, Japan, South Korea, Australia, and New Zealand. RECP member countries account for nearly one-third of the world's population and approximately 30% of world GDP.25
The Asia-Pacific Economic Cooperation is a cooperative, multilateral trade and economic forum comprised of 21 member countries, including Australia, Brunei, Cambodia, Canada, Chile, China, Indonesia, Japan, South Korea, Malaysia, Mexico, New Zealand, Papua New Guinea, Peru, the Philippines, Russia, Singapore, Taiwan, Thailand, the United States, and Vietnam.
Negotiations for the Trans-Pacific Partnership (TPP) Agreement began in 2015 and continued to progress toward ratification until 2017 when the United States withdrew from the agreement. The TPP was subsequently replaced by the Comprehensive and Progressive Agreement for Trans-Pacific Partnership (CPTPP), whose signatories include Australia, Brunei, Canada, Chile, Japan, Malaysia, Mexico, New Zealand, Peru, Singapore, and Vietnam. To date only Japan and New Zealand have ratified the agreement.
Intergovernmental Organizations
In addition to the impact of individual governments and businesses on world trade, several intergovernmental organizations exist whose objective it is to facilitate global trade. Foremost among these is the World Trade Organization (WTO), whose fundamental goal is to improve the welfare of people around the world by fostering global trade. Agreements between the 164 members of the WTO outline the global rules of trade between those countries and are designed to ensure that trade flows as smoothly and freely as possible. WTO agreements cover a wide range of trade issues, including goods, services, and intellectual property rights, and provide countries with a mechanism for resolving trade disputes.26
The Organisation for Economic Co-operation and Development (OECD) fosters international cooperation to improve economic performance and create jobs, improve education standards, and fight international tax evasion. The OECD's 38 member countries represent about 80% of world trade and investment.27
The United Nations Conference on Trade and Development (UNCTAD) is part of the UN Secretariat and has the goal of ensuring that developing countries can effectively share in the benefits of the globalized economy. UNCTAD was established in 1964 and has 195 member states. It operates as a think tank where the goal is to tackle critical issues facing the global economy.
Another key organization that helps indirectly promote global trade is the Bank for International Settlements (BIS), whose purpose is to promote global monetary and financial stability and to function as a bank to the world's central banks. The BIS is owned by 63 central banks from around the world that together account for about 95% of world GDP. It was formed in 1930 and is headquartered in Basel, Switzerland, with offices in Hong Kong SAR and in Mexico City, and has Innovation Hubs around the world.28
The World Bank, while not explicitly designed to promote global trade, still has an indirect role to play as it strives to reduce poverty and promote sustainable development. Collectively, these agreements and institutions have shaped the modern global supply chain system.
Supply Chains
When investing in a company it is important to understand its business relationships and how the company may be dependent on other firms for components or services. The sources used by a company to obtain the goods it requires to operate its business are referred to as its supply chain. Information about a company's supply chain is often available in the company's regulatory filings under the section that details business risks; however, if this information is not disclosed, investors can usually contact the company's investor relations department directly to obtain this information.
From a business perspective, the global economy has become much more intertwined than it was only a couple of decades ago. Many businesses around the world depend on foreign sources for components used in their products. In some cases, goods are transported back and forth between different regions several times before becoming a final product that is sold to the end customer. The 2020 global pandemic served to highlight the interconnectedness of the world economy, not to mention the fact that supply chain shortages have the potential to cause inflationary pressures, as manufacturers from around the world ran short of everything from semiconductor chips used in automobile production to aluminum used to make beverage cans.
The best businesses are good at managing their supply chain, but for a major global company the supply chain can become extraordinarily complex. Apple Inc., for example, has more than 600 suppliers globally.29 Complicating matters further, most businesses try to diversify between suppliers to avoid the risks associated with obtaining necessary components from a single source. If an important supplier were to suffer an environmental disaster, like an earthquake, it could fail to meet customer requirements. Similarly, manufacturing or quality control issues could mean the supplier delivers a part or service that is not useable or creates a defective product. A delay in delivering a $50,000 automobile to a customer caused by the shortage of a $5 semiconductor chip is a fitting example of how vulnerable a manufacturer can be to disruptions in the supply of key components.
The timing of component or service delivery is also important to consider. While inventory requirements vary by industry, the best businesses are generally able to minimize the amount of product they keep on hand. This is especially true in industries where assets depreciate quickly, such as technology. If a component is kept too long in storage, its value can go down and it can even become obsolete. In the meantime, the company is tying up cash unnecessarily by holding excess inventory. Striking the right balance is critical, as low inventory levels make the business more dependent on the prompt arrival of components to keep the manufacturing process going. Similarly, holding excessive amounts of inventory is not productive and inefficiently ties up working capital. While each industry is unique with some requiring few or no external suppliers, maintaining low levels of both components and finished inventory using secure and stable sources of supply is the structure most businesses strive to achieve.
The extreme interconnectedness of the global economy and business supply chains has made globalization inexorable and creates both opportunities and risks for the global investor. Although there is a long way to go until all of humanity shares in the prosperity that has resulted from globalization, the needle is at least moving in the right direction. If nothing else, globalization creates a dynamic whereby countries are more likely to seek amicable solutions to their differences.
Notes
- 1. World Ocean Review, https://worldoceanreview.com/en/wor-1/transport/global-shipping/, accessed November 7, 2021.
- 2. Britannica, “Shipping in the Nineteenth Century,” https://www.britannica.com/technology/ship/Shipping-in-the-19th-century, accessed December 26, 2021.
- 3. World Shipping Council, https://www.worldshipping.org/building-prosperity, accessed December 26, 2021.
- 4. GlobalSecurity.Org, “Container Ship Types,” https://www.globalsecurity.org/military/systems/ship/container-types.htm, accessed December 26, 2021.
- 5. World Shipping Council, “Liner Shipping, The Backbone of World Trade,” December 7, 2021, https://static1.squarespace.com/static/5ff6c5336c885a268148bdcc/t/61af42321c8a8b68c5408b9c/1638875715637/Liner+Shipping_Whitepaper_English.pdf.
- 6. World Shipping Council, “The Top 50 Container Ports,” https://www.worldshipping.org/top-50-ports, accessed December 26, 2021.
- 7. GlobalSecurity.org, https://www.globalsecurity.org/military/systems/ship/container-types.htm, accessed December 26, 2021.
- 8. The World Bank, https://data.worldbank.org/indicator/IS.SHP.GOOD.TU, accessed December 26, 2021.
- 9. International Air Transport Authority, “World Air Transport Statistics, Plus Edition 2021,” https://www.iata.org/contentassets/a686ff624550453e8bf0c9b3f7f0ab26/wats-2021-mediakit.pdf, accessed December 26, 2021.
- 10. The World Bank, “Air Freight: A Market Study with Implications for Landlocked Countries,” https://www.worldbank.org/en/topic/transport/publication/air-freight-study, accessed December 26, 2021.
- 11. World Integrated Trade Solution, https://wits.worldbank.org/CountryProfile/en/Country/WLD/Year/LTST/TradeFlow/Export/Partner/by-country/Product/Total#, accessed November 7, 2021.
- 12. US Energy Information Administration, “Today In Energy,” August 18, 2017, https://www.eia.gov/todayinenergy/detail.php?id=32552.
- 13. US Energy Information Administration, “The Strait of Malacca, a Key Oil Trade Chokepoint, Links the Indian and Pacific Oceans,” August 11, 2017, https://www.eia.gov/todayinenergy/detail.php?id=32452.
- 14. GlobalSeecurity.org, “Worldwide Chokepoints,” https://www.globalsecurity.org/military/world/chokepoints.htm#:~:text=Examples%20include%3A%20Strait%20of%20Hormuz%20%E2%80%93%20provides%20transit,12%20percent%20of%20the%20American%20international%20seaborne%20trade, accessed June 1, 2022.
- 15. US Energy Information Administration, “Today in Energy.”
- 16. Suez Canal Authority, https://www.suezcanal.gov.eg/English/Navigation/Pages/NavigationStatistics.aspx, accessed November 7, 2021.
- 17. US Energy Information Administration, “The Strait of Hormuz Is the World's Most Important Oil Transit Chokepoint,” December 27, 2019, https://www.eia.gov/todayinenergy/detail.php?id=42338.
- 18. US Energy Information Administration, “The Strait of Hormuz.”
- 19. World Bank, “Regional Trade Agreements,” https://www.worldbank.org/en/topic/regional-integration/brief/regional-trade-agreements, accessed January 17, 2022.
- 20. World Bank, “Regional Trade Agreements.”
- 21. Government of Canada, “Canada-United States-Mexico Agreement,” https://www.international.gc.ca/trade-commerce/trade-agreements-accords-commerciaux/agr-acc/cusma-aceum/index.aspx?lang=eng, accessed January 17, 2022.
- 22. The European Union, “Facts and Figures on the European Union Economy,” https://european-union.europa.eu/principles-countries-history/key-facts-and-figures/economy_en#:~:text=The%20European%20Union%20operates%20as%20a%20single%20market,around%2015%25%20of%20the%20world%E2%80%99s%20trade%20in%20goods, accessed May 16, 2022.
- 23. The ASEAN Secretariat, “ASEAN Statistical Yearbook 2021,” https://www.aseanstats.org/wp-content/uploads/2021/12/ASYB_2021_All_Final.pdf, accessed May 16, 2022.
- 24. MERCOSUR, https://www.mercosur.int/en/, accessed May 16, 2022.
- 25. Grace Ho, “A Trade Pact Nearly 10 Years in the Making: 5 Things to Know about RCEP,” The Straits Times, November 15, 2020, https://www.straitstimes.com/asia/a-trade-pact-nearly-10-years-in-the-making-5-things-to-know-about-rcep.
- 26. The World Trade Organization, https://www.wto.org/index.htm, accessed January 23, 2022.
- 27. The Organisation for Economic Co-operation and Development, https://www.oecd.org/about/members-and-partners/, accessed January 23, 2022.
- 28. The Bank for International Settlements, https://www.bis.org/about/index.htm?m=1_1, accessed January 23, 2022.
- 29. Data sourced from Bloomberg, as of November 7, 2021.
