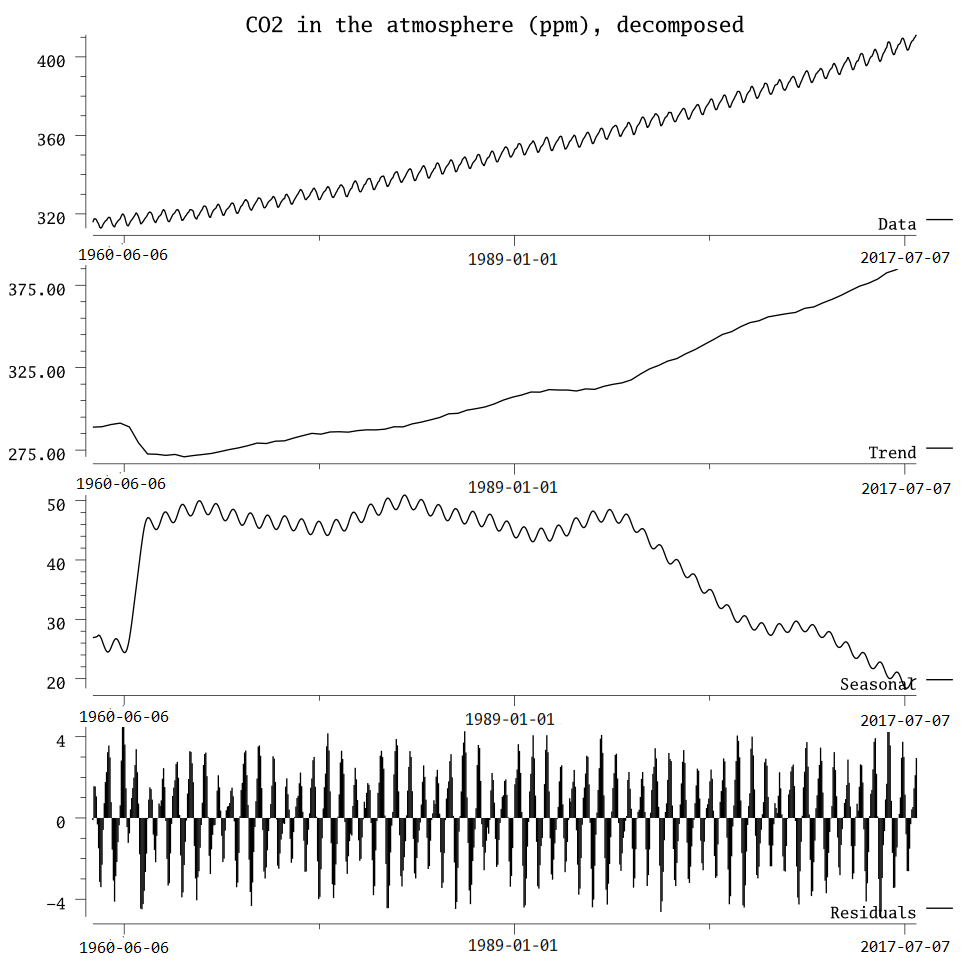
It is important to note that these parameters essentially control how much to attribute the CO2 in the atmosphere to each component. And these controls are rather subjective. The stl package offers a lot of control over how a time series is decomposed, and I think it's up to the data scientist or statistician reading this book (that is you), to do statistics responsibly.
What if we said that a period was five years? Keeping everything the same, we can use the following code and find out:
lies := stl.Decompose(co2s, 60, 84, stl.Additive(), stl.WithIter(1))
dieIfErr(lies.Err)
plts2 := plotDecomposed(dates, lies)
writeToPng(plts2, "CO2 in the atmosphere (ppm), decomposed (Liar Edition)", "lies.png", 25, 25)
The following chart is produced:

We could then take this chart and parade the top two sections and say "Look! Statistics tells us that despite the data looking like it's going up, it's in fact trending down. Hashtag science."
You're of course free to do so. But I know you're not a dishonest person. Instead, I hope that you are reading this book with good intentions of saving the world.
But knowing the correct parameters to use is difficult. One suggestion I have is to go to extremes and then come back down. This is what I mean—we have a rough idea of how the STL algorithm works. A known controlling factor is the iteration count, which defaults to 2. Here's the original correct version, with 1, 2, 5, 10, 20, and 100 iterations:

Interations:


Over the iterations, having been smoothed iteratively, the seasonality loses its jaggedness. Nonetheless, the shape of the trend stays the same. Therefore, in this case, increasing the iteration counts merely shifts the seasonal contribution to the trend component. This implies that the trend component is the stronger "signal" of sorts.
By contrast, if we run the "lies" version, we see that at two iterations, the shape of the trend changes, and by the 10th iteration onward, the shape of the trend stays the same. This gives us a clue as to what the "real" trend is.
With STL, the thing that we're really controlling is the seasonality. What we're saying to the algorithm is that we believe that a period is 12 months; therefore, please find a seasonality that fits. If we say to the algorithm that we believe that a period is five years (60 months), the algorithm will try its best to find a seasonality and trend that fits that pattern.
I wish to be clear—the notion of a seasonality that happens every five years is not wrong. In fact, it is common for business-related forecasting to work on multiple levels of seasonalities. But knowing how many iterations to run, that comes with experience and wisdom.
