
Chapter 12. Code quality management and monitoring
- Considerations and mechanics for integrating code analysis into the build
- Measuring the effectiveness of test code coverage
- Performing static code analysis
- Integrating with Sonar to measure software quality over time
The end product of most commercial projects is a binary. Unless your deliverable doesn’t ship with the source code or is the source code itself, users are usually not concerned about the quality of your code. They’re happy as long as the software fulfills the functional requirements and has no defects. So why would you as the software development and delivery team care? In a nutshell, high-quality code results in fewer bugs and influences nonfunctional requirements like maintainability, extensibility, and readability, which have a direct impact on the ROI for your business. In this chapter, we’ll focus on tools that measure code quality and visualize the results to help you pinpoint problem areas in your code. By the time you finish this chapter, you’ll know how to integrate code quality tools with your build.
Earlier, you learned how to write unit, integration, and functional tests to verify the correctness of your To Do application code. Code coverage analysis (also called test coverage analysis) is the process of finding the areas in your code that are not exercised by test cases. Empirical studies show that reasonable code coverage has an indirect impact on the quality of your code.
Measuring code quality doesn’t stop with code coverage analysis. Coding standards define agreed-on source code conventions within a team or organization, and can range from simple code formatting aspects, such as the use of whitespaces and indentation, to programming best practices. By following these guidelines, you’ll make the code base more readable for other team members, improve its maintainability, and prevent potential bugs. But despite all these benefits, code analysis doesn’t replace a code review by an experienced peer; rather, it complements it.
It’s impossible for a single person to manually keep track of all of these metrics in a large and ever-changing software project. Therefore, it’s essential to be able to easily identify problem areas from a 10,000-foot view and track the progress over time. Code quality tools help you to automatically analyze your software and provide sufficient reporting. In the Java space, you can choose from a wide range of open source and commercial solutions, such as Checkstyle, PMD, Cobertura, FindBugs, and Sonar. Many of these tools are already available in the form of Gradle core or third-party plugins and can be seamlessly integrated into your build. In this chapter, you’ll use many of these plugins to measure the code quality of your To Do application.
12.1. Integrating code analysis into your build
Let’s step back for a minute and think back to the build pipeline stages introduced in chapter 2. Where do we stand? So far you’ve learned how to compile your code and implement and execute various types of tests. These tasks cover the first two phases of the commit stage. If any of these tasks fail, the build will automatically fail.
Though the outcome of code compilation and testing gives you a basic idea of your project’s health status, it doesn’t provide you with any feedback about code quality characteristics such as maintainability and code coverage. Code analysis tools help you produce metrics that make a statement about these characteristics. Some of these metrics produced by code analysis include
- Code coverage
- Adherence to coding standards
- Bad coding practices and design problems
- Overly complex, duplicated, and strongly coupled code
In the context of a build pipeline, code analysis is performed after the first two phases of the commit stage, as shown in figure 12.1.
Figure 12.1. Code analysis phase in the context of the deployment pipeline

Similar to running integration and functional tests, the process of performing code analysis can take a long time depending on the size of your code base and the number of exercised code quality tools. For that reason, it’s helpful to create a dedicated set of Gradle tasks for invoking code quality tools. These tasks are usually provided by a plugin, so you won’t need to create them yourself. In practice, you’ll want to run particular code quality tasks independently from others. For example, during development you may want to know whether you’ve improved the code coverage of the class you’re currently refactoring without having to run other lengthy code quality processes.
Code quality tasks shouldn’t depend on each other, which makes them perfect candidates to be executed in parallel. In the overall build lifecycle of a Java project, it’s helpful to make the verification task check depend on all the code quality tasks, as shown in figure 12.2. Bear in mind that the given task names in the figure are only representative names.
Figure 12.2. Code analysis tasks in relation to the standard Java plugin tasks

Projects may consist of multiple source sets for separating code with different concerns. You learned how to do this in chapter 7, when you defined an additional source set solely for integration tests. To get a clear, comprehensive picture of code quality, you’ll need to be able to selectively perform code analysis on individual source sets or even on all of them. You’ll start by measuring the code coverage of your To Do application.
12.2. Measuring code coverage
Code coverage doesn’t determine code quality per se. It uncovers execution paths in your code that aren’t exercised by tests. A frequently discussed metric is the overall percentage of tests covering the production code. While achieving 100% code coverage is an honorable goal, it rarely pays off, nor can it give you the ultimate confidence that the logic is correct or bug-free. A good rule of thumb, though it shouldn’t be followed dogmatically, is to aim for 70 to 80% code coverage with meaningful assertions.
When I talk about code coverage metrics, what exactly do I mean? The following list should give you some basic coverage criteria:
- Branch coverage: Measures which of the possible execution paths (for example, in if/else branching logic) is executed by tests
- Statement coverage : Measures which statements in a code block have been executed
- Method coverage : Measures which of the methods were entered during test execution
- Complexity metrics: Measures cyclomatic complexity (the number of independent paths through a block of code) of packages, classes, and methods
Let’s look at available code coverage tools and their respective Gradle plugins.
12.2.1. Exploring code coverage tools
The Java ecosystem created several tools, free as well as commercial, for producing code coverage metrics. The feature set usually differs by performance to generate the metrics, the type of metric that can be produced, the coverage quality, and how these metrics are produced at runtime (called the instrumentation). Many of these tools originated as Ant tasks, which makes them easily wrapped by Gradle tasks in your build. A plugin abstraction is available for some of these tools. At the time of writing, none of these plugins have made it into the Gradle core code base. Table 12.1 gives an overview of some popular coverage tools and their support in Gradle.
Table 12.1. Popular code coverage tools for Java and Groovy projects
|
Name |
License |
Type of Instrumentation |
Gradle Support |
|---|---|---|---|
| Cobertura | Free | Offline bytecode instrumentation | https://github.com/eriwen/gradle-cobertura-plugin |
| Clover | Commercial, free for open source projects | Source code instrumentation | https://github.com/bmuschko/gradle-clover-plugin |
| Emma | Free | Offline bytecode instrumentation | No sophisticated plugin support; Ant tasks available |
| JaCoCo | Free | On-the-fly bytecode instrumentation | https://github.com/ajoberstar/gradle-jacoco |
Comparing code coverage tool features
With all these options, how do you pick the tool that’s right for you? First of all, you’ll want a tool that’s still maintained in case you need a bug to be fixed. With Clover, you have a good chance of getting support, because it’s a commercial tool that you pay for. Among the free tools, JaCoCo is the most active, whereas Emma and Cobertura haven’t been updated in years.
Two other compelling reasons for choosing a tool are the produced metrics and their quality. Usually, the coverage percentage doesn’t deviate very much among the tools (at a maximum by ~3–5%). What’s more important is the metrics feature set. Emma, for example, doesn’t produce any branch coverage. When comparing performance, JaCoCo is the clear winner. You can find an insightful comparison of these criteria on the SonarSource homepage (http://www.sonarsource.org/pick-your-code-coverage-tool-in-sonar-2-2/).
Understanding instrumentation methods
The method for producing code coverage metrics is different from tool to tool. The job of instrumentation is to inject instructions that are used to detect whether a particular code line or block is hit during test execution. Let’s look at the following scenario. You have a single class named ToDoItem that represents a To Do item:

For the ToDoItem class, you want to determine the test coverage. For that purpose, you create a unit test class named ToDoItemTest. The class defines a test method that verifies that the set priority of an item cannot be higher than the maximum priority:

If you generate code coverage for this class, you’ll see that all methods are covered, because you called all of them from your test class. The only line of code that isn’t covered is priority++. This is because your test method assumed an initial priority of 3 before you tried to increase the priority of the To Do item. To achieve 100% code coverage for the class ToDoItem, you’d have to write another test method that uses the initial priority.
As shown in table 12.1, this is achieved through source code, offline bytecode, or on-the-fly bytecode instrumentation. What’s the difference between these methods? Source code instrumentation adds instructions to the source code before compiling it to trace which part of the code has been executed. Offline bytecode instrumentation applies these instructions directly to the compiled bytecode. On-the-fly instrumentation adds these same instructions to the bytecode, but does this when it’s loaded by the JVM’s class loader.
While all of these methods do their job and the produced metrics don’t exhibit a huge difference, why does it matter which we choose? In the context of a continuous delivery pipeline, where bundling the deliverable is done after executing the code analysis phase, you want to make sure that the source or bytecode isn’t modified after the compilation process to avoid unexpected behavior in the target environment. Therefore, on-the-fly instrumentation should be preferred. In the next chapter, I’ll also demonstrate ways to avoid problems with other instrumentation methods.
In the following sections, you’ll learn how to use two plugins for generating code coverage: the JaCoCo and the Cobertura plugins. Let’s start with the JaCoCo plugin.
12.2.2. Using the JaCoCo plugin
JaCoCo (http://www.eclemma.org/jacoco/), short for Java Code Coverage, is an open source toolkit for measuring code coverage through on-the-fly bytecode instrumentation. To achieve this, JaCoCo attaches a Java agent to the JVM class loader, which collects execution information and writes it to a file. JaCoCo produces line and branch coverage metrics. Furthermore, it fully supports analyzing projects that are based on Java 7.
Separating different aspects of software functionality is a best practice. The same principle applies to build code. To separate your main build logic from code coverage logic, you’ll create a new build script named jacoco.gradle in the directory gradle on the root level of your project hierarchy. Later, you’ll add other Gradle build files to this directory. After creating the script, your project’s directory tree should look like this:

This script will serve as a container for declaring and configuring the JaCoCo plugin for your project. Remember when you added your own plugin to the classpath of the consuming build script in chapter 8? Here you do the same by assigning a repository and the plugin dependency. The following listing illustrates the basic setup.
Listing 12.1. Defining the JaCoCo plugin as script plugin

You can now easily apply the script plugin jacoco.gradle to other projects. In the context of your multiproject build, this is achieved by declaring a reference on it in the subprojects configuration block in the build script of the root project, as illustrated in the following listing. In addition to applying the script plugin, you’ll also need to tell the JaCoCo plugin where to retrieve its transitive dependencies. For now, you’ll settle on declaring Maven Central as the repository.
Listing 12.2. Applying the JaCoCo script plugin to all subprojects

Your project is prepared for generating code coverage reports with JaCoCo. When executing tasks of type Test, JaCoCo’s agent will collect runtime information based on the exercised test classes. Keep in mind that you won’t see any additional tasks that would indicate that code coverage data is created.
Give it a spin. Executing the full build will produce the execution data file with the extension exec in the directory build/jacoco of each subproject. The following directory tree shows the produced execution data files for the subproject repository:

JaCoCo execution data is stored in a binary, non-human-readable file. To be able to visualize the code coverage, you’ll need to generate an HTML report. The JaCoCo plugin automatically registers a report task per test source set for each subproject. In your repository project, these tasks are called jacocoTestReport and jacocoIntegrationTestReport. Figure 12.3 shows the HTML report for the test source set produced by the task jacocoTestReport.
Figure 12.3. Sample JaCoCo HTML report

Each method in the HTML report is clickable and brings you directly to a new page that marks the coverage line by line. A line marked in green indicates that it was exercised by tests, and a line marked in red means that it lacks test coverage.
With the default setup of the plugin, you’ll have one report for unit test coverage and one for integration test coverage. If you want to get a full picture of the project’s overall coverage across test source sets or even across all projects of a multiproject build, you can write a new task of type JaCoCoMerge. We won’t discuss this task further. For more details, please see the plugin’s documentation.
Many enterprises use the established code coverage tool Cobertura. To get an idea of how Cobertura’s report compares to the one produced by JaCoCo, you’ll configure Cobertura for your build.
12.2.3. Using the Cobertura plugin
Cobertura (http://cobertura.sourceforge.net/) is a Java code coverage tools that needs to instrument the bytecode after it’s compiled. A report produced by Cobertura contains the percentage of line and branch coverage, as well as the cyclomatic complexity for each package. Unlike JaCoCo, Cobertura doesn’t support projects based on Java 7.
You’ll prepare the same setup as you did for integrating the JaCoCo plugin. First, you’ll create a new script called cobertura.gradle, which applies and configures the Cobertura plugin. Then, you’ll apply the script plugin to all subprojects of your build. The following project structure shows the new script under the directory gradle:

The following listing shows the contents of the script plugin cobertura.gradle. You’ll retrieve the plugin from Maven Central and apply it by type.
Listing 12.3. Defining the Cobertura plugin as script plugin

Similar to the JaCoCo script plugin, you can now apply the Cobertura script plugin to all subprojects of your To Do application. The next listing shows the relevant code changes.
Listing 12.4. Applying the Cobertura script plugin to all subprojects

The plugin adds one task for inserting instrumentation instructions into the compiled class files and another for generating the code coverage report. These tasks are fully integrated into the build lifecycle of a Java project. A build that executes the verification task check will perform the necessary work to generate the code coverage. To do so, the plugin copies the class files from build/classes to build/cobertura, instruments the files, and serializes coverage information to a file named cobertura.ser. The resulting report is written to the directory build/reports/cobertura. The following directory tree shows the relevant files after executing the build:

The task testCoberturaReport is responsible for creating the code coverage report. By default, the task produces an HTML report but can also be reconfigured to create code coverage formatted as XML. Figure 12.4 shows a sample HTML report created for the unit tests of the repository project.
Figure 12.4. Sample Cobertura HTML report

We’ll stop at this point in our discussion of code coverage tools. Later in this chapter, you’ll reuse the reports you generated to track your code coverage quality over time with Sonar. JaCoCo and Cobertura are the most widely used open source coverage tools today. If you’re planning to use a different tool, please refer to the links provided in table 12.1. In the next section, we’ll explore various static code analysis tools.
12.3. Performing static code analysis
Members of the software development team perform code reviews to identify architectural problems, security defects, and potential bugs. While this kind of review is extremely helpful in mitigating the risk of technical debt, this process easily becomes expensive and unmanageable for large software projects.
How many of us have had to toil away at code reviews? Sure, they’re useful—you identify problems, security defects, and bugs—but it can easily get expensive and unwieldy. A cheap and automated way of finding issues in code is static code analysis. Static code analysis is the task of analyzing source code without actually executing the software to derive quality metrics. Metrics that can be extracted range from potential bugs and adherence to coding standards, to unnecessary code complexity and bad coding practices. Let’s look at a list of tools producing these metrics.
12.3.1. Exploring static code analysis tools
There are a lot of open source tools for identifying poor code quality. In this section, we’ll concentrate on the ones that are directly supported by Gradle through a standard plugin. Because they’re shipped with Gradle’s runtime distribution, it’s easy to integrate them into your build and make them part of the build pipeline. Table 12.2 shows these code analysis tools, the metrics they produce, and the name of the Gradle plugins for applying them to the build.
Table 12.2. Standard Gradle static code analysis plugins
|
Tool Name |
Gradle Plugin |
Report Formats |
Description |
|---|---|---|---|
| Checkstyle | checkstyle | Only XML | Enforces coding standards; discovers poor design problems, duplicated code, and bug patterns |
| PMD | pmd | XML and HTML | Finds unused, overly complex, and inefficient code |
| CodeNarc | codenarc | Text or XML or HTML | PMD equivalent for Groovy projects |
| FindBugs | findbugs | XML or HTML | Discovers potential bugs, performance issues, and bad coding practices |
| JDepend | jdepend | Text or XML | Measures design quality metrics like extensibility, reusability, and maintainability |
This list of plugins and their feature sets may look overwhelming at first. To be able to differentiate their metrics, you’ll apply and configure each of them to determine the code quality of your To Do application. In the next couple of sections, you’ll work your way from the top to the bottom of the table, with the exception of CodeNarc.
Preparing the subprojects
As you did with the code coverage tools, you’ll write a script plugin for each static code analysis tool to achieve a clean separation of concerns. Many of these Gradle plugins require a configuration file located in a directory config/<toolname> that defines the rules for the analysis. To be optimally prepared, you’ll create the directory config on the root level of your multiproject build and define a property that can be used in all subprojects:

The dependencies of each tool aren’t included in the Gradle distribution. At runtime, they’re automatically retrieved from a repository. You’ll configure Maven Central for that purpose. The following listing shows the changes you’ll need to make to the root project’s build script.
Listing 12.5. Preparing subprojects for the integration of static code analysis plugins

Generating HTML reports
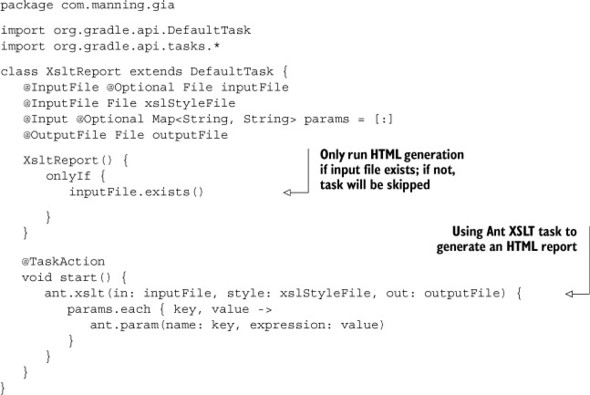
The default format for reports generated by these plugins is XML. While XML is a useful format for postprocessing the results from other tools like Sonar, it’s not convenient to read. An easier-to-consume format is HTML. Unfortunately, not all of the plugins you’ll use provide such a report output. However, you can easily produce them yourself via an XML-to-HTML transformation. For that purpose, you’ll create a reusable custom task in the buildSrc directory of your project that uses the Ant XSLT task, as show in the next listing.
Listing 12.6. Task for generating HTML reports via XSLT
You’re prepared for applying the static code analysis tools to your build. You’ll start by using the Checkstyle plugin.
12.3.2. Using the Checkstyle plugin
In enterprise projects, it’s helpful to introduce a coding standard to define how source code should be formatted, structured, and annotated to form a uniform picture. As a by-product, you’ll receive more readable and maintainable source code. This is where Checkstyle (http://checkstyle.sourceforge.net/) comes into play. The project started out as a tool for finding areas in your source code that don’t comply with your coding rules. Over time, the feature set was expanded to also check for design problems, duplicate code, and common bug patterns.
You’ll start by creating a new script file called checkstyle.gradle in the directory gradle. It’ll serve as your Checkstyle script plugin. In that script plugin, you’ll need to apply the standard Gradle Checkstyle plugin and configure the version of the tool you’d like to use and its runtime behavior. The following listing demonstrates how to use the Sun coding standards, defined by the rule set in the file config/sun_checks.xml, which is available from the Checkstyle distribution.
Listing 12.7. Applying and configuring the Checkstyle plugin as script plugin

With the basic Checkstyle definitions in place, you can apply the encapsulating script plugin to all subprojects of your multiproject build, as shown in the next listing.
Listing 12.8. Applying Checkstyle to all subprojects

Executing a full build will now produce the default Checkstyle XML report for all source sets of the project in the directory build/reports/checkstyle of each subproject. The following command-line output shows the relevant bits for the repository subproject:

Of course, the default report directory can be reconfigured to point to a custom directory. For more information on this and other configuration options, please see the DSL documentation of the Checkstyle plugin.
The Checkstyle plugin is one of the candidates that doesn’t currently provide the generation of HTML reports. Listing 12.9 shows how to create report tasks of type XsltReport for each of your source sets. By declaring a dependency on the default Checkstyle task, you can ensure that the HTML report task is executed after the initial XML Checkstyle report generation. You can add this code snippet directly to checkstyle.gradle as needed.
Listing 12.9. Generating a Checkstyle HTML report for all source sets

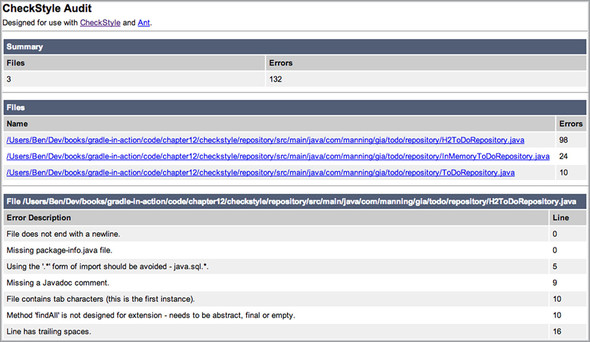
For the transformation from XML to HTML, you used an XSL file provided with the Checkstyle distribution. It generates a single HTML report with no frames. Executing the build with gradle build again will produce a report similar to figure 12.5.
Figure 12.5. Sample Checkstyle HTML report
12.3.3. Using the PMD plugin
PMD (http://pmd.sourceforge.net/) is similar to Checkstyle, though it exclusively focuses on coding problems like dead or duplicated code, overly complex code, and possible bugs. PMD’s distribution comes with a wide range of specialized rule sets—for example, JEE components, web frameworks like JSF, and mobile technologies such as Android.
You’ll take the same approach you took for setting up the Checkstyle plugin. First, you’ll create a script plugin named pmd.gradle that applies the PMD plugin. Then, you’ll configure it and apply it to all subprojects of your To Do application. The following listing demonstrates how to use the default version and rule set of PMD.
Listing 12.10. Applying and configuring the PMD plugin as script plugin

We won’t explore exactly how to apply the script plugin to your subprojects, because it looks very similar to the way you integrated the Checkstyle plugin. The PMD Gradle plugin generates an XML and HTML report out of the box, so you don’t need to do any extra work. The following command-line output shows how PMD metrics are produced for all source sets of the project repository:
$ gradle build ... :repository:pmdIntegrationTest :repository:pmdMain 3 PMD rule violations were found. See the report at:file:///Users/Ben/pmd/repository/build/reports/pmd/main.html :repository:pmdTest ...
The rendered HTML report in build/reports/pmd should look similar to figure 12.6.
Figure 12.6. Sample PMD HTML report

Sometimes you may just want to generate a single type of report. This need arises especially if you want to verify your progress during development. The PMD task can be configured to enable or disable particular types of report formats, as shown in the next listing. The same method can be applied to other code quality tasks where applicable.
Listing 12.11. Configuring the generated PMD report type

12.3.4. Using the FindBugs plugin
FindBugs (http://findbugs.sourceforge.net/) is a static code analysis tool for finding potential bugs and bad coding practices. The bugs identified include problems like equals/hashCode implementations, redundant null checks, and even performance issues. Unlike the other analyzers presented earlier, FindBugs operates on the Java bytecode, rather than the source code. You’ll find that operating on bytecode makes the analysis slower than source code analysis. For bigger projects, be prepared for it to take minutes.
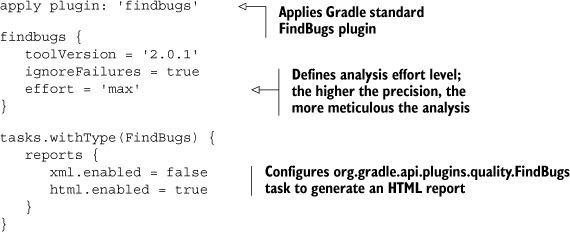
Listing 12.12 shows that the FindBugs plugin is as easy to integrate into your build as the other code quality plugins. For a good overview of the available configuration options, see the Gradle DSL guide. Currently, the plugin only supports the generation of an XML or HTML report.
Listing 12.12. Applying and configuring the FindBugs plugin as script plugin
Executing the full build on all subprojects will produce the expected reports for all available source sets. The following command-line output shows the representative tasks for the repository subproject:
$ gradle build ... :repository:findbugsIntegrationTest :repository:findbugsMain FindBugs rule violations were found. See the report at:
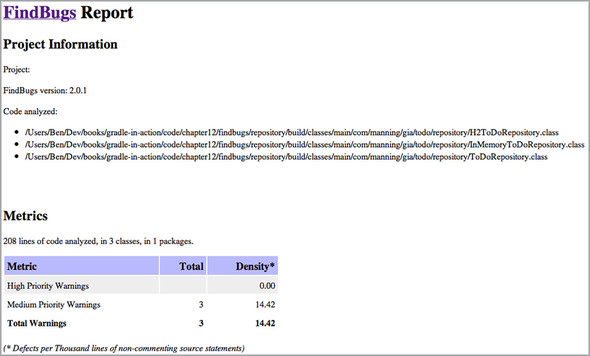
After executing the FindBugs tasks, you’ll find an HTML report for each source set in the directory build/reports/findbugs. Figure 12.7 illustrates the report for the main source set.
Figure 12.7. Sample FindBugs HTML report
12.3.5. Using the JDepend plugin
The static code analysis tool JDepend (http://clarkware.com/software/JDepend.html) produces metrics that measure the design quality of your code. It scans all packages of your Java code, counts the number of classes and interfaces, and determines their dependencies. This information will help you identify hot spots of unwanted or strong coupling.
Listing 12.13 shows how to apply and configure the standard Gradle JDepend plugin. You can choose a report that’s formatted either as XML or plain text. The default value is XML and doesn’t require any additional configuration. The listing also shows you how to easily switch between the report formats.
Listing 12.13. Applying and configuring the JDepend plugin as script plugin

After the code is applied to the subprojects configuration block, an XML report is generated for all source sets of a project. The following command-line output illustrates the executed JDepend tasks required to produce the reports:
$ gradle build
...
:repository:jdependIntegrationTest
:repository:jdependMain
:repository:jdependTest
...
Unfortunately, you can’t generate an HTML report out of the box, but you can use the custom XSTL task introduced in section 12.3.1 to produce the desired result. An XSL file is available through the JDepend distribution. You can find an example in the source code of the book. After executing the HTML report generation, your build/reports/jdepend directory will contain at least one file that renders similarly to figure 12.8.
Figure 12.8. Sample JDepend HTML report

Another great feature of JDepend is the ability to visualize the dependencies between packages as a graph. Part of the JDepend distribution is an XSL style sheet file that transforms an XML report into a Graphviz DOT file. You’ll find a full-fledged example in the source code of the book.
12.4. Integrating with Sonar
You’ve seen how to generate code metrics for your project using different code analysis tools. Each of these tools produces reports that need to be checked individually. With every build, the existing report is potentially deleted and a new one is created, so you have no idea whether the code quality has improved or decayed over time. What you need is a centralized tool that monitors, visualizes, and aggregates your metrics. A tool that provides this functionality is Sonar (http://www.sonarsource.org/).
Sonar is an open source, web-based platform for managing and monitoring code quality metrics like coding rules compliance, unit tests and their coverage, and source code documentation, as well as architectural aspects like maintainability and technical debt. It integrates well with most of the tools we discussed earlier, including JaCoCo, Checkstyle, and PMD. If the need arises to support an unconventional tool or language, Sonar can be extended by plugins.
Sonar uses a central database to collect code quality metrics over time. In its default configuration, Sonar comes with an embedded H2 instance, which doesn’t require any additional setup. While H2 is a great way to get started and explore Sonar’s functionality, it’s recommended to configure a more scalable solution for a production setting like MySQL or Oracle. Gradle integrates well with Sonar through its Sonar Runner plugin. The Sonar Runner is a launcher that analyzes your project and pushes the gathered metrics to the Sonar database via JDBC. You can directly open your project’s dashboard and view aggregated quality metrics over time. Figure 12.9 shows the interaction between Gradle and Sonar.
Figure 12.9. Gradle’s interaction with Sonar

As the figure shows, Sonar can be fed metrics from the outside. The rule set for these metrics is defined in quality profiles. A quality profile, which is directly configured on Sonar, defines the code analysis tools you’d like to run on your source code and their acceptance criteria. For example, you could say, “A class must have a documented API greater than 70%.”
This means that Sonar not only gives you the option to apply specific metric rule sets and thresholds per project, but also allows you to decide whether you want to use the analysis tools provided by Sonar to generate metrics. Let’s take the default, preconfigured quality profile called Sonar way, for example. It automatically analyzes your project through Checkstyle and PMD with 119 rules without having to configure the standard Gradle plugins.
Earlier, you configured your build to produce metrics through Gradle’s static code analysis plugins. You might ask yourself if you can configure the Sonar Runner plugin to reuse these reports. At the time of writing, Sonar doesn’t provide a mechanism to publish these reports to Sonar’s database. Instead, you’ll need to rely on the embedded Checkstyle, PMD, and FindBugs plugins that are configured by a quality profile. The only exception to this rule is code coverage metrics. You can find a discussion of this topic later in this chapter.
12.4.1. Installing and running Sonar
Installing Sonar is straightforward. Go to Sonar’s homepage, download the latest version (at the time of writing this is 3.5), and extract the ZIP file anywhere in your local file system. Depending on your operating system, you can start up the Sonar web server through the provided startup scripts in the directory $SONARHOME/bin. Let’s assume you want to start Sonar on a Mac OS X 64-bit machine. From the command line, navigate to the dedicated bin directory and start up the server:
$ cd $SONARHOME/bin/macosx-universal-64
$ ./sonar.sh start
Starting sonar...
Started sonar.
Starting up Sonar for the first time takes about 30 seconds. You can check on the startup progress in the log file <SONARHOME>/logs/sonar.log. After successfully bringing up Sonar, the dashboard can be opened in the browser under the URL http://localhost:9000, as shown in figure 12.10.
Figure 12.10. Central Sonar dashboard

In the upper-right corner of the screenshot, you’ll see a panel named Projects. Because you didn’t publish any metrics for a project, the list doesn’t contain any data. Next, you’ll change that by configuring your Gradle build to use the Sonar Runner plugin.
12.4.2. Analyzing a project with Sonar Runner
The Sonar Runner plugin is the recommended way of analyzing source code in a single-project or multiproject build. The plugin is fully compatible with Sonar version ≥ 3.4 and only requires minimal setup if you stick to the default Sonar configuration.
If you need to support an already existing Sonar instance with a version before 3.4, you’ll need to rely on the standard Gradle Sonar plugin. Because this chapter will only discuss the Sonar Runner plugin, I’ll refer you to the Gradle documentation for more information: http://www.gradle.org/sonar_plugin.
Listing 12.14 shows the relevant changes to your build from using Sonar Runner. It applies the plugin to the root project of your build and configures basic properties like the project’s name and description, as well as the source code encoding for all subprojects. If you don’t set the properties sonar.projectName and sonar.projectDescription, this information is derived from the Gradle project properties name and description.
Listing 12.14. Applying and configuring the Sonar Runner plugin

This is all you need to get started with Sonar. Analyze your project using the default quality profile and publish the reports to the Sonar database. You can initiate this process by executing the task named sonarRunner provided by the plugin:
$ gradle sonarRunner ... :sonarRunner 07:01:25.468 INFO .s.b.b.BatchSettings - Load batch settings 07:01:25.572 INFO o.s.h.c.FileCache - User cache:
A lot of information is rendered. It gives you sufficient insight into which projects and directories have been analyzed and what code quality tools have been used. If you refresh the Sonar dashboard after executing the task, you’ll find your project named todo, with some basic information like lines of code, a percentage of rules compliance, and the last date of analysis. Clicking on the project name will bring you to a more detailed view of the project’s metrics, as shown in figure 12.11.
Figure 12.11. Sonar project dashboard

The project dashboard gives you an informative, condensed summary of metrics like code complexity, rules violations, and code coverage. You can drill into each of these metrics even further by clicking on them.
The plugin lets you set properties to change every aspect of your Sonar configuration. One set of properties is dedicated to pointing to a different database to host your Sonar metrics. I’ll leave it up to you to work with the plugin documentation to make this happen in your environment. Another set of properties I want to discuss, though, is directly relevant to your project. To let Sonar take into account your integration test source set, you’ll have to tell Sonar about it. The following listing demonstrates how to add the source set directory to the appropriate Sonar property.
Listing 12.15. Adding custom source sets for analysis

12.4.3. Publishing code coverage metrics to Sonar
If you took a deeper look at the Sonar dashboard, you may notice that the Sonar unit test coverage widget shown in figure 12.12 reports a 100% success rate for unit tests, but the code coverage rate is noted as 0%. Code coverage is an extremely helpful metric to have in the Sonar dashboard. If available, you can directly walk through each class and see a visual representation of coverage metrics.
Figure 12.12. Unit test coverage widget in Sonar

Earlier in this chapter, we discussed how to generate code coverage reports with JaCoCo and Cobertura. You can reuse these coverage reports by feeding them through the Sonar Runner plugin. Sonar supports this functionality for coverage reports that comply with the JUnit XML format generated by the tools JaCoCo, Emma, Cobertura, and Clover. All you need to do is to add some configuration to the Sonar Runner plugin configuration. You’ll start with integrating the JaCoCo report.
Reusing the JaCoCo report
JaCoCo is supported as the default code coverage tool in Sonar. The only thing you need to do is tell Sonar Runner where to find the JaCoCo report files. Sonar requires you to provide two properties for setting the path of the report files: one for unit tests (sonar.jacoco.reportPath), and another for integration tests (sonar.jacoco.itReportPath). Thankfully, you don’t have to set these properties manually. The JaCoCo plugin preconfigures the Sonar Runner for you. You’ll find that the command-line output of Sonar Runner will register the analyzed JaCoCo report files:
$ gradle build sonarRunner ... 07:28:20.300 INFO o.s.p.j.JaCoCoPlugin - Analysing /Users/Ben/sonar-
Now that the additional data has been sent to Sonar, you can refresh the project dashboard page and see the correct reporting on code coverage in the unit test coverage widget. To get insight into the integration test coverage, you need to add the integration test widget to your dashboard. Figure 12.13 shows both code coverage widgets side by side.
Figure 12.13. Populated unit and integration test code coverage widgets in Sonar

At the time of writing, Sonar doesn’t provide a dedicated widget for functional test coverage. To work around this shortcoming, you could register your functional code coverage as integration test coverage. To complete our discussion of reusing code coverage metrics, we’ll also look at the configuration for integrating Cobertura reports into Sonar.
Reusing the Cobertura report
When you initially generated code coverage reports with Cobertura, you chose to format them as HTML. Sonar can only process XML-formatted report files, so you’ll need to reconfigure the Cobertura plugin. In the cobertura.gradle file, set the following extension property:
cobertura {
   format = 'xml'
}
To tell Sonar Runner to reuse a different coverage processing mechanism, you’ll need to set a new property: sonar.core.codeCoveragePlugin. Keep in mind that you’ll only need to provide this property if you wish to reuse reports produced by a tool other than JaCoCo. In addition to this property, you’ll also need to point Sonar Runner to the Cobertura report files. The following listing demonstrates how to reuse the Cobertura unit test report.
Listing 12.16. Configuring Sonar Runner plugin to reuse Cobertura reports

The task sonarRunner will give you concrete information about the parsed report files:
$ gradle build sonarRunner ... 12:10:42.895 INFO p.PhasesTimeProfiler - Sensor CoberturaSensor... 12:10:42.896 INFO .p.c.CoberturaSensor - parsing /Users/Ben/sonar-
Integrating other third-party coverage reports produced by tools like Emma or Clover follows the same pattern. The key is to look up the required property from the Sonar online documentation.
12.5. Summary
Poor code quality and technical debt inevitably lead to developer productivity losses, missed deadlines, and a higher bug rate. In addition to design and code reviews through peers, it’s important to introduce coding standards and start monitoring your project’s code quality with the help of static code analysis tools in the early stages of your product. The Java ecosystem offers many open source tooling options to produce code quality metrics. Gradle simplifies the integration of many of these tools into the build process by providing standard or third-party plugins.
Code coverage measures the percentage of code that’s exercised by tests and reveals obvious areas that aren’t covered by tests. A high code coverage rate significantly improves your ability to refactor, maintain, and enhance your code base. We looked at how to apply and configure two code coverage plugins: JaCoCo and Cobertura. While both tools do their jobs in generating adequate coverage reports, JaCoCo shines through better flexibility, performance, and developer support.
Static code analysis tools help you enforce coding standards and uncover bad coding practices and potential bugs. Gradle offers a wide range of standard plugins for you to pick and choose from. We discussed how to apply, configure, and execute these plugins in a reusable way.
Tracking, evaluating, and improving code quality over time can be achieved with Sonar. Sonar provides a set of static code analysis tools out of the box and defines quality rules and thresholds on a central platform. Sonar should be the preferred solution if you have to manage more than one project and need a central place for aggregating quality metrics. You saw that integrating Sonar into a build process required minimal effort.
In the next chapter, we’ll discuss how to install and configure a continuous integration server that automatically builds your project whenever a code change is pushed to the VCS.