Chapter 14
Advanced Topics: Taking It All a Little Further
This book has covered quite a bit, from basic HTML5 elements through how to animate and interact with those elements, to even determining your location. This last chapter covers a few topics to put a bit of icing on the cake.
This chapter features three distinct sections. First is a treatise on JavaScript. JavaScript has been shown throughout the book, but here it is covered generally as a subject of its own, and not about interaction with HTML5 elements.
Next is a section on math (no, it’s not boring and there is no test!). In particular, geometry and a bit of (shudder) trigonometry are reviewed. Why cover math in a book like this? Because shapes and animation are often based on a handful of principles and functions of these mathematical areas. Right off the bat, any rectangle or oval, by its very nature, is a product of some aspect of geometry (think back to what you’ve learned about angles and such). Trigonometry functions often serve as the basis for animation. Therefore. the coverage of these specialties is really focused on how they come into play in creating visual elements on the HTML5 canvas.
Finally, the third section of this chapter offers a bit of a surprise. So far, all of the examples of the canvas have been two-dimensional. The canvas is a two-dimensional platform. Or is that really so? A technique known as parallax processing (not to be confused with parallel processing) allows the impression of three-dimensional visuals put on the canvas.
JavaScript
JavaScript’s early usage was mostly to validate form entries or do a few tricks on the screen, but that is just what they were considered: tricks and cutesy “ooh-aahs.”
As web development in general got more sophisticated, so did JavaScript, or more to the point, its purpose and place in the scheme of web site interaction. Numerous JavaScript frameworks (libraries) became popular, among them Prototype, Scriptaculous, Dojo, MooTools, Yahoo User Interface (YUI), and the 800-pound gorilla: jQuery. Many web developers have come to rely on such frameworks, and that’s a good thing, since they offer much help and make scripting easier.
Still, it’s a subjective necessity to know how to deal with raw JavaScript. The coverage here focuses on a few main areas that are common to any programming language: loops, conditional tests, and reusable code. These are shown here without the use of a framework.
Looping
Looping serves to iterate over items and count to a certain value, and also has quite a number of other uses—essentially for any situation in which repetition is needed. The two main looping methods are the for loop and the while loop.
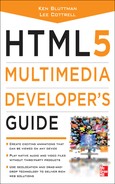
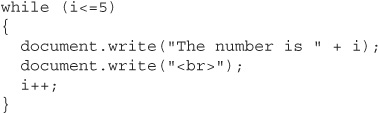
A for loop works by setting an initial value to start counting from, a number at which to stop counting, and the value by which to increment the counter (usually by one, making a sequential loop). Here is a code block of a for loop:
Using a lowercase i as the variable in a loop is just an accepted practice. The variable name can be anything that doesn’t violate JavaScript naming rules. You might find it easier to give your variables more meaningful names.
The for statement encloses, in parentheses, the three pieces needed to make the loop work:
![]() A variable, i in this example, is initialized to 0. Consider i to be the counter.
A variable, i in this example, is initialized to 0. Consider i to be the counter.
![]() Next, the statement indicates to keep looping as long as i is less than or equal to 5.
Next, the statement indicates to keep looping as long as i is less than or equal to 5.
![]() Finally, the statement indicates how to increase i—in this case, by 1, represented by i++. (The two plus signs are a shortcut to count up by 1.) Incrementing the counter is vital to the loop completing. If i were not incremented, it would stay equal to 0 and the loop would never end, which, in practical terms, would appear as though your computer had gone haywire.
Finally, the statement indicates how to increase i—in this case, by 1, represented by i++. (The two plus signs are a shortcut to count up by 1.) Incrementing the counter is vital to the loop completing. If i were not incremented, it would stay equal to 0 and the loop would never end, which, in practical terms, would appear as though your computer had gone haywire.
The full code block starts with the for statement and then uses a set of curly braces to show what happens while the loop is running. The ending curly brace is the end of the loop structure.
In the example, the code block simply writes out “The number is 1,” “The number is 2,” and so on. Note that since the for statement was set up to run to 5 (less than or equal to 5), the final output does indeed say “The number is 5.”
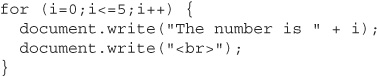
The part of the for statement that sets the increment can just as well set the counter to decrement. The statement could look like this:
Note the reversal of the items in the for statement. The counter, i, starts with a value of 5. The loop runs as long as i is greater than or equal to 0, and with each iteration of the loop, the counter is lowered by 1, using the i-- operator. Just as using two plus signs (++) is a shortcut to count up by 1, using two negative signs, or dashes (--), is a shortcut to count down by 1.
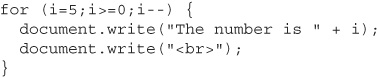
Code Listing 14-1 puts the two for loops together. Between them is an HTML line break to separate them in appearance.
Code Listing 14-1 Looping with the for statement
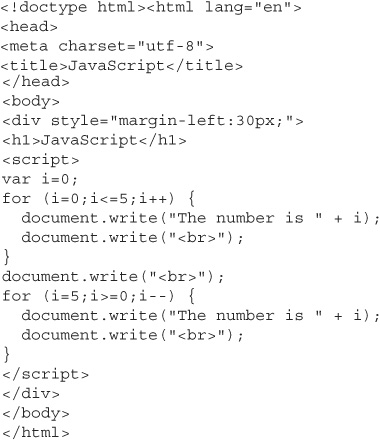
Figure 14-1 shows the output of the code in Code Listing 14-1.
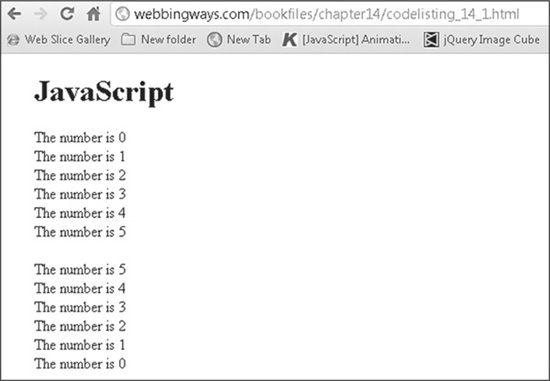
Figure 14-1 Output of the JavaScript for loop
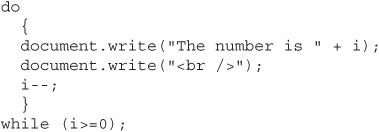
JavaScript also has the while and do…while loops. These are quite similar, but have a distinct difference: a while loop tests the counter at the start of the loop, and a do…while loop tests at the end of the loop. The most discernable difference is that using do…while guarantees at least one pass through the loop, since the test is at the end of the loop. Code Listing 14-2 shows a while loop followed by a do…while loop.
Code Listing 14-2 Looping with the while statements
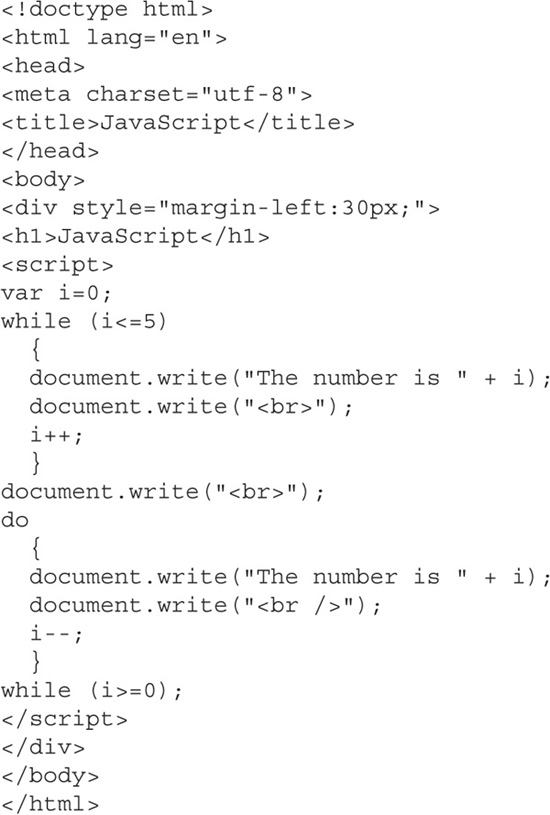
Figure 14-2 shows the output of the code in Code Listing 14-2.
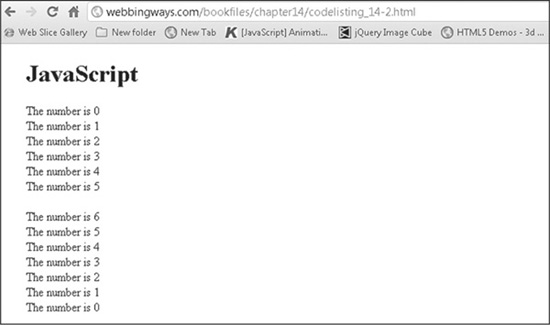
Figure 14-2 Output of looping with while statements
The output shown in Figure 14-2 demonstrates a pertinent point of following the value of a variable. The variable i begins initialized to 0. The while loop increments i until it is equal to 6. Even though the output from the while statement shows counting up to 5, looking at the code, you can see that the block of the while statement runs when i equals 5, and within the block, i is incremented to 6. It doesn’t appear from this loop as 6 because at the start of the loop, the test is to see if it is less than or equal to 5. It isn’t; it’s equal to 6.
The second loop, the do…while loop, starts by showing an output of i equals 6 because the write statement occurs before the test. In this loop, the test is at the end of the loop structure. The test is to see if i is greater than or equal to 0, which is true.
Conditional Branching
JavaScript has two mainstay conditional test structures: the if statement and the switch statement. In both statements, a test is performed and an action is taken (a branch) based on the results of the test. Here is an example of a simple if test:
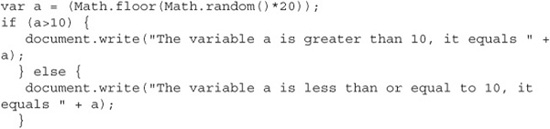
The variable a is assigned a random number between 0 and 20. Sometimes it is greater than 10, and sometimes it is equal to or less than 10. The appropriate message is written depending on what a is.
The if structure can be enhanced to test more than two outcomes by using else if, which allows multiple tests. This structure shows how the testing now takes into account if a is greater than 10, if a is equal to 10, or if a is less than 10:
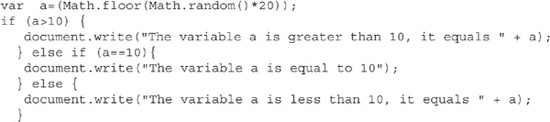
The inclusion of else if in the middle of the code block allows the block to be extended to include an additional test.
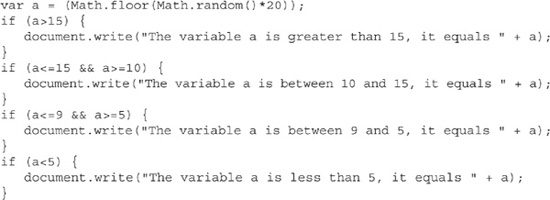
Another way to use if statements is to just have a number of them follow each other. Each is a separate block; however, the inclusion of more than one allows multiple testing, as follows:
TIP
In a test structure such as if (a<=9 && a>=5), the double ampersands represent the operator for the logical AND. Similarly, two pipe characters (||) form the operator for the logical OR.
The switch statement is another way of implementing multiple tests, which is more efficient than using multiple if statements. Here is an example:
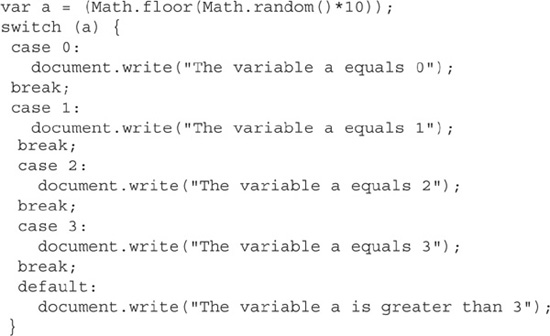
The switch statement, sometimes referred to as the switch…case statement, presents numerous tests within one large code block. The construct starts with the variable being tested placed directly after the switch statement, in parentheses, followed by an opening curly brace:
![]()
The tests follow. Each begins with the case keyword, the value that is being tested for, and then a colon. Following that, you put in any code needed to run when the condition is true. Then the break statement ends the block of code that runs if the test is true. A final default catch is put in, to use if none of the other tests were true. The entire switch construct ends with a closing curly brace.
Code Listing 14-3 demonstrates the various conditional tests and branching.
Code Listing 14-3 A combination of conditional tests and branching
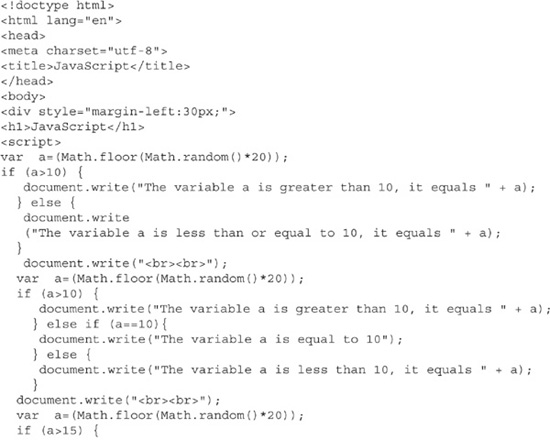
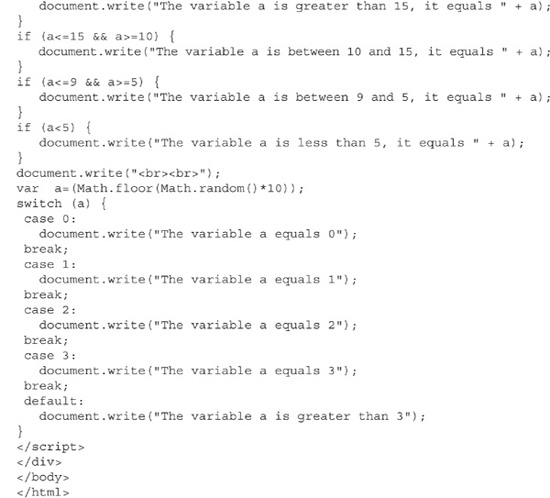
Figure 14-3 shows the output of the various tests shown in Code Listing 14-3.
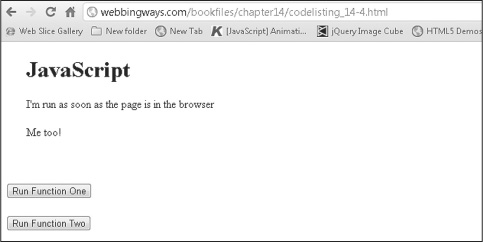
Figure 14-3 Tests and branching output
Functions
When a web page is rendered, any JavaScript not in a function is run. JavaScript that is in a function runs only when some event calls the function.
Code Listing 14-4 contains JavaScript code both in and out of functions.
Code Listing 14-4 JavaScript functions
Figure 14-4 shows how the page initially appears in the browser. The lines of text are from the document.write() method calls that are at the beginning of the script section, but not inside a function.
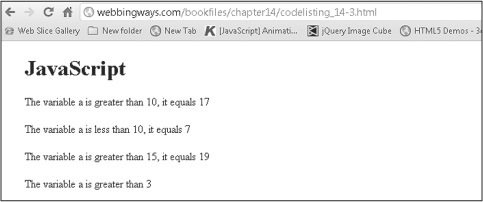
Figure 14-4 JavaScript not in a function runs immediately.
TIP
Running Code Listing 14-4 may be surprising. When you click a button, the entire page is replaced with what is found in the document.write statement. That’s a side effect of the point of the lesson: how functions don’t run upon loading.
Functions can take arguments—values sent to the function, for the purpose of the function doing something with the passed value(s). Not all functions need arguments, so passing data to a function depends on the type of function. Code Listing 14-4 includes two functions. The first has no arguments, and the second has an argument (a number) passed to it. When the second function is run, it displays the number, as shown in Figure 14-5.
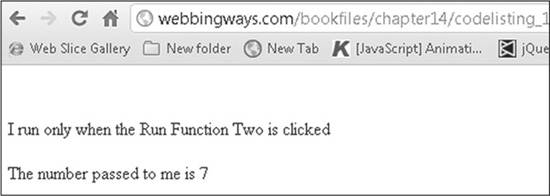
Figure 14-5 A JavaScript function displays its passed-in argument.
Math Made Visible
Lines, shapes, movement, and animation—we often look at these visual entities and think someone drew this, or used Photoshop to make that, or … what? The fact is whatever method is behind making any visual element, except those that are utterly freehand (illustrating, for example), has some basis of math working in the wings.
Geometry is the area of focus behind visual creation. Pick up a text on geometry, and you’ll see a discussion of lines, circles, angles, triangles, and so on. The material here is not meant to reproduce the information you can learn from mathematical-based material; rather, it’s intended to show some of the geometric items involved in computer-based art, such as the images that appear on the canvas.
Trigonometry, calculus, and other mathematical subjects also can be turned into visual representations. It’s rather fascinating, or boring, or above your head, or under your feet. Perhaps you don’t know a circle from an oval, or know the fine distinction of what makes an isosceles triangle, well, an isosceles triangle.
Let’s consider lines first. Any two lines that touch form an angle. Nearly everyone is familiar with the 90-degree angle, as in the letter L. Another type of angle—the acute—is one in which the two lines make an angle that is less than 90 degrees; that is, the lines are closer in the same direction. To give a sense of perspective, a 0-degree angle is like a single line.
So what can be done with acute angles? A popular effect is that of a flock of birds in the distance. As a bird’s wings flap, most of the wing movement is in the acute. Figure 14-6 shows a scene of a flock of birds in the distance, flying over a hill. The hill is created using the sine wave function of JavaScript, as discussed shortly. Code Listing 14-5 shows the coding to make the randomly placed acute angles and hill.
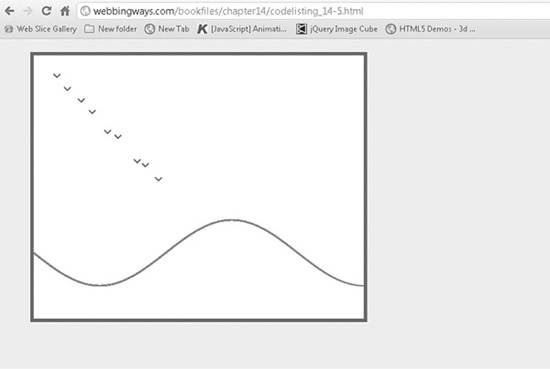
Figure 14-6 Angles and a sine wave simulate nature.
Code Listing 14-5 Geometry makes nature
Of note in Code Listing 14-5 are the two snippets used for the birds and the hill. Here, the birds are displayed as pairs of lines, assembled within a loop, with some randomness thrown in to have the birds appear in flight in loose formation. The loop uses the variable a as the counter. Within each iteration, it uses other variables—b, c, and d—to add randomness to the line placement and length. Not much randomness is used; it’s just enough to give a visual impression of birds a bit closer and farther when viewed as a flock (a little imagination helps!).
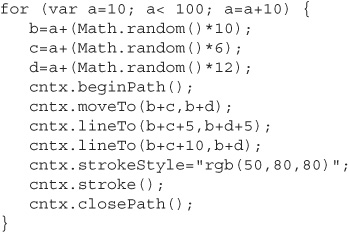
In any rendering of a set of lines creating an angle from this code, the angle is acute. None of the angles representing the birds is at or near 90 degrees.
The hill is created with the drawing of a sine wave. The loop counts up to 500, as this is the width of the canvas. Other values affect the curve by setting how wide it is (a value of 400 makes it barely longer than a single cycle), how tall the cycle is (value of 50), and the placement toward the bottom of the canvas (value of 300).
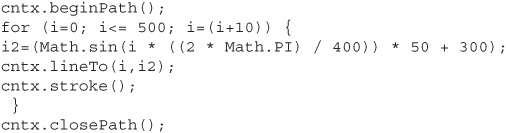
Code Listing 14-6 shows a mini-application in which variations of the frequency of the sine (or cosine) wave is adjustable, as well as the amplitude (height).
Code Listing 14-6 Sine and cosine frequency and amplitude

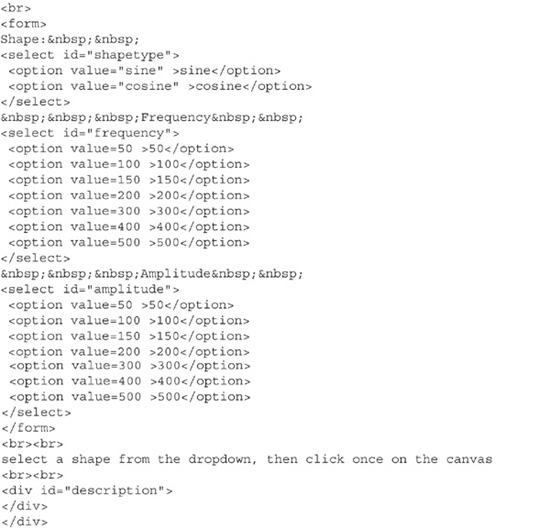
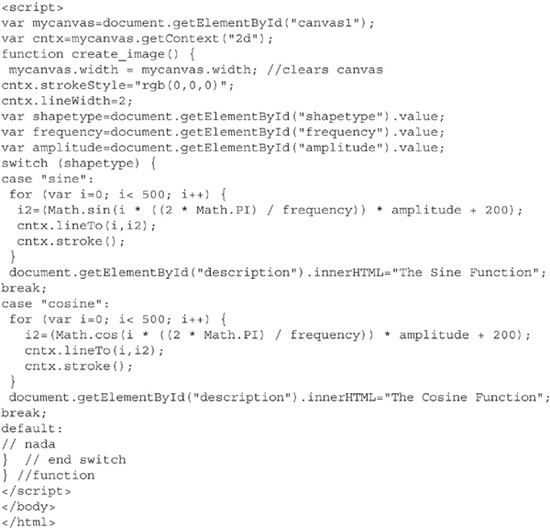
The sine and cosine methods produce the same results, other than they are out of phase with each other. Getting into the finer details of trigonometric functions is not the focus here. The cosine is included simply to point out that JavaScript supports all the standard trigonometry functions (even though they aren’t all used in this example). Figure 14-7 shows how Code Listing 14-6 appears in a web browser. It is available to try out at www.webbingways.com or www.mhprofessional.com/computingdownload.
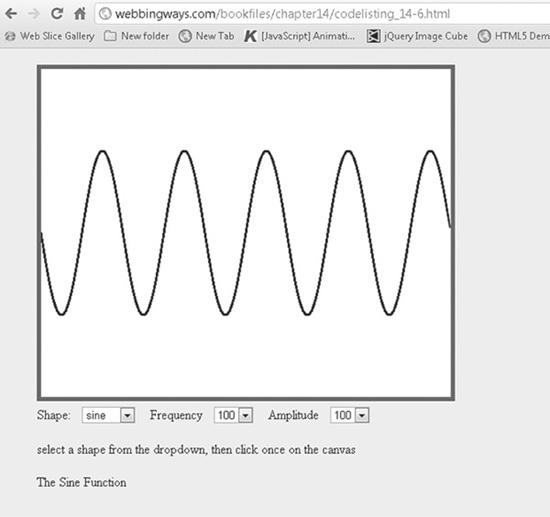
Figure 14-7 Testing variations of the sine and cosine functions
With a little creative ingenuity (and some JavaScript, of course), you can achieve some interesting visuals. Figure 14-8 shows how a handful of sine waves combined together can make a complex image (unfortunately, the sine wave colors don't show in the printed book). Code Listing 14-7 shows the code used to produce the image in Figure 14-8.
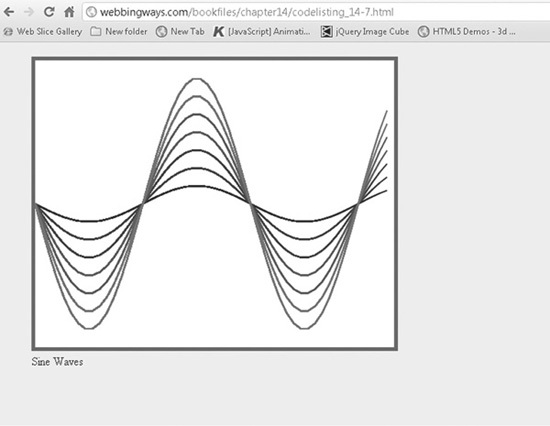
Figure 14-8 Stacked sine waves
Code Listing 14-7 Sine waves of varying height and color
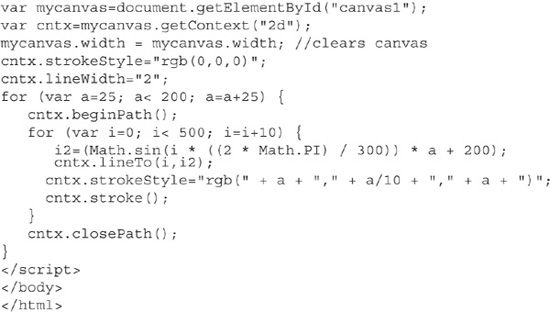
Not to leave geometry out of the mix, Figure 14-9 shows an assembled matrix of right triangles. The right-angle construction here ends by coloring in two triangles for an artistic effect. Code Listing 14-8 shows the code used to create the overall visual shown in the figure.
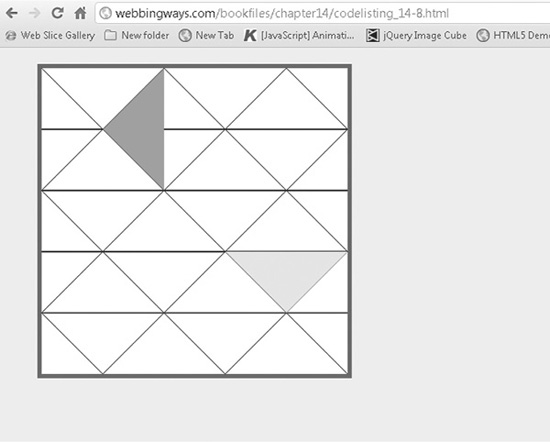
Figure 14-9 A canvas full of right angles
Code Listing 14-8 Right triangles patterned to perfectly fit the canvas
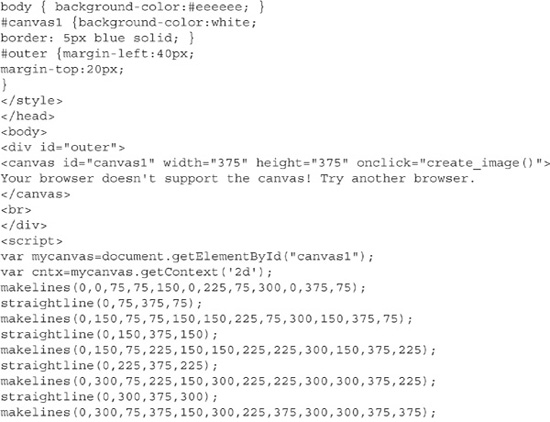
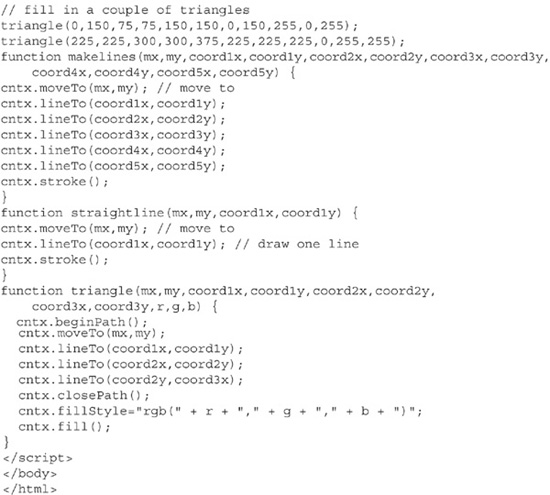
The main part of the code makes use of functions to manage the repetitive drawing. Two functions, makelines and straightline, are used.
The makelines function takes 6 sets of double arguments (12 arguments all together), with each set setting a marking point. The first two arguments set where the moveTo method places the “pen,” and the next five sets are used in lineTo methods to draw. You might be wondering why five lines are drawn to create a triangle, which has three lines. That’s a good observation. The five lines draw triangular shapes (more than one triangle) across the width of the canvas. Each makelines function call is followed by a straightline function call, which simply draws a straight, horizontal line underneath the sequence of triangles just drawn by the makelines function.
![]()
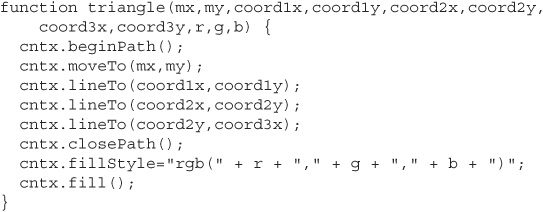
Finally, a third function, triangle, is called. The passed arguments indicate which triangle to draw over again. However, this time, the single triangle is closed up by using the beginPath and closePath methods. Also, three arguments are used for the red, green, and blue values for the rgb function, which sets the color that the triangle will be filled with.
Closing out this treatise on geometry and trigonometry is one more mini-application. This one provides a drop-down list of various angles, triangles, arcs, and trig functions from which to select. Once you select a shape, a click on the canvas shows the shape, along with a brief description underneath, as shown in Figure 14-10. Code Listing 14-9 shows how the canvas and functionality it uses run.
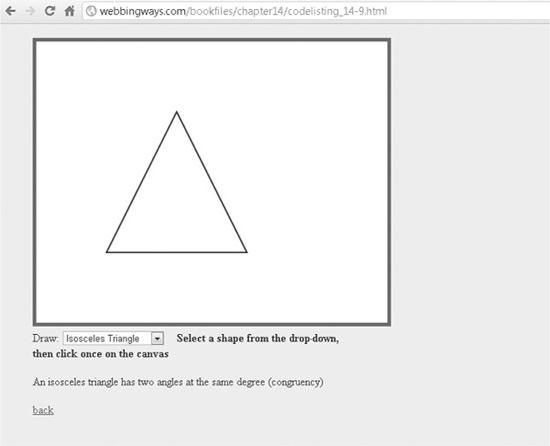
Figure 14-10 A review of angles, triangles, and other shapes
Code Listing 14-9 A selection of angles and other geometric and trigonometric functions
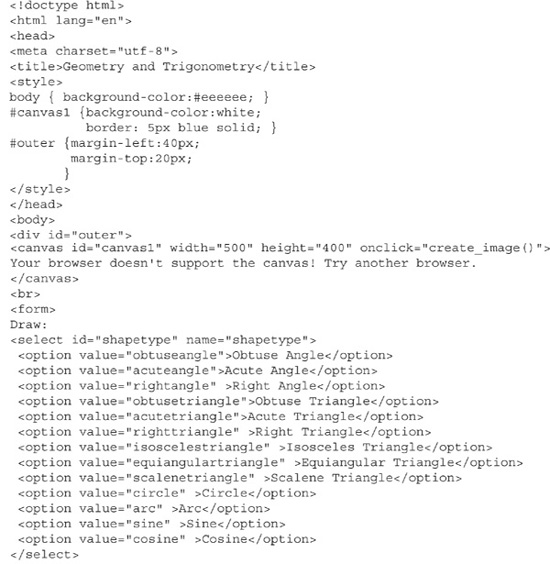
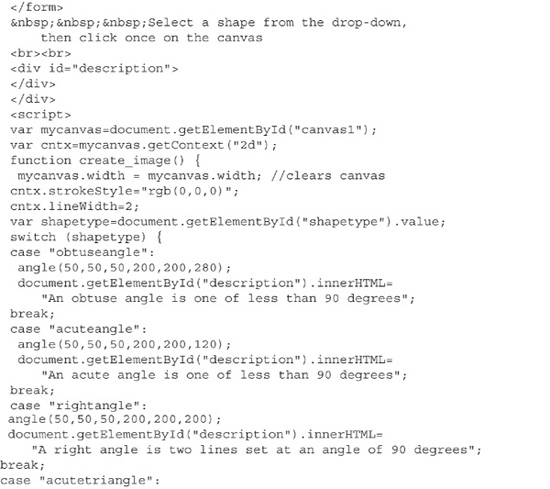
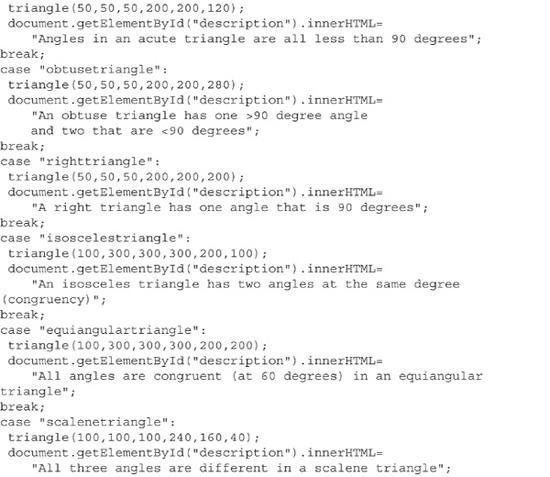
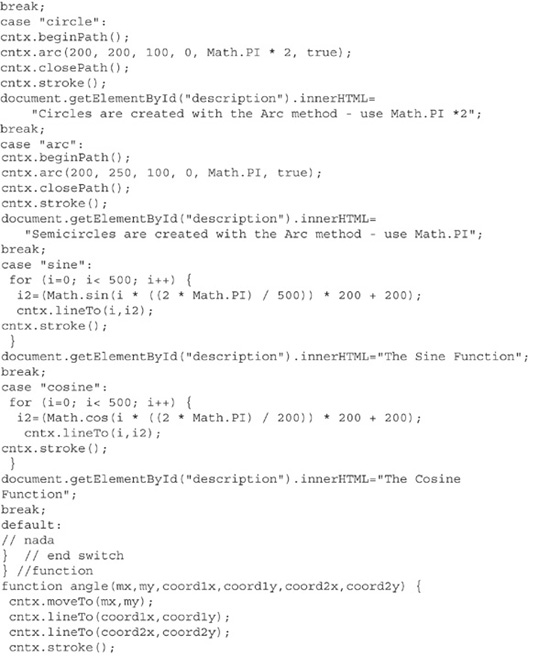
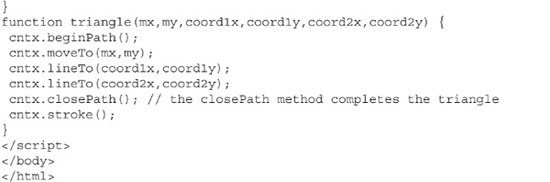
Code Listing 14-9 contains the basic snippets of code to create the shapes provided in the drop-down box. A switch statement is used throughout to tap the correct code block based on the drop-down selection. For example, here is the piece of the switch statement for the obtuse triangle:
Within this snippet, a custom function, triangle, is called.
Parallax Processing
The canvas is a two-dimensional, on-screen drawing tablet. No matter how fancy the examples throughout the book have seemed—be it drawing, shape manipulation, or animation— everything has been two-dimensional. It’s time to take the canvas to the next level, or rather, the next dimension. Enter 3D.
TIP
One dictionary listing (from www.dictionary.com) for parallax is “The apparent displacement of an observed object due to a change in the position of the observer.” Here, something similar is achieved. You, the observer, are not changing positions. However, in the canvas, objects are apparently displacing themselves from each other.
The basis behind this technique is movement. To be more precise, it’s a matter of the movement of objects relative to where they are being observed. Something close to us—say a cat running across the room—appears to move fast. In the sky, clouds appear to move more slowly. With an objective measure of speed, the clouds are moving much faster than the cat, but the distance of the clouds makes their movement appear slower. That is the principle applied here to the canvas.
Figure 14-11 shows a scene with trees in the back and rocks up front. When you press the left or right arrow key, the trees and rocks move appropriately toward the left or right. However—and this is the key point—the trees move slower than the rocks. The result is the rocks seem closer and the trees appear farther away. Essentially, it’s a 3D visual experience.
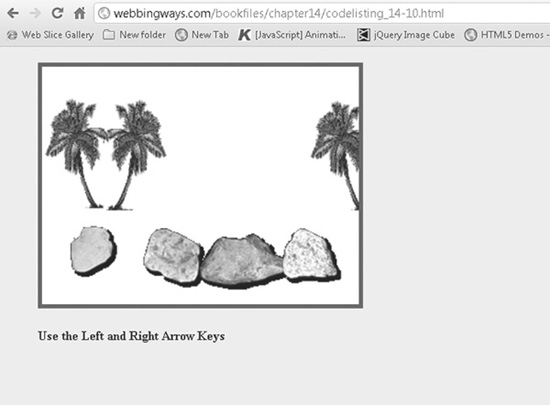
Figure 14-11 Nearby rocks and farther away trees
You do need to see this in action to appreciate the effect. Visit www.webbingways.com or www.mhprofessional.com/computingdownload and try it out for yourself.
How is this done? First, images are needed, and they must be sized in a certain way. The canvas is sized to 400 pixels wide by 300 pixels high. While an arrow key is pressed, a graphic of trees and a graphic of rocks are effectively scrolled. Thus, these graphics must be larger than the canvas. The movement is horizontal. Therefore, the graphics must be wider than the canvas, while the graphics stay at the same 300-pixel height. Figure 14-12 shows the two graphics seen as assembled in a graphics program.
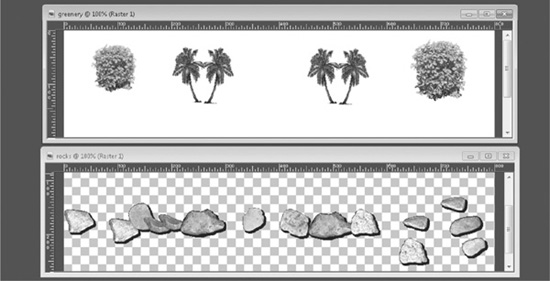
Figure 14-12 Rocks and greenery graphics
The rocks and greenery graphics are sized at 800 pixels wide—twice that of the canvas on which they are displayed. The code running the moving effect shows a slice of the overall graphic at any one time. Code Listing 14-10 shows the full set of functions behind the moving effect.
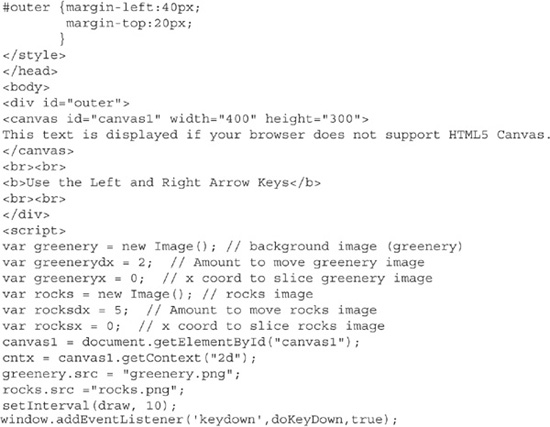
Code Listing 14-10 How parallax processing is coded
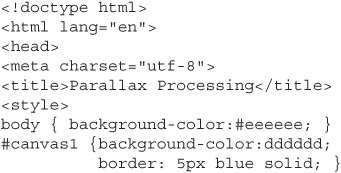
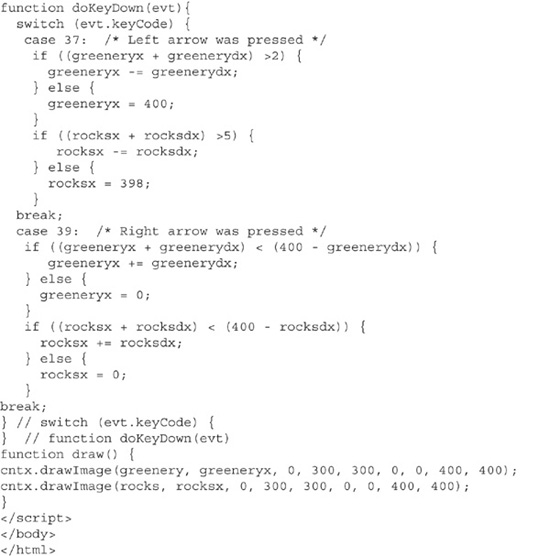
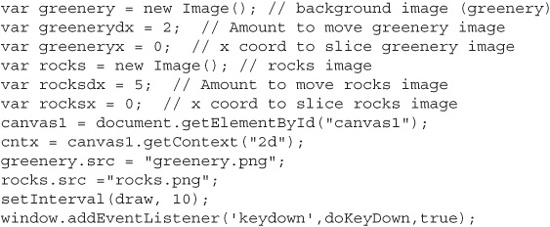
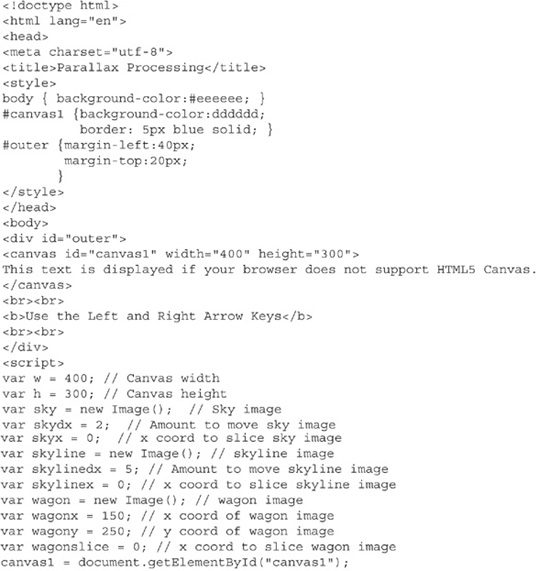
When the page opens, some variables are set, as well as an event listener for the keyboard, and a setInterval statement is set to call the draw function every 10 milliseconds.
Note the variables greenerydx and rocksdx. These variables establish what appears as the scrolling speed. The greenery has a value of 2; rocks have a value of 5. These are not actually scrolling speeds, but rather indicate where in the larger-than-canvas graphics to pluck out the area that is shown. The rocks value of 5 is larger, and the result is the appearance that the rocks are scrolling faster. The action appears smooth, as the refresh speed is rather fast (10 milliseconds).
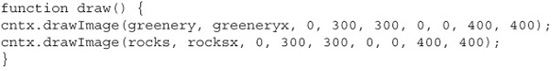
The draw function applies the constantly updated values to the drawImage method.
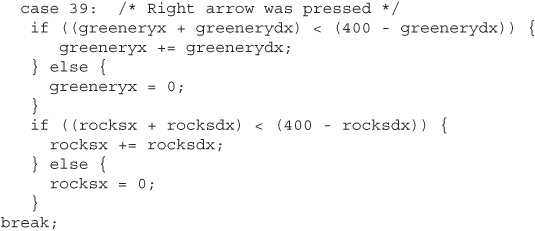
It is within the keyboard listener that the portion of the graphic to display is updated. When the position reaches 400 (the width of the canvas), the counter is reset to 0.
This is admittedly a bit intimidating code to get your head around. Careful review of the code (as well as trying out the example on the Web) is the best way to grasp how this works.
The preceding example has two moving graphics, which are traveling at different speeds. In the next example, another feature is introduced: a third graphic is placed in the canvas. This one behaves a bit differently. It does not appear to scroll, although it seems to be in motion. It stays stationary, but in the way the larger graphics described earlier have only a portion appear at a time, this graphic does the same. In this example, the background is the night sky (a field of stars), the closer graphic is a skyline, and the third graphic is a wagon.
The wagon is really three views of the wagon that are cycled through, as shown in Figure 14-13. You might notice that the wheels appear turned in each segment, as well as the handle coming out of the top of the wagon.
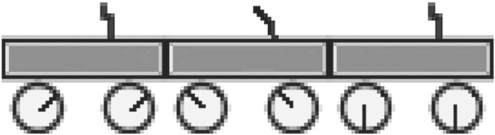
Figure 14-13 A wagon in three views, of which only one is seen at a time
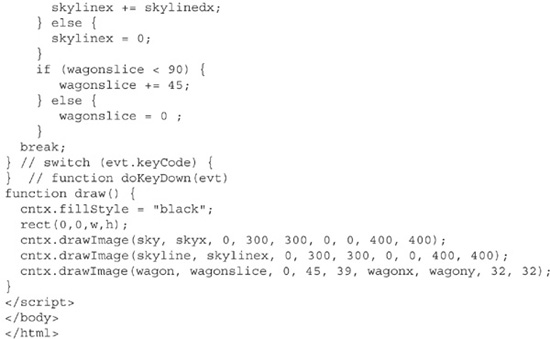
The code for this example is quite similar to that in Code Listing 14-10, but with more included to handle the visual representation of the wagon, and a few more lines to take care of clearing the canvas and setting the color. Code Listing 14-11 shows the full set of routines that run the 3D effect.
Code Listing 14-11 Parallax processing, with an added step
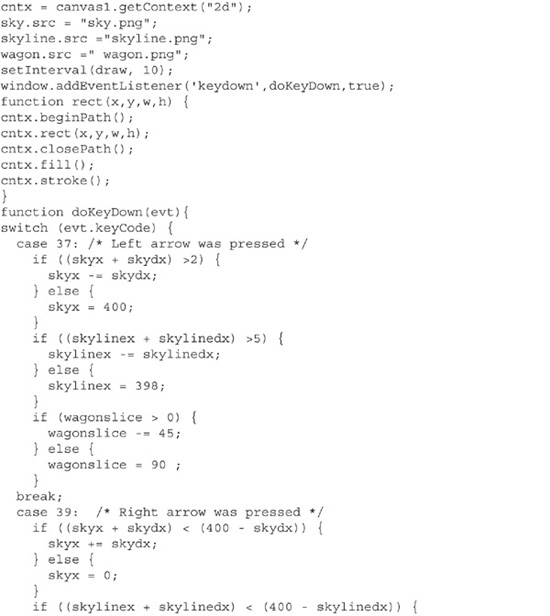
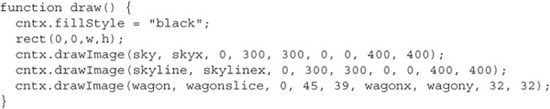
The width and height of the canvas are stored in the w and h variables. Initialization of the sky and skyline graphics is similar to that for the greenery and rocks graphics in Code Listing 14-10. New here are variables holding information about the wagon. The variables wagonx and wagony are coordinates of where the wagon is seen on the canvas. These do not change. The wagonslice variable changes to show which of the three wagon views to use.
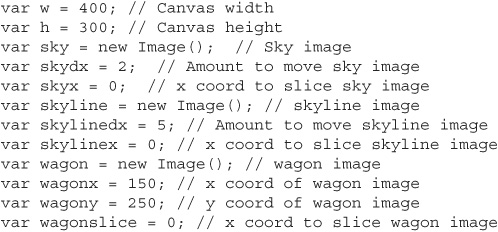
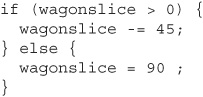
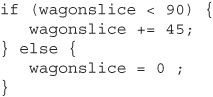
The wagon graphic is 135 pixels wide, which means each view of the wagon is 45 pixels wide (45 × 3 = 135). Therefore, the testing of the wagonslice variable is based on a multiple of 45. When the left arrow key is pressed, wagonslice is tested to see if it is greater than 0. If so, then 45 is subtracted from its value. When it is 0, it is reset to 90.
When the right arrow key is pressed, wagonslice is tested to see if it is less than 90. If so, then 45 is added to the value; otherwise, it is reset to 0.
Regardless of direction, 45 pixels of the overall 135 pixels are shown—in other words, one slice of the overall 135-pixel graphic.
As the draw function is chugging away every 10 milliseconds, the canvas is filled with black, and the images are redrawn.
Some type of clearing is necessary because the wagon is not moving. Filling the background of the canvas with black takes care of that, as well as following the nighttime theme; the background is a field of stars. Figure 14-14 shows the canvas filled with the background stars, foreground skyline, and stationary wagon.
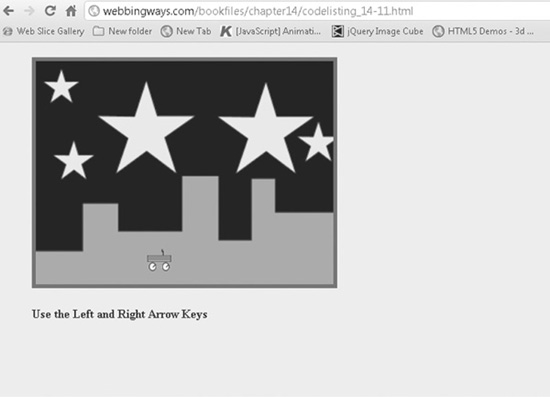
Figure 14-14 Left or right movement provides a 3D experience.
Summary
This closing chapter of the book presented some techniques that are beyond the basics. The JavaScript overview was intended as a reference for the common programming needs of looping and branching, and reusable code efficiency via functions as well. Geometry and a touch of trigonometry were covered to serve as a basis of future graphics you might create. There is quite a bit more that can be accomplished with math—simulations of gravity, elasticity, and more. Even rocket science (calculus) can be made visual. Finally, you learned about parallax processing, both the technique and perhaps as a demonstration of how you can often find a way around a limitation. The canvas, two-dimensional in all respects, was used in such a way to show depth—the third dimension.
We hope this book provides inspiration in addition to a reference of techniques. Multimedia is the sugar of web page use. Seeing something always has an instant response, or at least invokes an emotion in most of us. And that is the point to much of the Web: to get a rise out of your viewers.
HTML5 is not brand-new in its design, but is evolving in its implementation. Being on top of browser nuances has always been a blessing and a curse (mostly a curse) of web developers and designers. It comes with the territory and is no reason not to push the envelope.
Thanks for reading, and best wishes with your web projects!