
We'll modify our UFORecordValidationMapper to report statistics about skipped records and also highlight some other facilities for recording information about a job:
- Create the following as the
UFOCountingRecordValidationMapper.javafile:import java.io.IOException; import org.apache.hadoop.io.* ; import org.apache.hadoop.mapred.* ; import org.apache.hadoop.mapred.lib.* ; public class UFOCountingRecordValidationMapper extends MapReduceBase implements Mapper<LongWritable, Text, LongWritable, Text> { public enum LineCounters { BAD_LINES, TOO_MANY_TABS, TOO_FEW_TABS } ; public void map(LongWritable key, Text value, OutputCollector<LongWritable, Text> output, Reporter reporter) throws IOException { String line = value.toString(); if (validate(line, reporter)) Output.collect(key, value); } private boolean validate(String str, Reporter reporter) { String[] parts = str.split(" ") ; if (parts.length != 6) { if (parts.length < 6) { reporter.incrCounter(LineCounters.TOO_FEW_TABS, 1) ; } else { reporter.incrCounter(LineCounters.TOO_MANY_TABS, 1) ; } reporter.incrCounter(LineCounters.BAD_LINES, 1) ; if((reporter.getCounter( LineCounters.BAD_LINES).getCounter()%10) == 0) { reporter.setStatus("Got 10 bad lines.") ; System.err.println("Read another 10 bad lines.") ; } return false ; } return true ; } } - Make a copy of the
UFOLocation2.javafile as theUFOLocation3.javafile to use this new mapper instead ofUFORecordValidationMapper:… JobConf mapconf1 = new JobConf(false) ; ChainMapper.addMapper( conf, UFOCountingRecordValidationMapper.class, LongWritable.class, Text.class, LongWritable.class, Text.class, true, mapconf1) ; - Compile the files, jar them up, and submit the job to Hadoop:
…
12/02/12 06:28:51 INFO mapred.JobClient: Counters: 22
12/02/12 06:28:51 INFO mapred.JobClient:   UFOCountingRecordValidationMapper$LineCounters
12/02/12 06:28:51 INFO mapred.JobClient:     TOO_MANY_TABS=324
12/02/12 06:28:51 INFO mapred.JobClient:     BAD_LINES=326
12/02/12 06:28:51 INFO mapred.JobClient:     TOO_FEW_TABS=2
12/02/12 06:28:51 INFO mapred.JobClient:   Job Counters
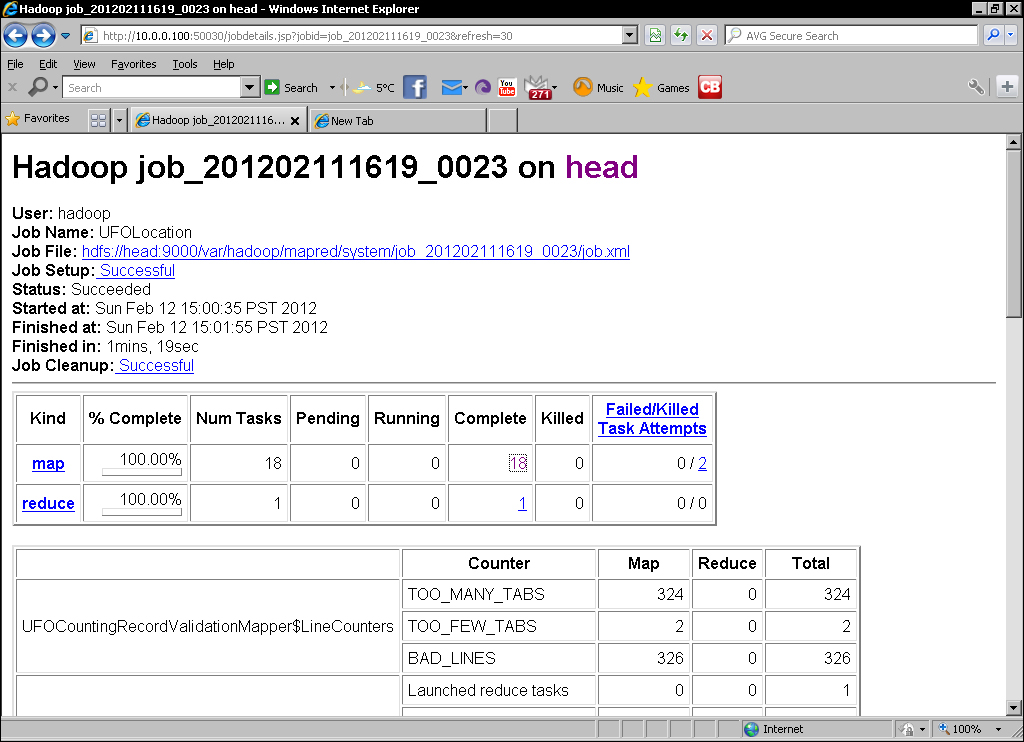
- Use a web browser to go to the MapReduce web UI (remember by default it is on port 50030 on the JobTracker host). Select the job at the bottom of the Completed Jobs list and you should see a screen similar to the following screenshot:
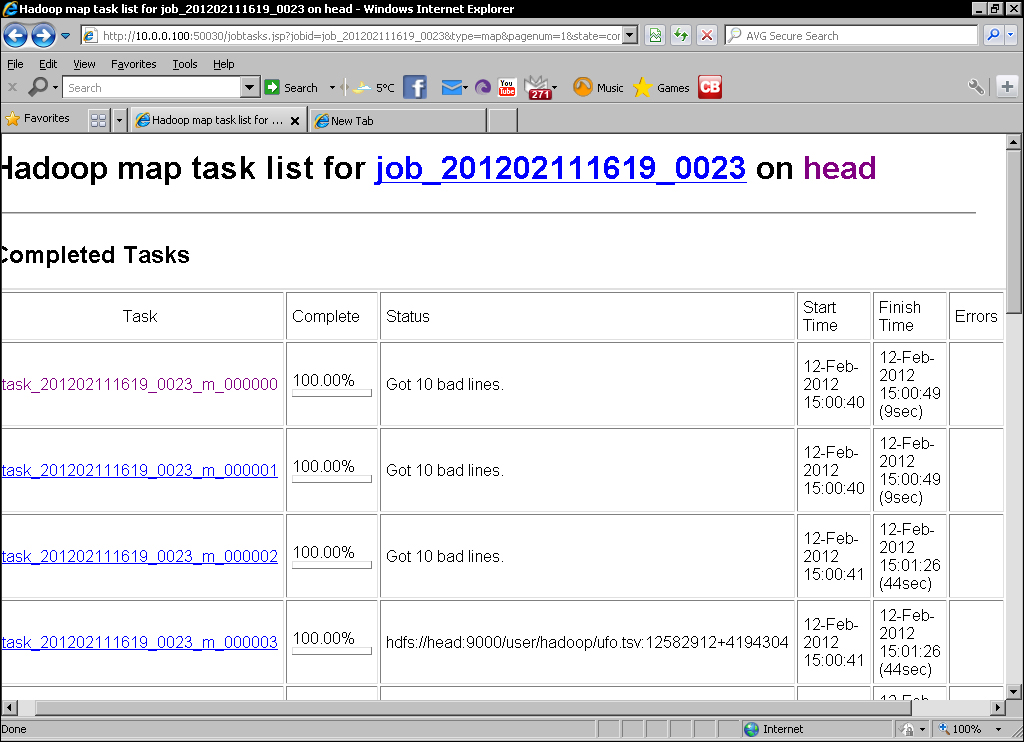
- Click on the link to the map tasks and you should see an overview screen like the following screenshot:
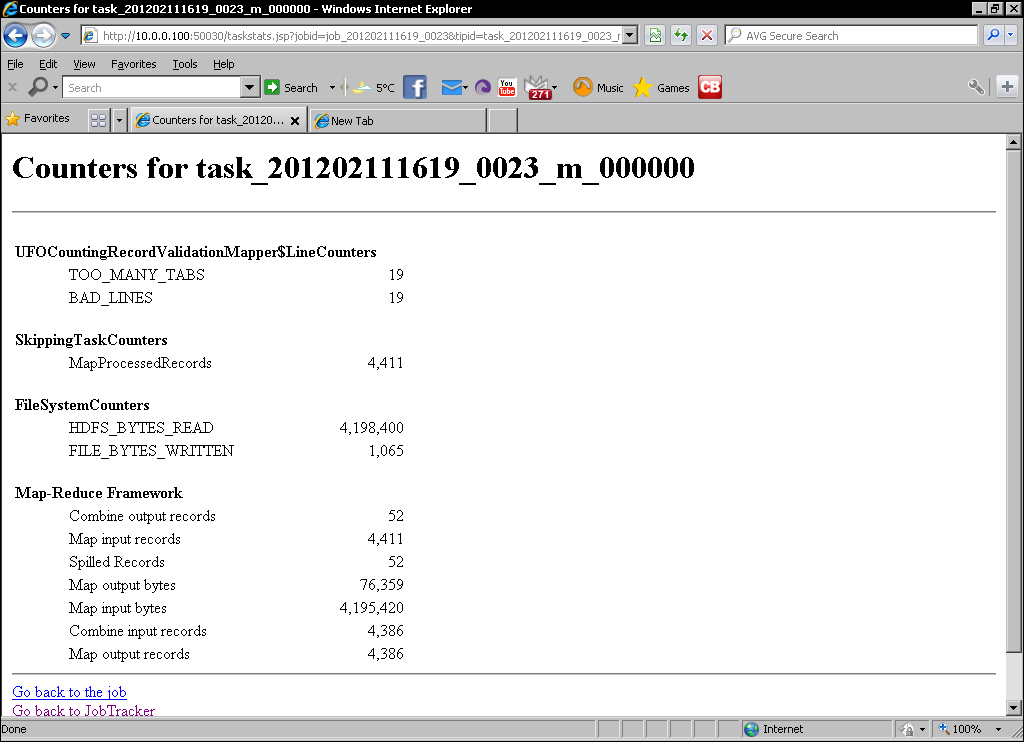
- For one of the tasks with our custom status message, click on the link to its counters. This should give a screen similar to the one shown as follows:
- Go back to the task list and click on the task ID to get the task overview similar to the following screenshot:
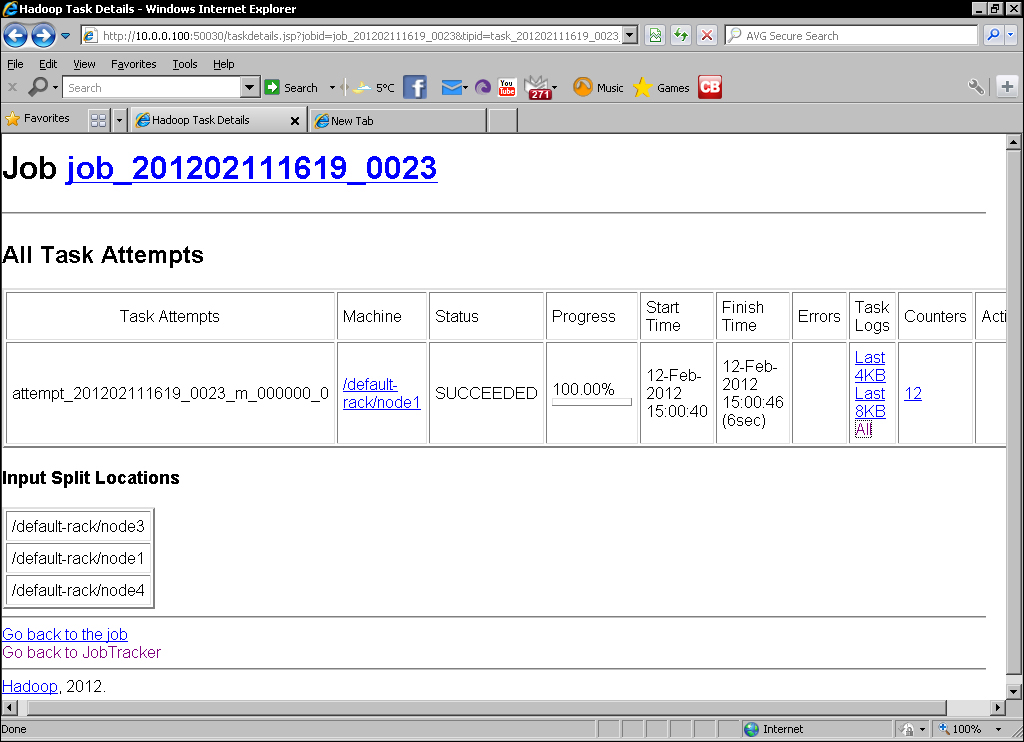
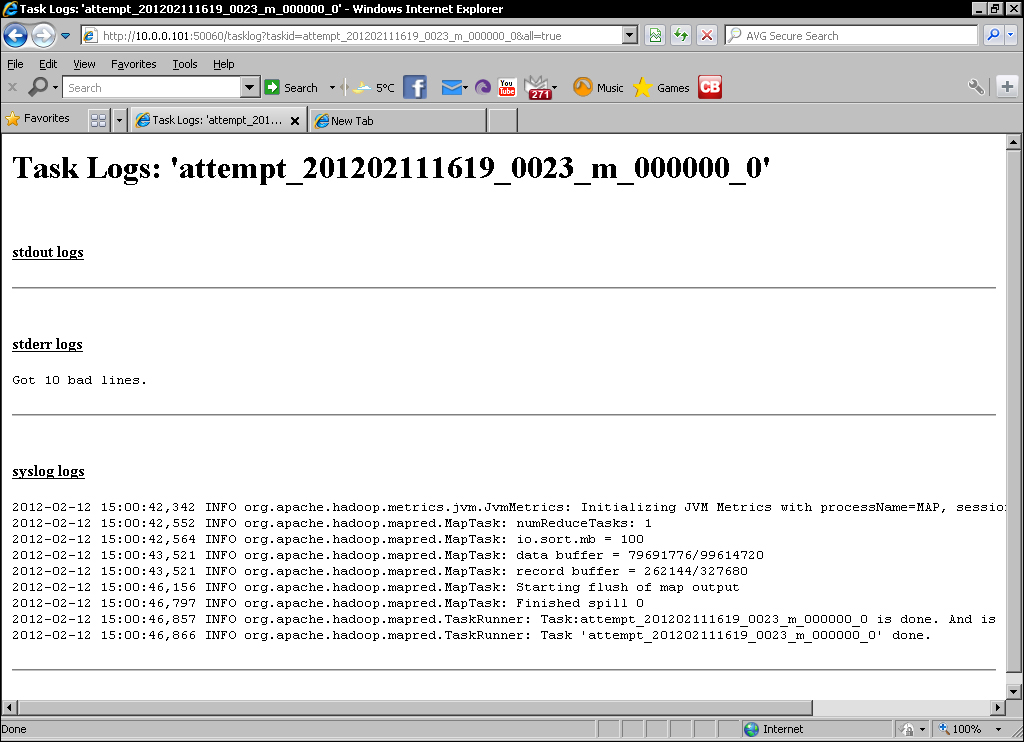
- Under the Task Logs column are options for the amount of data to be displayed. Click on All and the following screenshot should be displayed:
- Now log into one of the task nodes and look through the files stored under
hadoop/logs/userlogs. There is a directory for each task attempt and several files within each; the one to look for isstderr.
The first thing we need to do in order to add new counters is to create a standard Java enumeration that will hold them. In this case we created what Hadoop would consider a counter group called LineCounters and within that there are three counters for the total number of bad lines, and finer grained counters for the number of lines with either too few or too many fields. This is all you need to do to create a new set of counters; define the enumeration and once you start setting the counter values, they will be automatically understood by the framework.
To add to a counter we simply increment it via the Reporter object, in each case here we add one each time we encounter a bad line, one with fewer than six fields, and one with more than six fields.
We also retrieve the BAD_LINE counter for a task and if it is a multiple of 10, do the following:
- Set the task status to reflect this fact
- Write a similar message to
stderrwith the standard JavaSystem.err.printlnmechanism
We then go to the MapReduce UI and validate whether we can see both the counter totals in the job overview as well as tasks with the custom state message in the task list.
We then explored the web UI, looking at the counters for an individual job, then under the detail page for a task we saw, we can click on through the log files for the task.
We then looked at one of the nodes to see that Hadoop also captures the logs from each task in a directory on the filesystem under the {HADOOP_HOME}/logs/userlogs directory. Under subdirectories for each task attempt, there are files for the standard streams as well as the general task logs. As you will see, a busy node can end up with a large number of task log directories and it is not always easy to identify the task directories of interest. The web interface proved itself to be a more efficient view on this data.
After not worrying much about how to get status and other information out of our jobs, it may suddenly seem like we've got too many confusing options. The fact of the matter is that when running a fully distributed cluster in particular, there really is no way around the fact that the data may be spread across every node. With Java code we can't as easily mock its usage on the command line as we did with our Ruby Streaming tasks; so care needs to be taken to think about what information will be needed at runtime. This should include details concerning both the general job operation (additional statistics) as well as indicators of problems that may need further investigation.
Counters, task status messages, and good old-fashioned Java logging can work together. If there is a situation you care about, set it as a counter that will record each time it occurs and consider setting the status message of the task that encountered it. If there is some specific data, write that to stderr. Since counters are so easily visible, you can know pretty quickly post job completion if the situation of interest occurred. From this, you can go to the web UI and see all the tasks in which the situation was encountered at a glance. From here, you can click through to examine the more detailed logs for the task.
In fact, you don't need to wait until the job completes; counters and task status messages are updated in the web UI as the job proceeds, so you can start the investigation as soon as either counters or task status messages alert you to the situation. This is particularly useful in very long running jobs where the errors may cause you to abort the job.