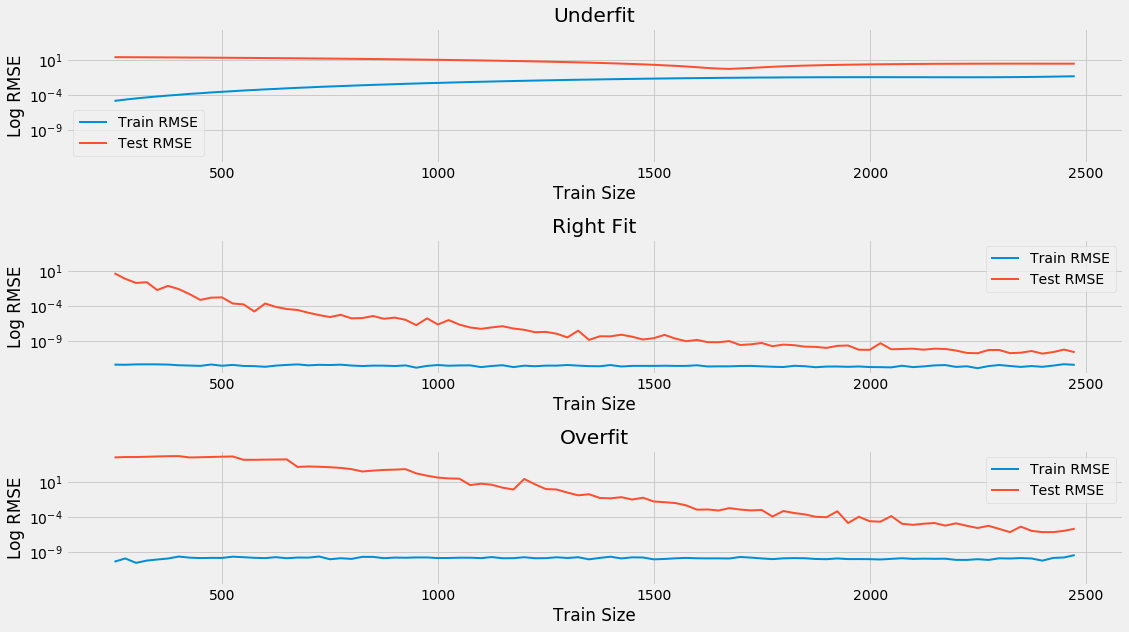
A learning curve plots the evolution of train and test errors against the size of the dataset used to learn the functional relationship. It is a useful tool to diagnose the bias-variance trade-off for a given model because the errors will behave differently. A model with a high bias will have a high but similar training error, both in-sample and out-of-sample, whereas an overfit model will have a very low training error.
The declining out-of-sample error illustrates that overfit models may benefit from additional data or tools to limit the model's complexity, such as regularization, whereas underfit models need to use either more features or otherwise increase the complexity of the model, as shown in the following screenshot: