
Time series data typically contains a mix of various patterns that can be decomposed into several components, each representing an underlying pattern category. In particular, time series often consist of the systematic components trend, seasonality and cycles, and unsystematic noise. These components can be combined in an additive, linear model, in particular when fluctuations do not depend on the level of the series, or in a non-linear, multiplicative model.
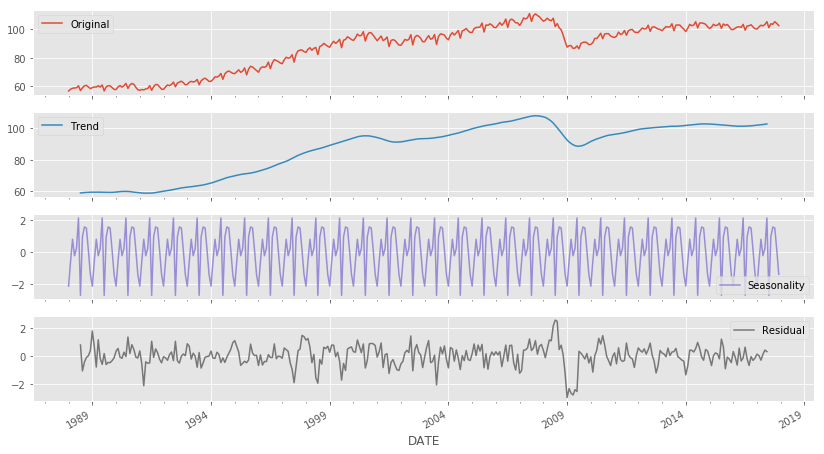
These components can be split up automatically. statsmodels includes a simple method to split the time series into a trend, seasonal, and residual component using moving averages. We can apply it to monthly data on industrial manufacturing production with both a strong trend and seasonality component, as follows:
import statsmodels.tsa.api as tsa
industrial_production = web.DataReader('IPGMFN', 'fred', '1988', '2017-12').squeeze()
components = tsa.seasonal_decompose(industrial_production, model='additive')
ts = (industrial_production.to_frame('Original')
      .assign(Trend=components.trend)
      .assign(Seasonality=components.seasonal)
      .assign(Residual=components.resid))
ts.plot(subplots=True, figsize=(14, 8));
The resulting charts show the additive components. The residual component would be the focus of additional modeling, assuming that the trend and seasonality components are more deterministic and amenable to simple extrapolation:
There are more sophisticated, model-based approaches that are included in the references available on GitHub.