
Let's assume we have some samples  in a dataset and that they are labeled and normally distributed (Gaussian distribution). In such a case, we can use distribution properties to detect anomalies. Let's assume that the function
  gives us the probability of a sample being normal. A high probability corresponds to a regular sample, while a low probability corresponds to an anomaly. We can, therefore, choose thresholds to distinguish between regular values and anomalies with the following anomaly model formula:

If [ ] and
] and  follows the Gaussian distribution with the mean,
  , and the variance,
  , it is denoted as follows:

The following formula gives the probability of  in a Gaussian distribution:

Here,  is the mean and
  is the variance (
 is the standard deviation).
Next, we'll introduce an example of the general approach we follow for anomaly detection with Gaussian distribution density estimation:
- Let's say we're given a new example,
 .
. - Select the features,
 , that are regular, meaning they determine anomalous behavior.
 - Fit the
 and
and  parameters.
 - Compute
 using an equation to calculate the probability of
  in a Gaussian distribution.
 - Determine if
 is an anomaly by comparing it with the threshold,
  ; see the anomaly model formula.
The following graph shows an example of Gaussian distribution density estimation for normally distributed data:

In this approach, we assume that selected features are independent, but usually, in real data, there are some correlations between them. In such a case, we should use a multivariate Gaussian distribution model instead of a univariate one.
The following formula gives the probability of  in a multivariate Gaussian distribution:

Here,  is the mean,
  is the correlation matrix, and
  is the determinant of the matrix,
  :
:

The following diagram shows the difference between the univariate and the multivariate Gaussian distribution estimation models for a dataset with correlated data. Notice how distribution boundaries cover the regular data with a blue color, while the anomalies are marked with a lighter color:
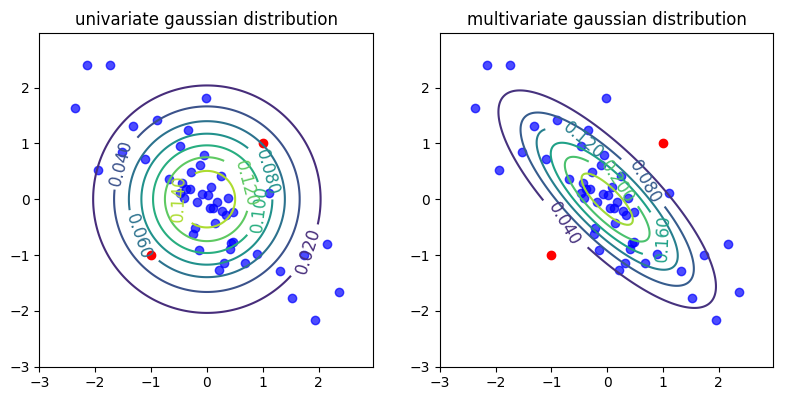
We can see that the multivariate Gaussian distribution can take into account correlations in the data and adapt its shape to them. This characteristic allows us to detect anomalies correctly for types of data whose distribution follows a Gaussian (normal) distribution shape.
In the current section, we discussed various anomaly detection approaches, and in the following sections, we will see how to use various C++ libraries to deal with the anomaly detection task.