
Sometimes your program will need to meet some requirements for space and time execution. It is really important to know how the data is represented, what lazy evaluation or strict evaluation involves, and how to control the space and time behavior. In this chapter, you will learn basic techniques to improve the performance of your programs.
Type Signatures
If you don’t specify the type signatures, GHC will provide you with a warning about defaults and missing types. It is important to explicitly name the types. For example, the default type for the integer values is Integer, which is ten times slower than Int.
Optimization Flags
No –O flag: This is the default type of compiling.
-O0 is equivalent to the first option (no optimization at all).
-O or -O1 means, “Generate good-quality code without taking too long about it.” In a terminal, you use the following command:
ghc -c -O Program.hs
-O2 means “Apply every nondangerous optimization, even if it means significantly longer compile times.” A dangerous optimization means that you actually obtain a worse time or space complexity.
Profiling
One of the most important technique that allows you to learn about space and time allocation in Haskell is profiling.
Profiling is a technique through which you can monitor the expressions in the programs. You can observe how many times an expression runs and how much it allocates. There are three methods in which you can enable profiling: using GHC, using Stack, or using Cabal. In this section, you will use GHC’s profiling.
- 1.
Compile the program with the –prof option. If you want automatic annotations, use the –fprof-auto option.
- 2.
Run the program with an option that generates the profile. For example, the option +RTS –p shows time profiling, generated in a file with the .prof extension.
- 3.
Check the profile.
The –rtsopts option enables RTS.
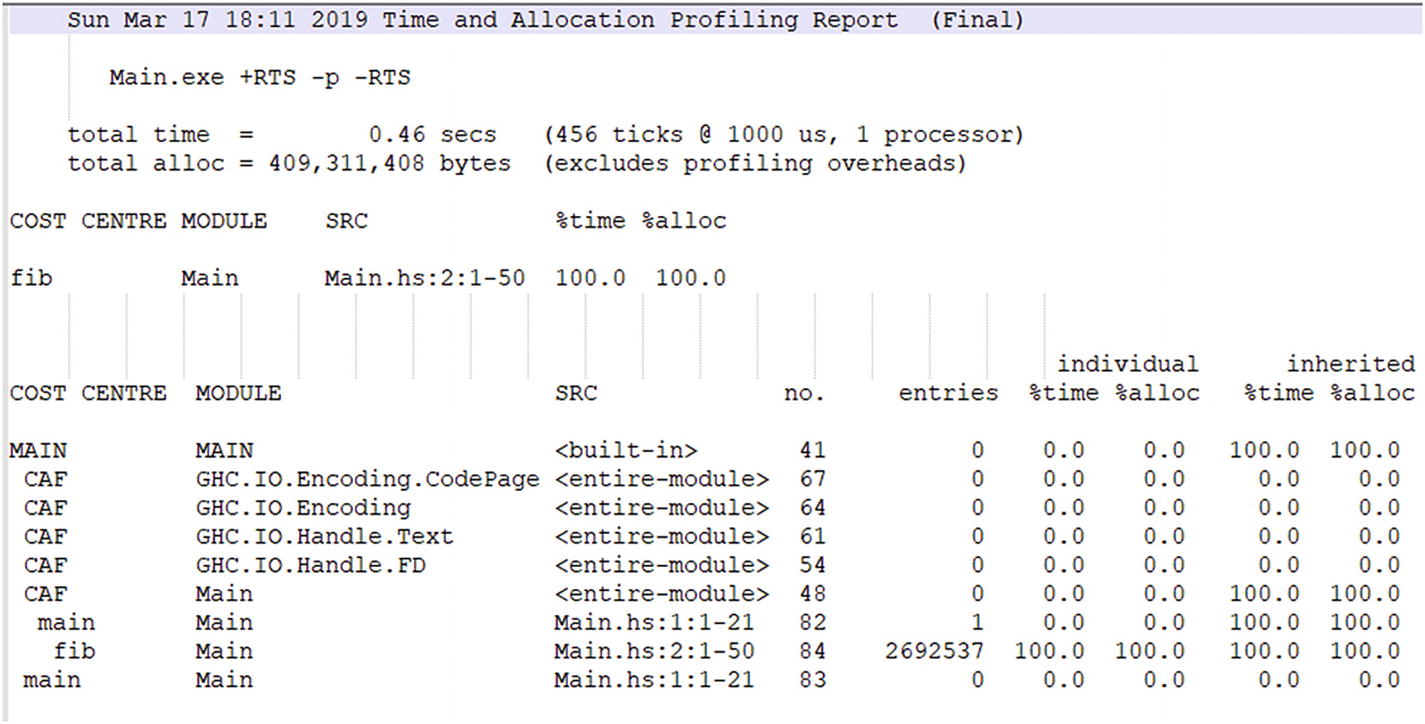
Profiling a simple program
In the first section of the file, you can see the program names and options, the total time, and the total memory used. The second section shows the costliest function (time and allocation), and the third section shows details about costs. The statistics are displayed for individual items and inherited, which includes the cost of the children of the node.
For a complete guide to profiling, consult [1]. If you want to use profiling with Cabal, consult [2]. For profiling with Stack, consult [3].
The weigh Library
Case | Allocated | GCs |
|---|---|---|
integers count 0 | 16 | 0 |
integers count 1 | 88 | 0 |
integers count 10 | 736 | 0 |
integers count 100 | 7,216 | 0 |
Other Techniques
Checking for space leaks [4]
Setting up an isolated benchmark, using Criterion [5]
Checking for the strictness of functions’ arguments [6]
Using a correct data structure [7]
Checking for strictness and unpacking the types [8]
Checking to see whether the code is polymorphic [9]
Using the core language to generate real code before assembly (many optimizations can be done here) [10]
Using Text or ByteString instead of String [11]
References
- 1.
- 2.
Tutorial: profiling Cabal projects, https://nikita-volkov.github.io/profiling-cabal-projects/
- 3.
- 4.
Detecting space leaks, http://neilmitchell.blogspot.com/2015/09/detecting-space-leaks.html?m=1
- 5.
Criterion: a Haskell microbenchmarking library, http://www.serpentine.com/criterion/
- 6.
Performance/strictness, https://wiki.haskell.org/Performance/Strictness
- 7.
Specific comparisons of data structures, https://wiki.haskell.org/Performance#Specific_comparisons_of_data_structures
- 8.
Unpacking strict fields, https://wiki.haskell.org/Performance/Data_types#Unpacking_strict_fields
- 9.
Performance/overloading, https://wiki.haskell.org/Performance/Overloading
- 10.
Looking at the core, https://wiki.haskell.org/Performance/GHC#Looking_at_the_Core
- 11.
Haskell string types, http://www.alexeyshmalko.com/2015/haskell-string-types/