
Dual Modulation for LED-Backlit HDR Displays
M. Narwaria; M.P. Da Silva; P. Le Callet University of Nantes, Nantes, France
Abstract
High dynamic range (HDR) and wide color gamut video processing have started to receive significant research attention in recent years, especially in relation to content generation and processing. However, displaying such content is still a challenge, and efforts are required to make their deployment possible at consumer levels. While the emergence of locally backlit displays has helped to achieve higher contrast in the display of traditional low dynamic range videos, their use for displaying HDR videos is nontrivial. This chapter, therefore, aims to first identify a few challenges in this area. It then outlines a new dual modulation algorithm for the rendering of HDR content. It also discusses practical lessons that can be helpful toward the rendering of more accurate and visually appealing HDR content.
Keywords
High dynamic range content rendering; Backlight dimming; Dual modulation; LCD; LED
14.1 Introduction
Liquid crystal displays (LCDs) have more or less completely replaced the traditional cathode ray tube displays in recent years. LCDs offer the advantage of being much thinner and hence more portable. LCDs have also become much cheaper with advances in technology and hence offer an attractive alternative to cathode ray tubes. LCD televisions produce a black and colored image by selectively filtering white light. Millions of individual LCD shutters, arranged in a grid, open and close to allow a metered amount of the white light through. Each shutter is paired with a colored filter to remove all but the red, green, or blue portion of the light from the original white source. Until recently, the source of light in LCDs was cold cathode fluorescent lamps (CCFLs). They have been one of the most popular sources of backlight for LCDs mainly because they are cost-efficient. However, they suffer from several functional disadvantages, such as higher power requirements, low speed switching, and shorter life. Consequently, light-emitting diodes (LEDs) have increasingly replaced CCFLs (Anandan, 2008) as the choice of backlight. An LED is a two-lead semiconductor light source. It is a pn-junction diode, which emits light when activated. When a suitable voltage is applied to the leads, electrons are able to recombine with electron holes within the device, releasing energy in the form of photons. In comparison with fluorescent lights, LEDs have significantly lower power requirements and convert power to light more efficiently, so less is lost as heat, and focus it more precisely, so there is less light leakage, which can cause fuzziness. An LED also lasts much longer than most other lighting technologies (Anandan, 2008). These characteristics coupled with significant advances in semiconductor technologies (thereby reducing LED costs) have propelled LEDs to be one of the most preferred sources of light in recent display technologies.
Whatever the source of the backlight (LEDs or CCFLs), the way it is used is the most relevant issue considered in this chapter. Specifically, in most consumer displays, the backlight is mainly uniform and constantly on to power most LCDs and LCD television sets. Hence, the backlight acts merely as a source of constant power and the liquid crystals are modulated to form the picture by adjustment of the amount of light that passes though them (hence they are referred to as uniformly backlit displays). However, such uniform backlight setting can result in low contrast levels and poor clarity especially in darker areas of the picture to be displayed. Moreover, it will also lead to higher power consumption. Thus, nonuniform backlight dimming has increasingly become a popular technology. The LEDs are dimmed locally to create deeper blacks in specific areas of the screen, which can also allow there to be better detail in dark scenes. This allows there to be very high dynamic contrast ratios in comparison with a uniform backlight setting (the ability of LEDs to be switched on and off faster than CCFLs is also an important factor in locally dimmed backlit displays).
The LEDs can be placed directly behind the LCD panel or at one or more of the sides. The former is known as a direct-lit configuration, while the latter is referred to as an edge-lit configuration. Both have their advantages and disadvantages. The edge-lit configuration has the LEDs surrounding the back of the panel and they use guides to light up the whole backplane. The main advantage is cost reduction, because it requires fewer LEDs, and has a reduced halo effect. It also helps to develop thinner display sets. On the downside, the edge-lit configuration can sacrifice the contrast ratio, leading to less sharp pictures. In the direct-lit configuration, the LEDs are placed directly behind the LCD panel and can therefore provide very high contrast ratios. It therefore also allows one to exploit the real benefits of the local backlight dimming. However, direct-lit displays can be much more costly as they require more LEDs, and can also introduce halo effects, especially around bright objects in the scene.
While it can be expected that local backlight dimming will be beneficial both for saving power and for improving picture quality, there are issues that need to be resolved for its full potential to be realized. Specifically, if the backlight is dimmed to an excessive degree, some pixels might not be able to increase their transmittance enough to compensate for the reduced emission of light, causing them to appear darker than intended. This creates an artifact called clipping; the pixels that suffer from it are called clipped pixels. Likewise, when one is viewing a video, the backlight intensity should change in a temporally coherent manner so that artifacts such as flickering are minimized. It should also be kept in mind that the backlight structure is composed of grids (square or hexagonal in many cases) that illuminate a local area. As a consequence, the localization is limited to a region rather than at the pixel level. In other words, each LED can act as a source of power for several pixels and each pixel can receive light from several LEDs. Because of this, bright and dark pixels are often in conflict, particularly when they are in the same region. In such cases, it is therefore nontrivial to obtain a backlight intensity which is optimal for both, because the high luminance required by the former will cause leakage in the latter. The presence of a group or cluster of bright pixels surrounded by dark pixels will also induce a halo artifact (Seetzen et al., 2003), caused by leakage being more evident in the dark pixels close to the bright cluster. Thus, there is a need to dynamically find a trade-off between aspects such as picture quality, power consumption, and the resultant complexity of the backlight dimming algorithm. A survey of literature shows that there are several backlight dimming algorithms for low dynamic range (LDR) displays. Most of these favor one of the aspects in rendering a video mentioned depending on the application considered.
14.2 Dual Modulation for Backlight Dimming
Local backlight dimming is motivated by the fact that not all frames require the same amount of light, because some are darker than others. With local backlight, it is possible to vary the light intensity spatially according to the image content; for example, if the image contains both dark and bright areas, the backlight can be dimmed only in the dark ones. As mentioned, most of the existing work in local backlight dimming targets LDR displays and the primary goal is power efficiency (ie, minimization of power consumption). At the same time, contrast of the rendered picture is enhanced by minimization of light leakage. Leakage is caused by imperfections in the liquid crystals preventing the complete obstruction of light when this is required (ie, black pixels) and is particularly visible from wide viewing angles. This raises the black level of the screen, making dark pixels brighter than desired. Local backlight dimming can therefore help to represent the display black level more accurately.
Recall that there is a many-to-many relationship between the backlight segments and pixels in the picture to be rendered. Thus, most existing methods determine the backlight configuration on the basis of the intensities of a local group of pixels. The simplest backlight dimming algorithms use simple global or local image characteristics (eg, the maximum or average pixel value) to determine the backlight. The maximum algorithm sets the intensity of each LED to the maximum pixel value of the corresponding segment, while other algorithms use the mean value (Funamoto et al., 2001). The square root algorithm proposed by Seetzen et al. (2004) uses the square root of the normalized average pixel value (ie, valued between 0 and 1). These algorithms although simple are not reliable because the maximum might not result in any energy saving, especially for large segments, and is very sensitive to noise and prone to flickering, while mean value setting tends to produce excessively dim backlight. To overcome the limitations of methods based on simple statistics, more sophisticated models have been proposed over the years. The method proposed by Cho and Kwon (2009) used a correction term to ofset the average pixel intensity and considers the local difference between maximum and average luminance. A similar method developed by Zhang et al. (2012) computes the said correction term as the ratio of the luminance variance of the segment and the variance when the maximum backlight luminance is equal to the average luminance of the segment. Other methods such as the one introduced by Nam (2011) use both local and global brightness in order to find a better trade-off between enhancing local contrast and preserving the overall appearance of the rendered picture. A local backlight dimming algorithm was developed by Kim et al. (2009), and is based on accounting for the brightness of not just the current segment but the neighboring ones as well. Several other methods, such as those proposed by Kang and Kim (2009), Cho et al. (2011), Kang and Kim (2011), and Nadernejad et al. (2013) are based on image statistics such as histograms. Likewise, Chen et al. (2007) set the initial LED intensities using local weighted histograms. The algorithm presented by Cho et al. (2013) calculated separate RGB histograms for each backlight segment and these were used to reduce the intensity of each LED up to a threshold. The histogram-based method introduced by Lin et al. (2008) computed the cumulative distribution function (from a global histogram) and used its inverse to map a weighted mean of the maximum and average pixel values of each backlight segment to the resulting LED intensity. Another category of backlight modulation methods, such as those proposed by Shu et al. (2013), Albrecht et al. (2010), and Hong et al. (2010), are based on point spread functions (PSFs) to exploit the knowledge of light diffusion and model how lights diffuses from a source. A few methods, such as those introduced by Burini et al. (2013, 2012), focus primarily on power consumption, and aim to achieve a trade-off between clipping and leakage. We do not elaborate on these methods for LDR backlight dimming, but encourage the reader to refer to the respective references. However, most of them share a similar design philosophy. The primary aim is to minimize effects such as leakage and/or clipping on the one hand, and the resultant algorithm complexity on the other. This helps to reduce power consumption and increase contrast of the rendered picture.
As mentioned, the existing studies on backlight dimming target LDR displays. Thus, they do not consider the relatively high resolution backlight LED array. In other words, they do not take into account higher luminance and luminance resolution which is required for HDR picture rendering. As far as HDR is concerned, there are very few studies that address the issue of backlight dimming. The first work on HDR displays with local backlight dimming was reported by Seetzen et al. (2004). It has been used as the HDR baseline method with regard to dual modulation in HDR display systems, and is a simple and general algorithm for HDR dual modulation.
This simple algorithm derives the value of LEDs from a subsampled version of the square root of the luminance of the original HDR image. The value of the LCD panel pixels is determined by division of the original HDR image by the illumination map calculated from the convolution of the value of the backlight LEDs by the PSF of the LEDs. We now describe this algorithm in more detail, and then identify a few issues with it. A schematic diagram of this method is shown in Fig. 14.1.
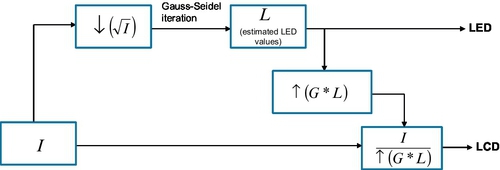
• The first step is to take the square root of the HDR image I. This may be viewed as a simple strategy to “split” the HDR image into two components, one for LED-based backlight and the other for the LCD front panel.
• Next, the target intensities for every individual LED are computed by downsampling of the square root image to the resolution of the LED array. This is required because there does not exist a one-to-one mapping between pixels and LEDs (ie, we do not have one LED per pixel but have much smaller resolution of the LED array). Also the PSFs of the LEDs will scatter the light from one LED to neighboring ones, resulting in a convoluted source of light for each segment. Therefore, finding the optimal LED configuration for image rendering is nontrivial. Seetzen et al. (2004) approximated the solution with a single Gauss-Seidel iteration over neighboring LED pixels to compute the estimated LED values L. Of course, in practice, one can do this by exploiting convex optimization techniques which seek to minimize the error between the target image and the image obtained after convolution with PSFs. Also note that the said error can be computed either in the physical domain (based on actual luminance) or in perceptual domain (the perceived luminance). The estimated values L will then be used to drive the LED panel.
• Next, the measured PSF of the LED is first approximated with a Gaussian G. Then, the estimated values L are convolved with G and the resulting signal is upscaled to the full resolution.
• Finally, the original HDR image I is divided by the signal in the previous step to compute the signal to drive the LCD panel.
The algorithm described above provides a baseline for the development and comparison of new dual modulation algorithms for HDR content rendering. While this method is simple, it has some issues that deserve further discussion. The first point concerns the use of a square root function as the first step. The original method does not justify this, neither experimentally nor qualitatively. In our opinion, we can view it as a means of equally splitting luminance on LEDs and LCDs although it is not clear if other functions may be used at this step, and what the possible effects (from rendering accuracy and visual quality perspectives) of that are. The second issue concerns the downsampling used in the second step of this method. Downscaling/downsampling essentially leads to averaging of neighboring values. This, in turn, will reduce the maximum luminance and one cannot achieve the target luminance. Obviously, this will affect the quality of the rendered HDR image/video. Also note that the optimization for obtaining backlight corrects the influence of the PSF but does not take into account constraints related to leakage. Thus, there is need for a more customizable optimization. Because videos have temporal information, it is not clear if the same method can be directly applied to render them. Finally, the HDR baseline method does not directly take into account power consumption, which is an important aspect in display systems.
14.3 Proposed Method for Dual Modulation
We briefly described the baseline HDR dual modulation method in the previous section, and also identified a few issues with it. In this section, we provide details on the dual modulation method that we developed. It is primarily based on addressing some of the issues identified. The detailed steps in the proposed method for rendering HDR images are now described.
• We begin with the observation that the HDR displays currently available cannot display luminance beyond the specified limit, given the hardware limitations. As a result, the first step in our proposed method aims at saturating the maximum image/video luminance to that of the HDR display to be used. No doubt this will impact the quality of the rendered content because it can lead to loss of details in areas with very high luminance. Unfortunately, this cannot be avoided because display limits. Nevertheless, the HDR display range is still capable of rendering about five orders of magnitude, which is sufficient for the rendering of most natural scenes. Thus, as a first step, we saturate the image luminance to the maximum displayable luminance. This step therefore corresponds to the idea that the HDR content should be graded so that it is display referenced and not scene referenced.
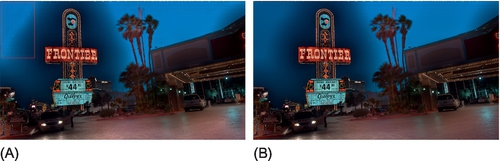
• The next step is to generate a grayscale version of the image. Note that this is not done with a simple mean or with BT.709/BT.601 RGB to Y coefficient. Instead, we used (for each pixel) the maximum of all three color channels. This helps to ensure that the backlight will provide enough light so as to render all color channels correctly and avoid saturation during the final division step of the algorithm. An example to illustrate this is shown in Fig. 14.2, in which two grayscale images are shown. The one on the left is obtained by use of a weighted combination of the red, green, and blue components (more specifically, 0.2989R + 0.5870G + 0.1140B), while the one on the right is obtained if we take the maximum of the three components. The latter image is expectedly brighter and this allows us to properly render all color channels because excess luminance can be clipped, if needed. In contrast, with the image on the left, it may not be always possible to provide the required luminance to each color channel. Lai and Tsai (2008) built local histograms from the maximum RGB value of each segment to develop an LDR dual modulation algorithm and hence this step in the proposed method is conceptually similar to their method but is not the same in terms of implementation.

• The grayscale image generated in the previous step is further used to derive the signals that drive the LED and LCD panels. For this, the image needs to be downsampled to the resolution of the LEDs. However, as mentioned, this can reduce the maximum luminance in the resulting image. Therefore, in our method, we use an additional step of morphological dilation before downsampling. The size and shape of the structuring element depends on the structure of the backlight LED array. Such morphological expansion aims to keep only the maximum value of the illumination map, and so the LEDs will have a lighting value representing not the average of the image area but most of this area. Further, the maximum luminance of the small areas of the image will also be preserved.
• In the next step, the HDR luminance is split into two components on the basis of a power law. This allows flexibility in changing the way the luminance is split depending on the exponent (between 0 and 1). In other words, this allows better control of the distribution between the LEDs and the LCD panel. The default value of 0.5 (this corresponds to the square root as used by Seetzen et al., 2004) allows a balanced distribution. However, it may be advantageous to use a higher power (eg, 0.9) to maximize the use of the dynamics of the LCD panel. This has two important benefits: (1) reduced power backlight, since the LEDs are less stressed; (2) better color reproduction in dark areas. This is illustrated in Fig. 14.3 where Fig. 14.3A shows an HDR image (it is tone-mapped for better display) for which we generated two LED light maps: using exponent (power) values of 0.3 and 0.9. The resulting LED maps are shown in Fig. 14.3A and B. Notice that the LED map generated with an exponent value of 0.9 is more contrasted, while it is more uniformly lit in the other case, and thus this LED map plays a smaller role in the contrast of the rendered image. In the limiting case of the exponent value being 0, the LED light map will be fully uniform (ie, uniform backlight without any local support). The use of higher exponent, which favors the LCD panel, however, requires a more precise modeling of the response of LEDs. This is because in areas where there are big changes in the local luminance values, use of a high value for the exponent would exaggerate the contrast on both the LCD panel image and the backlight. So any error, for example, in the PSF model will lead to larger reconstruction errors (ie, more artifacts in the rendered HDR image).

• In the next step, the LED map is normalized so that the (target) maximum value of the LCD panel is 255, in order to maximize the use of the dynamic range of the LCD panel. Obviously, this will improve the contrast of the LCD image. An illustration is provided in Fig. 14.4, which shows the images that will drive the LCD panel with and without the said normalization. For the image on the left, we did not normalize the LED map and so the contrast is lower. On the other hand, to obtain the image on the right, we first normalized the LED maps so that the maximum LCD value is 255, leading to better contrast. We found that such LED map normalization is particularly beneficial in rendering HDR content which is darker (low luminance).

• We then downsample the image to fit the resolution of the LEDs. This is done keeping in mind the position of the LEDs in the display. Note that the LEDs are typically arranged in hexagonal grids rather than as a square grid. The resultant downsampled LED map is further postprocessed in order to round off the values, so values greater than 1 are set to 1, while any zero value is replaced (which could cause division problems during the last steps of the algorithm).
• After we obtain the low-resolution image in the previous step, we generate a low-resolution version of the full-resolution PSF of the LEDs. Then, the LED light map is obtained via optimization. Specifically, the optimization aims to minimize the difference between the theoretical LED light map and the computed light map obtained by considering the PSF of the LEDs. We use a gradient-based optimization. At each iteration, a difference map is computed and a scaled version of this difference map is used to update the computed LED map. The said scaling is based on the idea of applying different penalties for values lower or higher than the target. This helps to avoid underlightening which in most cases cannot be compensated with an LCD panel. Another strategy that we adopted to compute the LED map is error diffusion in order to simulate nonlocal error correction since error at one point will have an impact on neighboring values. Toward this end, we filtered the error (or difference) map with a Gaussian whose parameters can be set to default values or customized. This also helps to account for the smoothness constraint, which is especially relevant to avoid flickering issues with HDR videos. The said optimization is terminated either when the number of iteration exceeds the predefined limit or when a local minimum is reached. In the proposed algorithm the optimization is done at the LED level. This is in contrast to a few algorithms for LDR dual modulation which seek to minimize the error between the finally rendered image and the target image. While the latter approach may be more accurate theoretically in terms of rendering, our approach based on LED optimization is much simpler, faster, and provides acceptable quality of rendering.
• The computed/estimated LED light map values are then rounded off to the nearest integer in the range from 0 to 255 (eight-bit LED panel). Next, a full resolution light map is generated with the computed LED map, the position of the LEDs in the display, and the PSF.
• The LCD values are generated by division of the original (saturated to maximum screen luminance) HDR image by the full resolution LED light map (this is similar to what is done in the baseline method).
• In the last step, the LCD panel values are corrected for both color and gamma. Typically a gamma value of 2.2 is used, but other values can be used (Poynton, 1996). Finally, the resulting values are rounded (any values greater than 255 are clipped to 255) off in the range from 0 to 255 (eight-bit LCD panel).
The above-mentioned steps apply for HDR image rendering only. For videos, we must consider temporal coherency issues and hence some of the steps might need to be either modified or disabled in order to avoid flickering. Such artifacts (flashes) are caused by excessive fluctuations in the value of the LEDs between consecutive frames of a video. Although these illumination differences are theoretically offset by the LCD panel, it appears that the synchronization between the LEDs and the LCD panel is not precise enough. It was therefore necessary to adapt the algorithm to obtain more homogeneous LED values (but less optimal from the point of view of contrast and power consumption). In other words, the method described for HDR images applies too “aggressive” compensation. Particularly, the morphological expansion used in the third step may result in a large change in the backlight (as mentioned, one of the reasons for this is related to the response times of the LEDs and the LCD, which are not the same). This has the effect of introducing the appearance of flashes (flickering). which are obviously unwanted (a visual example is provided in Fig. 14.9). Thus, this step may need to be disabled for HDR video rendering. Notice that to split the luminance, we used a more general power law instead of the square root. This is beneficial for image rendering because higher powers can be used to reduce power consumption and improve the color rendering (through better use of the dynamics of the LCD panel). However, for video, this can lead to local luminance incoherency between successive frames. Thus, for HDR video, the square root (power 0.5) is more suitable to achieve the initial distribution of the luminance between the LCD panel and the LEDs since it can limit the variation in the distribution between two neighboring frames of a video. The third adaptation for video is to disable the normalization of LCD panel values (to cover the whole dynamic of values). In the case of images, this standardization allows better contrast and better color rendering. However, in rare cases, it can cause global variations in the intensity of the LEDs, leading to the sensation of a flash of light during the transition from one frame to another. Finally, the LED values should be filtered during the optimization in order to limit the variations of the LEDs in successive video frames, thereby avoiding unwanted flashes.
We have described a dual modulation algorithm for HDR images and videos. While there are some restrictions (eg, optimization is based on LED maps), the method is fast and simple to implement, and the rendered HDR content has higher contrast in comparison with that obtained with default display algorithms. We provide some experimental (numerical) evidence to support this, in the next section. First, however, we provide some qualitative results of the proposed method. Fig. 14.5 shows the differences between the two strategies for dual modulation that we adopt in our method for image and video signals. There are three subfigures, for different HDR source contents1 (content 1, content 2, and content 3). As indicated in Fig. 14.5, the left images correspond to the optimization for images, while the ones on the right correspond to the case of videos. It can be seen that in the case of the images, the LED maps capture the fine and precise luminance variations of the original HDR image better. Further, the corresponding LCD panel has a much better resolution than LEDs. This helps to attain a good trade-off toward capturing local luminance variations in the rendered HDR image. For instance, in Fig. 14.5B one can see when the proposed method is optimized for images, it produces an LED light map which is aggressive and captures brighter areas in the foreground. Likewise, from Fig. 14.5C, we find that the high luminance due to street lights in the background is well represented in the corresponding LED map that has been optimized for images. The case of videos is, however, different, and we find that the proposed method optimized for videos is less aggressive. As mentioned, this is done so that the luminance coherence is maintained and flashes (flickering) are avoided. Thus, in comparison with the case for images, the LED light maps for videos are smoother because the aim is to avoid large local luminance changes. Since we obtain both the LED and the LCD maps, it is possible to combine these two and reconstruct what will actually be displayed on the screen. Thus, we can compute the error in luminance rendering. The said error can be quantified through a mean square error (MSE), which is presented in Table 14.1 for the three HDR contents shown in Fig. 14.5. Table 14.1 shows that the algorithm dedicated to videos usually generates larger errors, mainly due to constraints on the values of the LEDs. We have also presented in Table 14.1 the power consumption (in watts), from which one can easily infer that larger error will lead to lower power consumption and vice versa. The reason is that a more accurate luminance rendering (ie, smaller error) will require the turning on of more LEDs to light up localized bright areas.

Table 14.1
Error in Rendering Due to Two Strategies in the Proposed Method (One Optimized for Images and the Other Optimized for Videos) and the Corresponding Power Consumption
| MSE (Optimized for Videos) | Power Consumption (W) | MSE (Optimized for Images) | Power Consumption (W) | |
| Content 1 | 0.74% | 235.90 | 0.34% | 330.51 |
| Content 2 | 0.60% | 349.56 | 1.01% | 326.21 |
| Content 3 | 1.90% | 256.86 | 2.89% | 250.74 |

Therefore, the proposed dual modulation method optimized for videos is expected to result in bigger errors in rendering high local luminance as compared with the case of images. Finally, we show in Fig. 14.6 the local errors in luminance rendering from the proposed method when optimized for images and videos for content 3, for which the LCD and LED maps are shown in Fig. 14.5C. As can be seen, the method is generally accurate for lower luminance values but results in higher errors especially where there is very high local luminance. It can also be seen that the proposed method optimized for images leads to smaller error (up to 30%). As opposed to this, the method optimized for video can lead to larger local errors (up to 45% error as compared with the actual luminance). There are, of course, two reasons that can, in part, account for such errors. The first one is practical and arises because we deliberately allow errors in rendering high luminance over small (localized) areas primarily to maintain global luminance coherence in the rendered HDR video. Thus, we can reduce some of those errors further by more “aggressive“ LED compensation at the cost of flickering artifacts. The second reason is theoretical and is due to the PSF of the LEDs. Specifically, the said errors are usually due to a very high brightness requested on a very small area. Because of the (relatively) low power and relatively high spread of the PSF of the LEDs, it is not physically possible to render such high luminance without turning on a large number of LEDs (this in turn will introduce significant errors in darker areas around brighter areas). Thus, a trade-off is what we aim to achieve in the proposed method especially when we are rendering HDR videos.

14.4 Assessing the Performance of a Dual Modulation Algorithm
Measuring the accuracy of a dual modulation algorithm is nontrivial and requires accurate luminance measurements. This is because the luminance of a point (pixel) on the screen depends both on the value of the pixel on the LCD panel at that location and on the value of the LED at this location. It also depends on the supply of light provided by LEDs that are in the vicinity. To that end, we conducted an experiment in which we measured the error between the actual luminance and the rendered luminance. This provides a scientific way of calibrating and benchmarking the performance of dual modulation methods. To keep the study tractable and possibly eliminate other factors, we chose to display a white square block against a dark background on the HDR display (we used a SIM2 Solar47 HDR display, which has a maximum displayable luminance of 4000 cd/m2). The idea was to measure the rendered luminance and compare it with the actual luminance of the said block. To account for the fact that HDR content can have local and global dark (or bright) areas, we varied the size of the block such that it fitted only a given percentage of the display height. The width of the block was kept constant. More specifically, the height of the block was varied from 10% to 100% of the display height. The error between the rendered luminance and the actual luminance was measured for each of the covered areas. We performed measurements were performed by varying the luminance between 0.1 and 4000 cd/m2 with a step factor of 100.2 = 1.584. However, the practical minimum luminance was 0.4 cd/m2 because our preliminary tests showed that the probe that we used was not accurate below this value.
The measured errors for the default method in the SIM2 display are shown in Fig. 14.7A, while the errors for the proposed method (optimized for images) are shown in Fig. 14.7B. We can see that our method reduces the error in the rendered luminance especially when the size of the square block is small as compared with the display height and at higher luminance values. This implies that our method allows better compensation between LEDs and the LCD panel at a local level. In other words, it can help to produce very bright areas over a small region, which is more difficult to achieve by the default SIM2 method (which is based on the baseline method presented by Seetzen et al., 2004). Finally, the errors for our method (optimized for videos) are shown in Fig. 14.7C, from which we can see that they are bigger than those for images (the reasons for this have already been discussed). Nevertheless, our method optimized for videos still leads to smaller errors than the default SIM2 method. Thus, our method can lead to a significant reduction in rendering error especially when there are localized high luminance areas in the HDR content. Obviously, this will help to exploit the real benefits of HDR via rendering higher contrast content.

14.5 Some Practical Lessons for HDR Content Rendering
So far, we have focused on describing and verifying the performance of the proposed dual modulation approach for HDR content rendering. In that context, it will be useful to outline a few practical aspects that could be beneficial for HDR content rendering. We list them in the following in no particular order of importance.
• HDR content adaptation: First, in HDR imaging one usually deals with proportional (and not absolute) luminance values. More specifically, unless there is a prior and accurate camera calibration, the luminance values in an HDR video file represent the real-world luminance up to an unknown scale.2 This, nonetheless, is sufficient for most purposes. Second, the HDR displays currently available cannot display luminance beyond the specified limit, given the hardware limitations. Therefore, the terms low dynamic range (LDR) and high dynamic range (HDR) are also sometimes referred to, respectively, as lower or standard dynamic range and higher dynamic range (to explicitly indicate that the range captured is only relatively higher than LDR but not the entire dynamic range present in a real scene). Although as a matter of convention we do away with such precise distinctions, it does highlight the fact that HDR content needs to be “adapted” according to display luminance limits before the dual modulation algorithm is used.
• Corrections: We also found that color and gamma correction played an important role in the quality of the rendered HDR content. Therefore, these should be carefully considered and implemented on the basis of the display characteristics and possibly the HDR content to be rendered. In other words, there is a need to perform calibration measures of the target display in order to apply proper corrections. If these are not done or are wrongly implemented, they can severely affect the rendering. This, in turn, may lead to loss of artistic intention, whose preservation is one of the key goals in HDR imaging (the keen reader is encouraged to refer to Chapter 17 for a more elaborate treatment of this topic).
• Importance of smooth PSF modeling of LEDs: In our experiments, we found that the PSF should exhibit smooth behavior and there should not be a discontinuity at the borders. Thus, we approximated it via a Gaussian mixture model, whose parameters we determined by fitting it to the real PSF values. The aim was to obtain a smooth (0 at the borders) model, otherwise the final division of HDR content by the light map can introduce visible artifacts. This is illustrated in Fig. 14.8, which shows the LCD images in two cases: one with a nonsmooth PSF (discontinuity when local bright and dark regions are located close to each other), and the other with a smoother PSF (modeled with a Gaussian mixture model). We have also highlighted the region (marked with red box; dark gray in print versions) where the nonsmooth PSF can cause distortions due to a discontinuity. In contrast, a smoother PSF can avoid such errors.

• Flickering issues for videos: Although we have already discussed this issue in detail, we believe it deserves to be reiterated as it is important in the context of HDR video rendering (consumer applications of HDR will typically involve video and not images). The underlying cause of such flickering in video that we observed is due to unequal response times of LEDs and the LCD. As a consequence, video signal rendering could be from unsynchronized sources, leading to luminance incoherency in successive frames. It follows that we cannot allow big changes in the way we split luminance information (thus we used 0.5 as the power value for equal splitting). As noted before, this can cause larger errors in rendering localized high luminance areas but prevents flashes during viewing of the rendered HDR video. The reader will also recall that we disabled and modified a few steps in the proposed method when optimizing it for videos to prevent flickering. To help the reader further visualize the impact of the unequal response time of LEDs and the LCD, Fig. 14.9 shows the LED light maps obtained for two consecutive video frames (of source content 1). The LED maps shown in Fig. 14.9A and B were obtained by our method optimized for images, while those in Fig. 14.9C and D correspond to the setting when our method was optimized for videos. We have also highlighted (through red boxes; dark gray in print versions) two areas where sharp changes in the LED maps can be noticed even though they correspond to two consecutive video frames (and hence the transition should be smoother). Such localized and sharp changes can introduce flashing when the rendered video is viewed on the HDR display. In contrast, the LED maps shown in Fig. 14.9C and D do not exhibit such incoherent changes between successive frames and hence avoid flickering in the rendered HDR video.
• Predicting display behavior: Backlight dimming algorithms can be viewed as a sort of (simple) screen modeling algorithms. For instance, in the proposed method we can reconstruct the rendered signal by using the LED light map and LCD-compensated pixel values. Thus, as demonstrated in this chapter, we can predict local errors or luminance fidelity. This can be helpful for further optimization or modifications that can improve rendering (this will obviously increase the complexity and execution time of the resultant algorithm). Another important advantage of a dual modulation method such as ours is that one can predict the power consumption of the display for a particular content. This can, in turn, allow display optimization from the view point of energy saving, which is a important dimension in today’s display systems in the light of recent enforcement of regulations limiting the allowed power consumption for television sets in several countries (European Commission, 2009).
• Display limitations: It is worth pointing out that the current LED-based HDR screens are not perfect. This is primarily due to the low resolution of the backlight (LED array). This may limit the capabilities of displays to reproduce very bright or very dark scene details, although Seetzen et al. (2004) noted that is not always a problem. Regarding the LCD panel, full-high-definition resolution may be enough for currently available HDR content, but there is always room for improvement, especially in light of technologies such as ultra high definition. We found that global light leakage can be more important than what could be expected from a single PSF of the LEDs (due to possible interaction of LEDs).
• Step toward backward compatibility: The HDR dual modulation algorithm results in two signals: the LED map and the LCD panel pixel information. The LCD image can be considered as a tone-mapped version of the HDR content. Thus, it can be compressed by any legacy coder and the LED map could be transmitted in a lossless fashion. This can provide an alternative approach to HDR video compression. Of course, this approach can be limited by the fact that the LED map and the LCD image are typically display dependent (eg, PSF of the LEDs).
14.6 Concluding Remarks and Perspectives
HDR content visualization is nontrivial (unlike the case of LDR content visualization, which requires minimal or no processing of the content to be displayed). The reason is that the current HDR display technology cannot render the entire luminance range present in the real world. As a result, HDR content needs to be properly adapted before it is rendered. Such rendering requires care since it can affect the level of detail rendered as well as the immersive experience. One approach to HDR content rendering is dual modulation. As the name implies, dual modulation allows the separation of the HDR content into an LED map and an LCD image. We have described one such method that we developed for HDR content rendering. This was based on our addressing some of the issues with the existing HDR baseline method. In particular, we used the generalized power law for luminance splitting, which allows greater flexibility in terms of the adjustment of the luminance split depending on the type of content to be rendered. This lead to two versions of the proposed method: one optimized for images and the other optimized for videos. The latter version is necessary to avoid flickering issues in HDR video rendering. We also compared the rendering error due to the proposed method with that due to the default method in a SIM2 display and found that it reduces the error both for images and for videos. We also outlined a few practical lessons that would be useful for HDR content rendering.