
Quality of Experience and HDR
Concepts and How to Measure It
M. Narwaria*; M.P. Da Silva*; P. Le Callet*; G. Valenzise†; F. De Simone†; F. Dufaux† * University of Nantes, Nantes, France
† Telecom ParisTech, CNRS LTCI, Paris, France
Abstract
The emergence of high dynamic range (HDR) is widely seen as an important step toward improving the quality of experience (QoE) of the end users. The concept of HDR QoE is, nonetheless, multi-faceted and comprises of dimensions such as immersiveness, perceptual fidelity, naturalness, etc. These dimensions are prone to be affected during the processing of HDR videos along the delivery chain and as a result affect the QoE of the end user. Thus, this chapter first identifies few key dimensions (components) in HDR QoE and then discusses the impact of HDR processing on few of them. In particular, we find that operations such as tone mapping (and inverse tone mapping) can alter the artistic intent of HDR content, and thus need to be considered in the design and development of HDR video processing algorithms.
Keywords
Tone mapping; Inverse tone mapping; Quality of experience; Visual attention; Perceptual fidelity; Naturalness
16.1 Introduction
Humans perceive the outside visual world through the interaction between light energy (usually measured in candelas per square meter) and the eyes. The luminance creates a sensation which helps us to recognize different aspects of the scene, including brightness levels, contrast, color, and motion. Pertaining to the luminance levels found in the real world, direct sunlight at noon can be on the order of in excess of 107 cd/m2, while a starlit night can be on the order of 10−1 cd/m2. This corresponds to more than eight orders of magnitude. Thus, there is a large range of luminance present in different real-world scenes. The human eye also has the remarkable capability to perceive a large dynamic range (about 13 orders of magnitude), especially with sufficient adaptation time (Mather, 2006). An intuitive example of adaptation is when we arrive in a low-lit room on a sunny day. We cannot immediately perceive the visual data in the room and it takes a few minutes before we become accustomed (adapted) to the new luminance levels. In contrast, the instantaneous (ie, without adaptation) human vision range is smaller and the eyes are capable of dynamically adjusting so that a person can see about five orders of magnitude throughout the entire range. However, conventional display devices cover only up to three orders of magnitude. Consequently, the scenes viewed on typical low dynamic range (LDR) displays have lower contrast and a smaller color gamut than what the eyes can perceive. This leads to loss of visual details and in some cases can even lead to misrepresentation of the scene information. To overcome such limitations, high dynamic range (HDR) has recently gained popularity in both academia and industry. By representing the scene in terms of physical luminance information, HDR can achieve very high contrasts and a wider color gamut, in effect matching the human instantaneous vision range. Because it allows more scene information to be represented, HDR helps to capture very fine details which are otherwise difficult to retain with traditional photography. This leads to better visual experience for viewers, and this is particularly relevant in the context of the recent paradigm shift toward quality of experience (QoE)-based multimedia signal processing.
Such QoE-driven multimedia systems have increasingly come into focus in recent years, from both research and industry perspectives. The aim is to capture the end users’ aesthetic expectations rather than simply to deliver content based on a technology-centric approach. As discussed, given the specific characteristics of HDR, it is one of the exciting fields toward providing end users with a more immersive and realistic viewing experience. As a result, HDR imaging is widely seen as an attractive alternative to improve the viewing experience of users in terms of more realistic content delivery. In light of this, it is important to define and quantify the user QoE in a more holistic fashion by our taking into account the relevant factors. This chapter focuses on discussing some of them and highlighting their role in HDR QoE.
QoE is a term that is especially relevant in the context of immersive communication technologies such as HDR imaging. According to a White Paper (Callet et al., 2013), QoE is defined as “the degree of delight or annoyance of the user of an application or service. It results from the fulfillment of his or her expectations with respect to the utility and/or enjoyment of the application or service in the light of the user’s personality and current state.” This definition includes several complex factors that contribute to the QoE in a specific application scenario. In a similar way, HDR QoE can include several dimensions. Thus, the HDR viewing experience should be viewed in the light of a broader framework rather than just signal fidelity. More specifically, perceptual fidelity has often been used as a proxy for QoE in many LDR video processing applications. Fidelity is defined as the measure of “closeness” of a processed image/video to its source. By definition, this imposes limits on the expectation and/or enjoyment of the end user based only on the characteristics of original source content. Such a narrow approach can fail in many cases; for instance, a processed content can possibly appear better despite its low fidelity with source content (eg, in the case of contrast enhancement, color correction/enhancement). Clearly, replacing QoE with just fidelity is an oversimplification because the user experience is much more complex and depends on several factors, including emotions, aesthetics, the surroundings, and the application scenario. With next-generation video technologies, the inadequacies of a fidelity-based QoE will be more apparent. Thus, fidelity should ideally not be substituted for QoE; rather, it is one of the several components/dimensions. Other factors include immersiveness, glare, naturalness, color, context of visual details (Narwaria et al., 2014a), and visual attention. In the next section, we elaborate on these dimensions.
16.2 Dimensions in HDR QoE
As pointed out in the introduction, defining and measuring HDR QoE is a multidimensional problem. In this section, we discuss some of the most prominent aspects that HDR QoE comprises.
• Immersiveness: The first and probably the most attractive feature of HDR is the immersiveness that it can offer. This is enabled because HDR imaging aims to overcome the inadequacies of the LDR capture and display technologies via better video signal capture, representation, and display so that the dynamic range of the video can better match the instantaneous range of the eye. In particular, the major distinguishing factor of HDR imaging (in comparison with traditional LDR imaging) is its focus on capturing and displaying scenes as natively (ie, how they appear in the real world) as possible by considering the physical luminance of the scene in question. This allows the capture and display of intricate scene details and a wider color gamut, which can enhance the realism of the captured scene, and allows the user to be more involved (immersed) in video viewing. Obviously, the concept of depth (as in three-dimensional video) and higher resolutions (eg, ultra high definition) could possibly be added to HDR imaging. Therefore, the degree or extent to which the user gets involved (or immersiveness) is probably the most important dimension in HDR QoE.
• Perceptual fidelity: As pointed out previously, fidelity is another component of HDR QoE. In the light of HDR video representation, the concept of perceptual fidelity is based on (relative) luminance values, and will thus involve models that can account for the relatively higher luminance conditions. Specifically, perceptual fidelity in HDR imaging should be based on visual details, color, and naturalness among other aspects. Thus, fidelity in HDR imaging by itself is expected to be a more complex.
• Visual attention: One of the key thrusts of HDR imaging is to preserve artistic intention. Artistic intention in simple terms refers to the message that the artist intends to convey through the photograph/video. This can involve the creation of focal points or regions of interest where the viewer should ideally look when viewing the content. Because HDR imaging provides a bigger scope in terms of providing more accurate visual details and colors, it would be useful in conveying more precise scene information to the viewer. Visual attention, which is the ability of humans to focus on certain regions of the scene, is therefore a useful tool toward capturing eye movements and thereby providing valuable information on the visually important (salient) regions in the content. Obviously, the visual attention behavior ideally should be the same for both processed and original content.
• Glare: Because HDR viewing involves much higher luminance in comparison with LDR viewing, the phenomenon of glare will be more apparent and needs consideration. Glare is a sensation when the emitted luminance exceeds the value at which the eyes are adapted at that point in time. It follows that glare will depend not only on the magnitude of emitted luminance but also on the angle between the light source and eye level, in addition to the eye adaptation level. The glare effect also strongly depends on the content. Thus, measurement of the glare and analysis of its impact on the viewing experience will be necessary to quantify the HDR QoE more accurately.
• Naturalness: Naturalness is a typical feature of visual content. Its genesis lies in the premise that our visual system is adapted and used to processing a sensory input from real-world scenes. Thus, content that would appear similar to the adapted model will be natural. It is, of course, nontrivial to quantify naturalness on the basis of such an abstraction, and it is a highly subjective phenomenon. As HDR imaging aims to replicate the visual scene information as natively as possible, original or unprocessed HDR content is expected to be highly natural. The subsequent processing may, however, affect this and is therefore an important component in quantification of the HDR QoE.
The above-mentioned dimensions are by no means exhaustive but are probably the most prominent ones with typical use cases and applications. Also, these dimensions are not necessarily independent. Thus, loss of fidelity could decrease naturalness or a change in visual attention behavior need not directly affect the naturalness. This, in turn, implies that careful considerations are needed in order to accurately quantify these dimensions with both subjective and objective approaches.
Processing of HDR content during different stages of a typical HDR delivery chain is likely to alter one or more of the mentioned dimensions and hence affect the QoE. Thus, each HDR content processing module should be developed in a more QoE-aware fashion so that the artistic intent is rightfully conveyed to the end user. Because most existing technologies (including processing and display) were designed for LDR content, there is a need to extend them for use in the HDR domain, and at the time of writing work on this is ongoing. For instance, there have been recent efforts within the Moving Picture Experts Group (MPEG) to extend High Efficiency Video Coding (HEVC) to HDR. Likewise, the JPEG has announced extensions that will feature the original JPEG standard with support for HDR image compression. Such efforts typically seek to use legacy coders by range reduction (formally referred to as tone mapping) of the HDR video and then use additional transformations to obtain a compressed HDR signal. Further, tone mapping is needed to render and visualize HDR content on LDR displays. Even the existing HDR displays cannot accommodate the entire luminance range/contrast ratios found in the real world. Thus, it is more accurate to mention that both HDR and LDR displays require tone mapping although the nature and extent of such mapping can be different in the two cases. Thus, tone mapping is one of the key operations that will be required both to extend existing video processing tools to HDR and for visualization. Apart from this, processing-related artifacts (eg, codec induced distortions) will affect HDR QoE.
The next important issue is that of measuring HDR QoE. To that end, subjective viewing tests remain the most reliable and accurate given appropriate laboratory conditions and a sufficiently large subject panel. Although an objective approach (use of a computational model) could also be used, it may not always mimic the subjective opinion. Therefore, in the next section, we discuss a few important aspects in subjective assessment of HDR QoE.
16.3 Measuring HDR QoE: A Few Considerations
Subjective test results are considered gold standards when human factors are involved in evaluating and testing algorithms. HDR subjective tests serve the same purpose as traditional LDR subjective tests but there are some differences worth highlighting.
16.3.1 Effect of Display
While HDR values are related to the actual scene luminance, they are typically not equal to it. Thus, unless there is a camera calibration, the HDR values represent the real-world luminance up to an unknown scale. Because the maximum luminance can vary for each scene, there is no fixed white point in this case. So HDR values must be interpreted on the basis of the display used to view the HDR video (this is in contrast to the case of LDR, where the white point is fixed; eg, for an eight-bit representation, the maximum value is fixed at 255 irrespective of the actual maximum luminance). This also introduces the need to carefully preprocess the HDR stimuli before they are displayed on the HDR display. HDR displays typically have a front liquid crystal panel and a backlight array of LEDs, so controlling the signals sent to these provides an effective way to control the output on the HDR display. Thus, with HDR there can possibly be a higher impact of the way the HDR stimuli are ultimately displayed. In contrast, there are no (or minimal) such considerations in the LDR case for most applications.
16.3.2 High Luminance Conditions and Visual Discomfort
The most important distinction between HDR and LDR is with respect to the luminance range (which in turn leads to HDR). Traditional LDR has a white point which depends on the maximum displayable luminance and contrast ratio (both are usually insufficient to accurately render real-world scenes considering typical LDR displays). Moreover with LDR, the pixel values are typically gamma encoded and perceptually uniform. As a result, a change in the pixel values can be directly related to the change in visual perception. However, with HDR there is more flexibility and one can accurately represent the real luminance (generally up to an unknown scale factor). Consequently, there is no fixed white point in HDR that can correspond to the maximum luminance (as it can vary from scene to scene). There is only brighter (or darker) scene intensity. Of course, in practice, we still need to define a white point for rendering content on HDR displays (because of hardware limitations) but it is typically much higher than in the LDR case. Therefore, HDR viewing will involve higher levels of brightness, in general. Because human vision is sensitive to the luminance ratio (rather than absolute luminance), changes in the luminance may not necessarily lead to the same change in visual perception of HDR. High luminance can also be a source of visual discomfort for observers and should be carefully tackled. Because the HDR display luminance is relatively much higher (eg, the SIM2 Solar HDR display1 has a maximum displayable luminance of 4000 cd/m2) than that of conventional display devices, much higher background illumination is needed to reduce the visual discomfort of observers. Improper settings can result in glare, leading to maladapted viewing conditions. For HDR, there are currently no standard illumination settings. Recommendation ITU-R BT.500-13 recommends the illumination should be approximately 15% of the peak display luminance. With an HDR display, this means approximately 600 cd/m2. But given the reduced sensitivity of the human eye at high luminance, values typically in the range of 150–200 cd/m2 were found to be adequate in our tests (Narwaria et al., 2014d).
16.3.3 Observers
The general conditions of the LDR domain apply (eg, the observers should not have been involved in setting up the experiment, the observer panel is sufficiently large). Because most observers may not be familiar with how an HDR video appears, specific instructions should be provided to the observers especially when the task is to compare HDR and LDR stimuli. A training session for observers can therefore assume more importance in some cases for HDR subjective tests.
16.3.4 Viewing Conditions
The display resolution should ideally be full high definition or greater so that the immersive experience offered by HDR is not compromised by screen resolution. The viewing distance and angle should follow similar guidelines as for the LDR domain (eg, viewing distance of three times the active screen height in case of high definition).
16.3.5 Source Content Selection
While the general considerations of LDR (such as spatial and temporal information) apply to HDR, there is an additional factor of dynamic range. For example, scenes with different dynamic range must be selected to challenge the algorithm under consideration. The classical definition of dynamic range (ratio of maximum and minimum luminance) can be used but it is important to remember that it may suffer from drawbacks such as susceptibility to outliers and can be misleading in some situations (eg, a tiny patch of very dark and bright pixels can increase the dynamic range). More sophisticated and recently proposed solutions (eg, the solution by Narwaria et al., 2014b) could also be used as an alternative index for source content selection based on certain perceptual considerations. Thus, HDR source video selection is a three-dimensional problem (with spatial, temporal, and dynamic range as factors) although the spatial information may possibly be combined with dynamic range.
16.3.6 Paired Comparison Tests in an HDR Setting
Care must be taken that the HDR stimuli to be compared are at same (or similar) luminance levels. Thus, comparing two stimuli from different source content via paired comparison can be tricky especially for videos, where the luminance could vary greatly over time. Studying the impact of tone mapping is an interesting use case where observers watch both HDR and LDR stimuli simultaneously. Because the peak brightness of the displays can be very different, arriving at a comfortable illumination level is not easy. An alternative is to use higher illumination around the HDR display, while the diffused light can act as the illumination source for the LDR display. Paired comparison is generally assumed to be more effective as the observers have an easier task. Given the luminance considerations in HDR imaging, this calls for greater care in setting up a subjective experiment.
16.4 Impact of Tone Mapping Operators on QoE Dimensions
Tone mapping operators (TMOs) play an important role in HDR content processing as well as visualization. Hence, evaluation of their impact on different dimensions such as visual attention, fidelity, naturalness, and color is necessary.
TMOs can be broadly classified into two categories — namely, local operators and global operators. As the name implies, local operators use a spatially varying mapping which depends on the local image content. In contrast, global operators use the same mapping function for the whole image. Chiu et al. (1993) introduced one of the first local TMOs by using a local intensity function based on a low-pass filter to scale the local pixel values. The method proposed by Fattal et al. (2002) is based on compression of the magnitudes of large gradients and solves the Poisson equation on the modified gradient field to obtain tone-mapped images. Durand and Dorsey (2002) presented a TMO based on the assumption that an HDR image can be decomposed into a base image and a detail image. The contrast of the base layer is reduced by an edge-preserving filter (known as the bilateral filter). The tone-mapped image is obtained as a result of multiplication of the contrast-reduced base layer with the detail image. Drago et al. (2003b) adopted logarithmic compression of the luminance values for dynamic range reduction in HDR images. They used adaptively varying logarithmic bases so as to preserve local details and contrast. The TMO proposed by Ashikhmin (2002) first estimates the local adaptation luminance at each point, and this is then compressed with a simple mapping function. In the second stage, the details lost in the first stage are reintroduced to obtain the final tone-mapped image. Reinhard et al. (2002) applied the dodging and burning technique (traditionally used in photography) for dynamic range compression. A TMO known as iCAM06 (Kuang et al., 2007a) has also been developed. It is based on the sophisticated image color appearance model (iCAM) and incorporates the spatial processing models in the human visual system for contrast enhancement, photoreceptor light adaptation functions that enhance local details in highlights and shadows. With regard to global TMOs, the simplest one is the linear operation in which the maximum input luminance is mapped to the maximum output value (ie, maximum luminance mapping) or the average input luminance is mapped to the average output value (ie, average luminance mapping). Another global TMO was proposed by Greg (1994) and focuses on the preservation of perceived contrast. In this method, the scaling factor is derived from a psychophysical contrast sensitivity model. Tumblin et al. (1999) have reported a TMO based on the assumption that a real-world observer should be the same as a display observer. The list of TMOs mentioned here is by no means exhaustive and the keen reader may refer to existing work for more details on the topic.
16.4.1 Effect on Perceptual Fidelity
It is worth pointing out that for assessment of the impact of TMOs, one can choose different test settings. These include the following:
• Evaluation with a real-world reference: This typically involves the use of a real scene as a reference. This is probably ideal because the source content in this case is absolutely unprocessed. However, such a setup is hardly practical because luminance conditions can change dramatically, especially in the case of outdoor scenes. This coupled with the fact that there will be incoherent motion of objects within the scene, potentially reducing its utility. It can, nevertheless, be used in controlled laboratory conditions with static images.
• Evaluation with a reference on an HDR display: This is probably the more scientific approach in terms of comparing tone-mapped content with an HDR reference. However, it should always be kept in mind that even HDR monitors cannot display the entire range of real-world luminance and require range reduction (tone mapping). So, the reference is not entirely pristine but is generally of higher visual quality than an eight-bit tone-mapped version.
• Evaluation without a reference: This is the most straightforward method. The advantage lies in its simplicity and it not requiring an HDR display. Such a method will, however, typically measure the preference on the basis of only the tone-mapped content. This may lead to a larger subjectivity in the results obtained.
Thus, depending on the requirements, one of the above methods can be used to evaluate the impact of TMOs. The studies in the literature used one of the mentioned settings to measure the fidelity of the tone-mapped HDR content subjectively. We first briefly describe some of the existing studies related to subjective evaluation of TMOs.
The psychophysical experiments performed by Drago et al. (2003a) aimed to evaluate six TMOs with regard to similarity and preference. Three perceptual attributes — namely, apparent image contrast, apparent level of detail (visibility of scene features), and apparent naturalness (the degree to which the image resembled a realistic scene) — were investigated. It was found that naturalness and details are important attributes for perceptual evaluation of TMOs. In the study by Kuang et al. (2007b) three experiments were performed. The first one aimed to test the performance of TMOs with regard to image preference. For this experiment, 12 HDR images were tone-mapped with six different TMOs and evaluation was done by the paired comparison method. The second experiment dealt with the criteria (or attributes) observers used to scale image preference. The attributes that were investigated included highlight details, shadow details, overall contrast, sharpness, colorfulness, and the appearance of artifacts. The subsequent regression analysis showed that the rating scale of a single image appearance attribute is often capable of predicting the overall preference. The third experiment was designed to evaluate HDR rendering algorithms for their perceptual accuracy of reproducing the appearance of real-world scenes. To that end, a direct comparison between three HDR real-world scenes and their corresponding rendered images displayed on an LDR LCD monitor was used. Yoshida et al. (2005) conducted psychophysical experiments which involved the comparison between two real-world scenes and their corresponding tone-mapped images (obtained by the application of seven different TMOs to the HDR images of those scenes). Similarly to other studies, this study also aimed at assessing the differences in how tone-mapped images are perceived by human observers and was based on four attributes: image naturalness, overall contrast, overall brightness, and detail reproduction in dark and bright image regions. In the experiments conducted by Ledda et al. (2005), the subjects were presented with three images at a time: the reference HDR image displayed on an HDR display and two tone-mapped images viewed on LCD monitors. They had to choose the image closest to the reference. Because an HDR display was used, factors such as screen resolution, dimensions, color calibration, viewing distance, and ambient lighting could be controlled. This is in contrast to the use of a real-world scene as a reference, which might introduce uncontrolled variables. Ledda et al. (2005) also reported the statistical analysis of the subjective data with respect to the overall quality and to the reproduction of features and details. Differently from the previously mentioned studies, Cadik et al. (2008) adopted both a direct rating (with reference) comparison of the tone-mapped images with the real scenes and a subjective ranking of tone-mapped images without a real reference. They further derived an overall image quality estimate by defining a relationship (based on multivariate linear regression) between the attributes: reproduction of brightness, color, contrast, detail, and visibility of artifacts. The analysis further revealed that contrast, color, and artifacts are the major contributing factors in the overall judgment of the perceptual quality. However, it was also argued that the effect of attributes such as brightness is indirectly incorporated through other attributes. Another conclusion from this study was that there was agreement between the ranking (of two tone-mapped images) and rating (with respect to a real scene) experiments. In contrast to this last observation, Ashikhmin and Goyal (2006) found that there were significant differences in subjective opinions depending on whether a real scene is used as a reference or not. Narwaria et al. (2014c) studied the impact of TMOs in HDR image compression and found that the visual quality of compressed HDR content can be significantly modified by TMOs. A recent survey evaluating TMOs for HDR video can be found in Eilertsen et al. (2013).
Most of these studies either ranked the TMOs on the basis of the performance in the respective subjective experiments or outlined the factors affecting visual quality of the tone-mapped content. However, it might be misleading to generalize the results from these studies because the number of HDR stimuli was limited. Nevertheless, all of them establish beyond doubt that tone mapping (of both still images and videos) not only tends to reduce the visual quality but also affects the naturalness of the processed HDR content (in addition for video stimuli there could be visible temporal artifacts). Because the underlying philosophy of TMOs is concerned with reducing the range, they inevitably saturate visual information, leading to loss of details.
16.4.2 Visual Attention Modification
It is well known that human eyes tend to focus more on certain areas in an image/video than others, and therefore possess a remarkable ability to find and focus on relevant information (within a given context) quickly and efficiently (Rensink, 2006). To study this phenomenon, a saliency map is generally obtained as a two-dimensional representation to reveal the locations where an average human observer tends to look when viewing the scene (this is done with an eye tracker). In the context of QoE, eye tracking is a free-viewing task — that is, the observers are instructed to watch the scene as they would in a natural setting without their having to do any other task (this encourages attention tracking mainly based on bottom-up behavior).
To begin the analysis for visual attention, we recall that TMOs tend to destroy visual details by damaging contrast (local and global). This means that the regions that may have been salient (attracted eye attention) in the HDR content may become nonsalient. Conversely, a TMO might introduce a false edge or structure and may create salient areas in the tone-mapped content which were absent in the original HDR content. Hence, the artistic intention can be modified by TMOs (Narwaria et al., 2014d). To visually exemplify this, we consider Fig. 16.1. The images in Fig. 16.1A–D are the tone-mapped versions of the HDR image processed by the TMO of Drago et al. (2003b) and iCAM06 (Kuang et al., 2007a) and the corresponding human priority maps (visual attention maps), respectively. It can be seen that the two “red mats” (highlighted by red boxes; dark gray in print versions) are more clearly visible in the image processed by iCAM06 because there high contrast is preserved in and around that region. Consequently, one can see from the corresponding visual attention map that these indeed are salient regions for human observers. On the other hand, in the image processed by the TMO of Drago et al. (2003b) there is much lower contrast in the said regions. As a result, these attract much less eye attention as seen in the corresponding visual attention map. A second set of examples is shown in Fig. 16.1E–J. Fig. 16.1E–G shows three tone-mapped versions of an HDR image (tone mapped by the TMO of Tumblin et al. (1999), iCAM06, and a linear TMO), while the corresponding visual attention maps are shown below them in Fig. 16.1H–J. Again, one finds that the “orange spot” (highlighted by the red box; dark gray in print versions) is a salient region only in the case of the linear TMO (see the visual attention map in Fig. 16.1J) because this TMO destroys contrast in other regions, which makes the “orange spot” stand out and thus eye-catching. As opposed to this, the TMO of Tumblin et al. (1999) and iCAM06 provide much better contrast in other parts of the image as well. So the “orange spot” is nearly nonsalient in these two images as the observers’ attention is attracted to other parts.

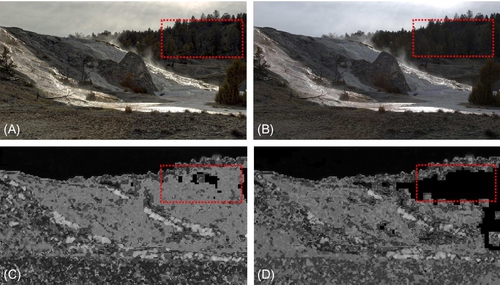
Tone mapping can also be viewed in terms of reduced signal contrast due to tone mapping. With the reduced contrast, regions that may have attracted the observers’ attention in the HDR content might be reduced. As a direct consequence, the number of salient regions in tone-mapped HDR content tend to decrease. To visually exemplify this, consider Fig. 16.2, where Fig. 16.2A shows a tone-mapped version (obtained with the TMO of Reinhard et al. (2002)) of an HDR image. In this image, we can easily identify the foreground (mainly comprising the headlight and front wheel of the motorbike) and the background (bicycles and the door). Fig. 16.2B shows the visual attention map of the image in Fig. 16.2A, while the HDR visual attention map is shown in Fig. 16.2C. Observe how the visual attention map in Fig. 16.2B indicates very few salient points in the background. As opposed to this, the HDR visual attention map shows that the background also had regions which attracted eye attention. The reason is obvious: tone mapping in this case destroys details mainly in the background but the foreground is fairly well preserved in terms of contrast. As a result, the number of salient points in the background reduce drastically. The last visual example is shown in Fig. 16.3. Fig. 16.3D–F shows the visual attention maps corresponding to the images shown in Fig. 16.3A–C. Because the HDR image does not display properly, we have shown the image processed by iCAM06 (instead of the original HDR image) for the sake of explanation. Also note that we have used a green box to highlight the area(s) that attracted maximum human attention and a blue box for area(s) with relatively lower attention.


Considering the HDR visual attention map in Fig. 16.3D, we see there are four main regions which are salient according to human observers. These have been highlighted by rectangular boxes at the corresponding image locations in Fig. 16.3A. Notice that the “outside area seen through the door” attracts more attention that the other three identified regions. Now we observe the effect of tone mapping on these four identified regions. We find that the image processed by the TMO of Ashikhmin (2002) (Fig. 16.3B) shows that now there are two regions (highlighted by the two middle rectangular boxes) which attract the maximum attention (see the corresponding visual attention map in Fig. 16.3E). Thus, tone mapping modified the visual signal in such a manner that a region which was less salient in the original HDR content has become more salient. Likewise, looking at the visual attention map in Fig. 16.3F, we find that there is only one region that now attracts maximum attention (this is marked by the rightmost rectangular box in the image in Fig. 16.3C), while the attention for other regions reduced considerably. Thus, tone mapping can change attentional regions in addition to increasing or decreasing the magnitude of attention. The eventual result is that a nonattentional region in the HDR image becomes an attentional one in the tone-mapped version. The opposite case is that in which structural information is destroyed by tone mapping. In such cases, an attentional region in the HDR image becomes less important (or less eye-catching) in the tone-mapped image. For example, a contrast that was visible in the HDR image becomes invisible in the processed image (loss of visible contrast).
Video signals differ from images because of the addition of a temporal dimension in addition to the spatial one. Given this, it is interesting to analyze the changes in visual attention behavior caused by tone mapping of HDR video sequences. The analysis of the visual attention maps from different video stimuli leads to similar conclusions as for still images. That is, TMOs have a large impact on the visual attention behavior as compared with the HDR video. We present an example in Fig. 16.4. This is from the video sequence2 “Tunnel1,” in which a car is shown to enter a tunnel (with normal traffic). Inside the tunnel, there is relatively lower illumination and so as the car enters it, there is a large change in scene illumination. Fig. 16.4A shows the car inside the tunnel and another car just behind it which also enters the tunnel. Before this time, we found that car was the main region of the subjects’ attention from the start of the video. However, when the other car enters the frame from behind, it attracts the subjects’ attention. This is expected because the entry of the new car in the frame is a “new” or a “rare” event (up to this point the subjects’ attention is focused on the first car only). That directs the attention to the second car. This is what was observed when the HDR video was viewed on an HDR screen. The corresponding HDR visual attention map is shown in Fig. 16.4B, where one can see that the “second” car is the main region of attention. However, when tone-mapped video was shown to the subjects, we observed different behavior. In this case, it was found that the first car still remains the main focus of attention. This can be clearly observed in the visual attention map corresponding to the TMO of Tumblin et al. (1999) shown in Fig. 16.4C. That is, despite the occurrence of a new event (the entry of the second car), attention behavior did not change. We can attribute this to the fact that the TMO of Tumblin et al. (1999) could not maintain proper contrast at the tunnel entrance, where there is a large change in intensity (dark inside the tunnel and bright outside it). Because of this, the subjects’ attention was not fully diverted toward the second car. A different observation was, however, made for in case of the TMO of Durand and Dorsey (2002). This TMO could maintain relatively better contrast at the tunnel entrance. Because of this, we have a situation where both the first car and the second car became the regions of attention. This can be seen from the visual attention map shown in Fig. 16.4D. Thus, depending on the TMO, we have different visual attention behavior for the same scene in the video. This suggests that similarly to the case of still images, tone mapping changes visual attention behavior over time.

16.4.3 Impact on Other Aspects
Apart from fidelity and visual attention behavior, TMOs may also alter naturalness and modify color/luminance rendering (Narwaria et al., 2014a). This can lead to a quite different appearance of the tone-mapped content in comparison with the unprocessed reference HDR content. The most reliable approach to find the impact of TMOs on these dimensions is also via subjective studies where supplementary feedback can be taken from the observers. Also, in this case, it is more beneficial to provide the observers with an HDR reference for comparison. This is because in many cases the tone-mapped content would be preferred even though it may not have the same naturalness or color as the reference content. However, as noted before, such a setup will require two luminance conditions. This is shown in Fig. 16.5, where the reference content is displayed on an HDR display and the LDR content is displayed on either side of it.

Because there are two types of displays, the room illumination should be adjusted. In particular, with the HDR display (brighter) in the center, the illumination at the center (just above the HDR monitor) should be higher. Such a setup ensures a more suitable illumination setting for observers. To obtain observer preference, the next step is to select an appropriate method. Because these tests are not directly related to artifact visibility, the paired comparison method is typically more appropriate. The observers need to be instructed clearly. This can, for instance, be “Please choose the image (left or right) that is more similar to the reference image (center).” The observers can also be asked their reason for discarding the nonselected image. The question can be “Why did you discard this image?” To answer this, certain choices need to be provided, which can depend on the characteristic that is being tested. For example, the observers can be given three choices: low fidelity of colors/luminance, loss of details, and lack of naturalness. Because all the observers are generally naive for the purposes of the study (not experts in image or video processing), the physical meaning of each of these choices should be described in detail on a separate sheet during the experiment.
In one of our studies (Narwaria et al., 2014a), we found that the context of visual details is crucial. In other words, merely preserving details is not enough, and their location in the scene can play a role. To illustrate this point, an example is given in Fig. 16.6; the local sharpness maps of two tone-mapped LDR stimuli are shown in Fig. 16.6C and D. Both these images were almost equally preferred by the observers. In the local sharpness maps, brighter color implies more sharpness. In these images, we have also highlighted (by a red box; dark gray in print versions) a local area where more details have been preserved by iCAM06 in comparison with the single-exposure content. One can see that the highlighted area belongs mainly to the background. As a result, the presence of more details was less or not noticed by an average observer. Therefore, the local context of where details appear is more important. Apart from that, the appearance of the details themselves (eg, unrealistic or overenhanced details) can affect user preference.
Another dimension that can be affected by TMOs is naturalness. The goal of a TMO is not only to preserve details but also to maintain the overall contrast and appearance. However, most TMOs tend to trade off one at the expense of the other. In other words, preserving local details aggressively can make the content appear more unnatural, while overall appearance preservation will come at the expense of details. An example is shown in Fig. 16.7, where the image in Fig. 16.7A appears more natural despite the loss of details in the background. In contrast, the image in Fig. 16.7B has more details preserved but the trees in the foreground appear overcontrasted, thus contributing to an unnatural appearance.

TMOs may also alter HDR scenes in a way that the information provided may change. For instance, depending on the contrast and color, an evening scene may not appear that way to the observer because of the illumination reproduced by the TMO. In such cases, an HDR reference probably helps more because otherwise the tone-mapped versions may be preferred. We present an example in Fig. 16.8. The image in Fig. 16.8A was preferred if the HDR reference was provided. However, with the absence of a reference scene, the image in Fig. 16.8B was preferred, most probably for its colorfulness and details.

Before we conclude this section, it is worth reiterating that TMOs can affect HDR QoE by impacting one or more constituent dimensions. In particular, in this section we have we presented an analysis and discussion of the impact of TMOs on perceptual fidelity, visual attention behavior, naturalness, context of visual details, etc. Hence, TMO-based HDR content processing should consider these aspects so that the HDR QoE is not severely affected. Another operation that is sometimes used in HDR content rendering is that of inverse tone mapping, and its impact on QoE is discussed by a case study in the next section.
16.5 Case Study: Quality Assessment of Dynamic Range Expansion of Video Sequences
In this section we consider an example of how to set up a subjective study for HDR content, with a specific application scenario: the range expansion of video sequences for display on HDR reproduction devices.
HDR displays (Seetzen et al., 2004) are about to make their debut on the television market, and will probably become the most widespread television technology in the coming years, as they can reproduce far higher luminance and contrast levels than their LCD or CRT predecessors (see Chapter 14 for a description of HDR display technology). However, most of the existing image and video content is LDR and needs to be converted to HDR to be viewed on these displays. Dynamic range expansion, also known as inverse tone mapping, is the operation that enables this conversion (Rempel et al., 2007). Various expansion operators have been proposed (Banterle et al., 2006, 2008; Meylan et al., 2006, 2007; Rempel et al., 2007; Wang et al., 2007; Didyk et al., 2008; Huo et al., 2014; Kuo et al., 2012). Evaluating these techniques plays a key role in the design of new expansion operators and helps to improve the characteristics of HDR displays.
A few studies in the literature have compared the performance of expansion operators (Akyüz et al., 2007; Banterle et al., 2009; Masia et al., 2009). Assessing the quality of expanded HDR content is not simply a matter of fidelity to the original LDR, but entails complex and challenging aesthetic considerations, which are difficult to model in an objective quality metric. As a consequence, these studies are mainly based on subjective visual quality assessment experiments. While these studies have considered expansion of still images only, it has been conjectured that the very same expansion operators that produce visually pleasing results in the case of still images could perform poorly when applied to video, creating artifacts such as flickering (Banterle et al., 2008) or unnatural illumination behaviors on scene changes (Kuo et al., 2012). However, these conjectures have not been validated by any subjective studies designed specifically for video.
In the following, we describe a subjective study aimed at understanding whether existing expansion operators are adequate to support video, and, among existing algorithms, which of them yield the best visual results. We target the problem of real-time displaying of high-quality professional content, which is representative of a typical broadcasting scenario. Thus, expansion operators that cannot be run in real time, because of heavy processing or time-consuming off-line training, have been excluded from the comparison. The study starts with the selection of appropriate source LDR sequences, and representative expansion operators from the literature. Next, the actual study is designed and implemented, in this case as a pairwise comparison of videos, in order to rank four expansion operators of different algorithmic complexity, representative of the main approaches proposed so far. A complete description of this study can be found in De Simone et al. (2014).
16.5.1 Source LDR Content and Expansion Operators Considered
Several LDR video sequences, downloaded from YouTube, have been analyzed as potential test material to be included in the experiment. All the sequences considered had 4K spatial resolution, but we reduced them to high definition (1920 × 1080 pixels) to meet our display’s resolution. We focused on high-quality video footage: no visible compression artifacts are present, the content is well exposed, and has been filmed and postprocessed professionally (as in a typical broadcast scenario). Furthermore, no video presents visible compression artifacts. Differently from previous studies (Akyüz et al., 2007; Banterle et al., 2009), the selected sequences were natively LDR and no HDR ground truth was available. For each content, we computed the spatial and temporal indexes (ITU-T, 2008), which describe the spatial and temporal complexity of the content, as well as two luminance and contrast-related features: the image key (Akyüz and Reinhard, 2006), which gives a measure of the brightness of the image; and the Michelson contrast (Michelson, 1927), computed locally with a 32 × 32 pixel sliding window. On the basis of the semantic interest of each content and on the diversity of the considered characteristics, we selected the six video sequences shown in Fig. 16.9. Three additional video sequences, not reported here, were used to train the subjects. All videos have a duration of between 4.5 and 10 s, and except for “naples” and “tennis,” which have two scene changes; the rest of the sequences feature the same visual scene. We excluded longer sequences with several scene changes for two reasons. First, in a pilot test with expert viewers, we observed that scene changes did not influence the performance of the expansion operators considered. Second, the performance of expansion operators changes with the characteristics of the scene (eg, key, contrast), as discussed in Section 16.5.4. As a result, a video segment with multiple scenes would have time-varying quality, which complicates the subjective quality assessment task.

To produce the HDR videos, we considered four expansion operators, representative of the different approaches proposed in the literature. The algorithms include (uppercase letters are used in the rest of this chapter to refer to each algorithm) simple linear scaling3 of LDR values to meet the HDR display luminance range (A) (Akyüz et al., 2007); the highlight enhancement method of Meylan et al. (2007) (with ρ = 0.67) (M); the method based on the expand map of Rempel et al. (2007) (R); and the perceptual algorithm of Huo et al. (2014) (H).
16.5.2 Display, Test Environment, and Viewing Conditions
Expanded HDR videos were displayed on a SIM2 HDR47 display,4 which has HD1080 resolution with declared contrast ratio higher than 4 × 10⁶. Using a light probe, we verified the linear response of the monitor and measured a peak luminance of 4250 cd/m2 when 60% of the screen surface is white (the maximum luminance is lower when all the surface area is lit because of the power constraints of the device; see Chapter 14). ![]() cd/m2 was taken as the reference maximum display luminance for the four expansion operators. Display-referred HDR values for our screen are obtained by division of physical candela per square meter values by the luminance efficacy at equal-energy white (ie, by the constant factor 179).
cd/m2 was taken as the reference maximum display luminance for the four expansion operators. Display-referred HDR values for our screen are obtained by division of physical candela per square meter values by the luminance efficacy at equal-energy white (ie, by the constant factor 179).
We set up a test space with a midgray nonreflective background, isolated from external sources of light, as recommended in ITU-R (2012a,b). Differently from the conclusions reported by Rempel et al. (2009), we assessed during a pilot test that viewing sessions longer than a few minutes in a completely dark environment might cause visual fatigue. Therefore, we placed a lamp at a color temperature of 6500 K behind the HDR screen to ensure ambient illumination while avoiding the presence of any direct light source (apart from the HDR display) in the field of view of the user. The resulting ambient light measured in front of the screen, when this is off, was approximatively 10 cd/m2. One viewer at a time participated in our viewing sessions, sitting at a distance of 1.6 times the diagonal of the display (2 m), which corresponds to a 30-degree viewing angle.
16.5.3 Test Method
A mixed, quantitative and qualitative, test approach was used in our experiment. The viewer was presented twice with a pair of video sequences, a and b, played sequentially, with a 2-s midgray screen showing letter a or b before the rendering of the corresponding video; a and b depict the same content, expanded with two different expansion operators. After the presentation, the viewer was asked to answer the following questions: (1) Did you prefer a, b or did you have no preference? (ie, three-forced-choice paired comparison method; David, 1969); (2) If you had a preference, why did you prefer a or b? (ie, qualitative evaluation to motivate the paired comparison choice); (3) Would you say the quality of the preferred stimulus (or both if you did not have a preference) is acceptable if you would get this video on your TV? (ie, acceptability rating); and (4) How would you rate the overall quality of the preferred stimulus (or both if you did not have a preference)? (ie, overall quality absolute categorical rating (ACR) using a five-level discrete quality scale; ITU-T, 2008). Each viewer was left free to take as much time as needed to answer these questions, by directly handling the interface (ie, pausing and resuming the playout once the “vote” message on the screen had been reached).
A complete paired comparison method was used and each pair of stimuli was presented in both orders: thus, with n being the number of expansion operators compared, 12 pairs (n × (n − 1)) were considered for each content, and in total 72 stimuli (12 × 6 contents) were presented to each viewer. To avoid viewing sessions longer than 20 min, the entire test was split into three sessions: each viewer performed a session on a different day. The list of test stimuli included in each session and their order were randomized for each viewer, with the constraint that no consecutive presentations of the same content would occur. Two dummy presentations were included at the beginning of each session to stabilize viewers’ scores.
Before the first session, each viewer was asked to fill in a form to characterize his/her familiarity with HDR technology and multimedia user’s habits. Each viewer was also screened for correct visual and color acuity. A training session, including three video scenes (different from the test material) and the same expansion operators as those considered in the test, was held before the first session to familiarize the viewer with the interface as well as with the paper rating sheet.
16.5.4 Results and Discussion
A panel of 13 persons, sex-balanced and with an average age of 28.8 years (minimum 22 years, maximum 38 years), took part in the test. Most of them were not familiar with HDR imaging and declared they did to have a high-definition television at home. To detect and remove possible outliers from the panel, we leveraged the transitivity property of the ordering induced by paired comparison tests, as proposed by Lee et al. (2011). We found that there was no outlier in the paired comparison tests.
Table 16.1 shows the normalized winning frequencies (wij), averaged across the six video contents, of having algorithm i (on the rows) preferred to algorithm j (on the columns), where i,j = 1,2,…,n and n is the number of different expansion operators. These are computed as wij = pij + tij/2, where pij is the normalized frequency of stimulus i being preferred to stimulus j (I prefer a (b)) and tij is the normalized frequency of the tie (I have no preference). The resulting ranking of the expansion operators, global and per content, is shown in Table 16.2. In terms of overall ranking and winning frequencies, it can seen that, in most cases, the simple linear expansion (algorithm A) ranks first, while algorithm R ranks last. Considering the results of the qualitative evaluation, we can explain this by the fact that in general the expanded HDR video obtained with use of algorithm R was judged as “too dark” and “not colorful,” giving the impression of being “unnatural” to viewers.
Table 16.1
Overall Winning Frequencies (wij), Averaged Over the Six Videos
| A | H | M | R | |
| A | 0 | 0.75 | 0.65 | 0.87 |
| H | 0.25 | 0 | 0.47 | 0.82 |
| M | 0.35 | 0.53 | 0 | 0.75 |
| R | 0.13 | 0.18 | 0.25 | 0 |

Table 16.2
Algorithms Ranking Across Test Videos
| 1st | 2nd | 3rd | 4th | |
| Vespa | A | M | H | R |
| Firedance | H | M | A | R |
| Sunset | A | H | R | M |
| Tennis | A | H | M | R |
| Stairs | A | M | H | R |
| Naples | A | H | M | R |
| Average | A | H | M | R |

Considering the acceptability scores, the expanded videos were almost always judged acceptable in terms of visual quality (only 8% of the video stimuli was judged unacceptable by at least one-third of the panel). From analysis of the results of the ACR quality assessment (Fig. 16.10), it can be seen that, in most cases, the best performing algorithms produce good or even excellent results. This is true for all the scenes apart from “vespa” and “firedance”: in these cases, the ACR scores are between fair and good, indicating that there is still room for improvement of expansion operator performance. From an analysis of users’ qualitative feedback, as well as the content characteristics, this can be explained by the fact that when the scenes are dark and have low local contrast, the resulting expanded videos are perceived as “noisy” (vespa A) or “too dark” (firedance H). Interestingly, even in the cases when the quality of the stimulus was considered to be not acceptable, viewers did not signal any specific temporal artifacts such as illumination changes or flickering: “dark” and “noisy” are the most frequent adjectives used to describe the worst stimuli.

Qualitative comments also reveal that the preferred stimulus is usually the one which is deemed as “brighter” and “with more details.” This somehow confirms the findings of Akyüz et al. (2007), which showed that viewers prefer the brightest stimulus, as far as it displays a good contrast. This explains why the simple linear expansion algorithm (A) ranked first in the test: because the input LDR material was of high quality and well exposed, the linear expansion enables one to increase the dynamic range while enhancing details and giving the same overall impression of contrast as in the original LDR. On the other hand, if the input LDR is too dark, linear expansion amplifies noise, and thus, in some cases, algorithms that enhance contrast but do not uniformly increase brightness (such as algorithm H) could be preferred.
In conclusion, this subjective study confirms some of the results previously found in the literature for the expansion of still images — that is, simple algorithms such as linear range expansion can provide visually acceptable and, in most cases, very good visual quality when visual appeal is judged, rather than fidelity to the original HDR content or to reality. Most interestingly, the study indicates that none of the frame-based expansion operators examined introduce visible temporal artifacts, such as flickering due to global illumination changes, in contrast to what has been conjectured in previous work on range expansion for video.
16.6 Concluding Remarks and Perspectives
HDR imaging is an emerging area within the realm of visual signal processing. It brings to the table two major advantages over traditional imaging systems. First, it can provide a more immersive and realistic viewing experience for the users. Second, the higher bit depth required in HDR imaging will allow more signal manipulation (eg, preprocessing toward efficient encoding) as compared with traditional imaging. However, to exploit HDR technology to its fullest potential, several challenges remain and this chapter has focused on a few of them pertaining to their impact the overall HDR QoE. We first identified a few key components in HDR QoE and then discussed the impact of TMOs on a few of them. In particular, we find that TMOs can affect perceptual fidelity, visual attention behavior, naturalness, and color reproduction of the HDR content. Because of this, the artistic intent of the HDR content may be lost or altered. As a result, it is important to keep in mind these effects when one is processing HDR content. We also presented a case study on inverse TMOs which sheds light on user preference of expanded content depending on different aspects such as naturalness and brightness. A take-home message from this chapter is that HDR QoE is a complex, multidimensional problem. Hence, we should address it by considering different dimensions and not by a simple fidelity-based approach.