
High Dynamic Range Digital Imaging of Spacecraft
B. Karr*,†; A. Chalmers†; K. Debattista† * Kennedy Space Center, FL, United States
† University of Warwick, Coventry, United Kingdom
Abstract
The ability to capture digital engineering imagery during rocket launches in which all of the detail in the scene is present is critical for postlaunch processing and analysis. Rocket launches often present an extreme range of lighting during both day and night missions. Imaging rocket launches has two key challenges: capturing detail of the vehicle and scene, while also capturing detail in the engine plume. Unlike traditional video technology, high dynamic range imaging is capable of capturing a wide range of lighting in a scene. This chapter considers the potential of high dynamic range for providing a step change in the imaging of spacecraft.
Keywords
High dynamic range; Imaging; Spacecraft; Capture; Processing; Display
Acknowledgments
Advanced Imaging Laboratory team members have included Cole Alcock, Sandra Clements, Amy Elliott, Charles Harnden, Philip Haun, Matt Malczyk, Brian Moravecky, Herbert Oleen, Jamie Peer, John Lane, Omar Rodriguez, and Jay Shropshire. NASA Space Shuttle mission sponsorship was provided by Douglas England and Robert Page. NASA sponsorship in the post–Space Shuttle era was provided by the Ground Systems Development and Operations Program, Prentice Washington, and Dave Connolly. Additional NASA support was provided by Rodney Grubbs, Walt Lindblom, and Darrell Gaddy of the Marshall Space Flight Center, and Larry Craig of the Launch Services Program. Test support was provided by RED, ARRI, PCO, Photron USA, Vision Research, United Launch Alliance, and Space Exploration Technologies. This project is also partially supported by EU COST Action IC1005.
20.1 Introduction
A transition from film cameras to digital imagers is anticipated in the post–Space Shuttle era. Analysis of digital imaging systems and comparison with the film baseline is important for determining the transitional road map. Resolution, dynamic range, uniformity, color response, sharpness, timing, etc., are examples of imaging metrics for consideration. Traditional imaging methods are unable to capture the wide range of luminance present in a natural scene. High dynamic range (HDR) imaging is an exception, enabling a much larger range of light in a scene to be captured (Banterle et al., 2011; Reinhard et al., 2010). The focus of this chapter is the development and testing of digital imaging systems with respect to the HDR imaging of spacecraft. A review of the dynamic range of film, the current engineering imaging baseline, is presented along with relevant characteristics. Past work related to the imaging of the Space Shuttle is included. Field experiments are then described, with the inclusion of sample image frames. Finally, current work is discussed, including laboratory capture and processing of imager dynamic range, and characterization of display device output luminance.
20.2 Background
The NASA requirement for engineering-quality imagery is defined as being visually lossless — that is, no loss of perceived quality once compression is applied, as compared with the original captured file. The ability to capture engineering-quality imagery with a wide degree of dynamic range during rocket launches is critical for postlaunch processing and analysis (US Columbia Accident Investigation Board and Gehman, 2003; United States Congress, House Committee on Science and Technology, 1986). Rocket launches often present an extreme range of lighting when viewed by image analysts during both day and night launches. During the Space Shuttle program, engineering imagery was collected at Kennedy Space Center primarily through the use of 16 and 35 mm Photosonics high-speed film cameras. The film cameras include automatic exposure control, shifting the available dynamic range in response to scene luminance.
HDR images may be captured through a single sensor with use of multiple exposure settings, dual gain sensors, or multiple sensors in combination with beam splitters and neutral density filters (Mann and Picard, 1995; ARRI, 2013b). In addition, new classes of imaging sensors are being developed that are capable of directly capturing a larger dynamic range — for example, those proposed by Fuji and Panasonic (Cade, 2013). Workflows in typically lossless HDR formats such as Radiance RGBE (Ward, 1991), allowing half-float representations, as well as OpenEXR (Bogart et al., 2003) and TIFF, allowing half-float and full-float representations, are required for HDR data (Ward, 1991). Lossy compression formats such as goHDR and HDR MPEG (Rafa et al., 2006) may also be used for bandwidth reduction and smaller file size. The ability to display HDR imagery directly on HDR displays is also evolving rapidly with the advent of LED-modulated liquid crystal HDR displays. These HDR capture, processing, and display workflows aim to reproduce the simultaneous contrast ratio capability of the human visual system, and indeed even more dynamic range than the human eye can see (Seetzen et al., 2004).
The entire capture, processing, and display workflow must be considered when one is evaluating dynamic range, as each subsystem can potentially enhance or degrade the overall system capability. Benefits have been realized by use of complete system capability data in the planning and initial design of a next-generation imaging system.
20.2.1 An Engineering Imagery Example
One of the issues facing the switch to digital technology can be illustrated by night launches. Night launches present a twofold problem, capturing detail of the vehicle and scene that is masked by darkness, while also capturing detail in the engine plume. Fig. 20.1 contains two frames of a debris event as captured by traditional non-HDR imaging. The images originated from an eight-bit, 4:2:2, Rec. 709 color space data file during a spacecraft night mission. Fig. 20.1 (left) illustrates debris to the left and above the vehicle plume in the night sky. The camera exposure was set to capture detail in the flame, while the limitation in dynamic range results in little to no observable detail in the vehicle area.

Fig. 20.1 (right) includes debris in front of the engine plume several frames later. While the debris can be observed in and near the plume area, there is a loss of useful visual information as to the origination point from the vehicle, how the debris was generated, and the remaining state of the vehicle. Detail of the debris itself is also reduced as a result of the limited dynamic range, among other factors such as image resolution and optical system sharpness.
20.3 Film Baseline
Sixteen and 35 mm films were used as the engineering imagery baseline during the Space Shuttle program. Investigation is now ongoing to consider replacing or at least complementing film with advanced digital technology.
20.3.1 Dynamic Range of Film
The dynamic range of “film” from a system perspective should include the negative, processing, and printing/display combination. Modern motion picture original color negative stocks such as Kodak Vision3 capture images with red, green, and blue records representing up to a 13-stop scene (Eastman Kodak, 2010). Kodak estimates that the usable digital scan range is 10–13 stops depending on the scanning and encoding scheme (Eastman Kodak, 2009). One method for retaining the full density range is through the use of adjusted density mapping.
Film negatives, however, capture more than can be reproduced on the print, and follow a characteristic “film” curve for relative log exposure. The classical approach to densitometry (scientific analysis of exposure) was devised by Hurter and Driffield and is called the H&D curve (Davis and Walters, 1922). The H&D curve (also called the ![]() curve,
curve, ![]() curve, or relative log exposure) plots the amount of exposure E in logarithmic units along the horizontal axis, and the amount of density change D along the vertical axis. A sample
curve, or relative log exposure) plots the amount of exposure E in logarithmic units along the horizontal axis, and the amount of density change D along the vertical axis. A sample ![]() curve is shown in Fig. 20.2 (Eastman Kodak, 2006).
curve is shown in Fig. 20.2 (Eastman Kodak, 2006).

In practice the exposure curve indicates that film response is not “linear” throughout the exposure range. A theoretical perfectly linear response would have a 45-degree slope. The slope of a relative exposure response in practice is a measure of its contrast, while the slope of the straight-line portion of the curve (essentially ignoring the shoulder and toe) is referred to as the gamma. The upper and lower end of the film emulation response differs than that of the gamma section. At the low end, the film does not initially respond as it “sees” radiant energy and then responds sluggishly for initial increases. At the upper end, the response is compressed as the emulsion becomes overloaded. These areas are indicated by the toe and shoulder regions in the H&D curve. The logarithmic data could be linearized with a nominal film transform such as a linearized printing display. Use of a linear scene-referred representation would require detailed characterization of each film emulsion, which film manufacturers often consider confidential. Additionally, the inverse linearization of the film H&D curve would produce very high gain in the nonlinear toe and shoulder regions, potentially producing high-gain artifacts (Kennel, 2014).
The film laboratory “timer” sets the exposure range of the negative that the print will be exposed to in a development process using reducing chemicals. The process is stopped either by washing or use of a stop bath. This is a “relative” process where the exposure is determined by the timer. After exposure, printing, and digital scanning have been performed, the process will need to be repeated if an adjustment in overall exposure is required. This process is both time-intensive and costly. For Space Shuttle engineering film processing, the film was flown from Kennedy Space Center, Florida, to a processing facility near Atlanta, Georgia, processed and scanned, with the goal to return the digital transfers within 24 h. As film processing laboratories have reduced in number, processing cost continues to increase.
20.3.2 Autoexposure and Contrast Ratio
Film cameras implemented autoexposure systems during Space Shuttle launch imaging. At times there was some confusion with regard to the available dynamic range with the use of autoexposure.
Contrast ratio, the ratio of luminance of the lightest and darkest elements of a scene or image, can be used to describe different aspects of autoexposure. When autoexposure is implemented, the lighting information captured often changes with time. Therefore two measures of contrast ratio may be used (Poynton, 2003). Simultaneous contrast ratio (static) is the contrast ratio at one instant of time. Sequential contrast ratio (dynamic) is the contrast ratio separated in time (ie, light and dark elements over a series of images).
Human vision may have a simultaneous contrast ratio of close to four orders of magnitude (3.7 density, 12.3 stops) (Kunkel and Reinhard, 2010), while human sequential contrast ratio via adaption can be as great as 10 orders of magnitude, or approximately 33 stops (Ferwerda, 2001). Film and digital imagers can both be defined in terms of simultaneous and sequential contrast ratio.
20.3.3 Linear and Nonlinear Quantization
In both scanned film and digital-based imaging of spacecraft, the final result is often a digital data file. In nontypical cases, the film print may be used directly in a projection system. In the film case, the processed negative is scanned within the capabilities and bit depth of the scanning system to a digital file generally referred to as a digital intermediate. In the digital imager case, the analog sensor voltages are converted to linear digital values within the capabilities and bit depth of the camera sampling system.
A primary constraint in both cases is the digital bit depth, or the number of discrete quantization levels (or codes) available to represent a given relative luminance range. There are two primary methods for bit depth encoding that are implemented by digitizer manufacturers: linear and nonlinear scales. Nonlinear scales are often referred to as log or log-c, even though the functions are often in practice based on a power law as it can be a better approximation to human visual response.
In general, linear scale quantization is used when the sampling resolution is to be kept constant over the entire exposure. Nonlinear scale quantization is used when the sample resolution follows the logarithmic response similar to human perception of luminance. When nonlinear quantization is implemented, fewer bits are required to theoretically match the viewing capability of human luminance response; the visual threshold. The trade-off is that a reduced subset of total exposure information is stored, limiting image analysis capability when detail within a subset of the contrast range is required.
A typical industry scanning metric is SMPTE 268M Digital Moving Picture Exchange (DPX), logarithmic with 10-bit integer calibrated over a 2 + density range (SMPTE, 2003). Density range is defined in the following equation:
The relationship to dynamic range in terms of stops is defined by the following equation:
In practicality, a Cineon digital film scanner is calibrated for a 2.048 density range (Kennel and Snider, 1995). HDR imagery, on the other hand, is typically stored with use of float point values.
20.3.4 Playback and Display
The final, yet equally important, piece of the dynamic range workflow for both film and digital technologies is the playback software, hardware, and display. Regardless of the capture and quantization methods, the end user will be able to view the simultaneous contrast ratio only within the limitations of the end playback software, hardware, and display system. An example film workflow using a digital intermediate and a typical 8-bit display is shown in Fig. 20.3.

In this example, the full dynamic range benefit is not realized as a result of playback and display limitations. Limitations in dynamic range were present in the review of Space Shuttle imagery, depending on the equipment available at each participating NASA center. One example display device, a 10-bit 4K projection system, is limited in dynamic range because of a peak luminance of only 60 cd/m2 measured at the projection screen. For redundancy, image analysts were available at Johnson Space Center, Marshall Space Flight Center, and Kennedy Space Center, albeit each with different equipment and capabilities. Although the differences between centers were a result of several factors, including areas of expertise, program responsibilities, and budget, the differences do have a benefit of a more comprehensive and overlapping analysis approach.
Fig. 20.3 is dependent on the specifics of the DPX scan, as well as the setup and calibration of the monitor. For conversion from the full-range 10-bit log digital negative to an 8-bit Rec. 709 video representation, the preferred method is to limit the density range that is translated to that of a normal exposure with scene contrast range of 100:1, or six 2/3 stops. The resulting scene will have reasonable contrast when displayed on a standard graphics display monitor (Kennel and Snider, 1995) where the Dmin code value of 95 and the 90% white card code value of 685 are mapped to an output range of 0–255 in the eight-bit representation.
20.3.5 Summary of Film Use
During the Space Shuttle program, 16 and 35 mm high-speed film cameras provided greater dynamic range capability than digital imagers available at the time. The film assets were only minimally utilized, on average for 4.5 Space Shuttle flights per year. With an ongoing maintenance program, they did not require regular replacement. The development of digital imaging technology, along with increases in dynamic range capability, occurred as the Space Shuttle program reached the end of its life. As the program ended, an upgrade of film assets to digital technology was cost-prohibitive in terms of equipment, infrastructure, training, and operation.
A transition to digital technology for future programs, however, can provide several benefits. Although the film emulsion can capture up to 13 stops, in most cases the film is transferred to a digital intermediate with reduced dynamic range, often displayed via a limited contrast ratio display. The process of developing film is time-consuming and costly, and is becoming more difficult to procure. Operation and maintenance of film systems requires specialized skills sets. After launch, the exposed films are collected, transported to a local airport, and flown to a development house often out of state. The film is developed and scanned, and the digital files are transported back to Kennedy Space Center after as much as a 24-h delay.
In the case of digital capture, files are available much faster, often with access to the RAW data quickly after launch. HDR data capture surpassing the dynamic range capability of film is becoming more prevalent, HDR file containers are available that support HDR data types, and HDR workflows allow the processing of HDR data. HDR displays are with expanded contrast ratio are becoming available. The entire HDR workflow aims to fulfill a primary requirement of image analysis, the ability to process, display, and analyze imagery with increased simultaneous contrast ratio.
20.4 HDR Imaging of Spacecraft Field Experiments
Testing of HDR digital image capture began in 2009 by the Advanced Imaging Laboratory (AIL), in preparation for an eventual film-to-digital transition. Experiments were initially conducted with equipment currently on hand or available via loan, while preparations were made to obtain the latest-generation digital technology. As the Space Shuttle program was coming to a close, field experiments were often planned in advance of laboratory testing, in order to capture actual launch imagery while the launch opportunities were still available.
20.4.1 High Definition Camera Test During STS-129
The first HDR experiment used two industrial eight-bit HD1100 2/3-inch sensor cameras with similar optics to capture similar fields of view, albeit with different exposures. The experiment was conducted during STS-129 (Clements et al., 2009) with the imaging systems mounted on a common tracking system. The A camera was mounted on the upper side of the tracker right wing and the B camera was mounted on the underside. At the time of the experiment, the HD1100 shutter speed was limited to 1/300 of a second. The difference in exposure from the A camera to the B camera was two 1/4 stops on the basis of available exposure times of 1/60 and 1/300 of a second. Both cameras were mounted on Meade eight-inch-aperture telescopes, focal length of 2032 mm. The 2/3-inch sensors (8.8 mm × 6.6 mm) have an equivalent 35 mm crop factor of 3.9. The telescope and crop factor result in a tight field of view with the tracker distance of approximately 3 miles from the Space Shuttle launch pad.
Atmospheric effects of ground heating resulted in a reduction of overall image quality, as can be observed in Figs. 20.4 and 20.5. The effects are particularly pronounced with daytime launches during the Florida summer months, where temperatures are commonly above 30°C. Limitations in shutter speed also contributed to the softness of the imagery during the actual launch.


Mechanical errors in the camera alignment stage are evident when one compares Figs. 20.4 and 20.5, complicating efforts to recombine the synchronized frames into single HDR frames. Independent vibration affected each of the two image sequences, primarily a result of the effect of the launch acoustics on the mechanical support structures. Recombination efforts did not result in acceptable video because of the misalignments and vibration effects.
20.4.2 RED ONE M Camera Test During STS-131
As a result of misalignment issues noted with the two HD1100 imagers, market research was conducted to identify the latest single sensor imagers advertised with increased dynamic range capability. One contender identified was the RED ONE imager from RED. RED specifies the dynamic range as 11.3 stops (assumed to be an MX sensor). The AIL measured 10.4 stops with the M sensor using log gamma, and 11.5 stops with the MX sensor using logFilm gamma. Both measurements were made with respect to 0.5-stop root mean square (RMS) noise, as discussed in Section 20.5. M sensor versions of the cameras were available and configured for STS-131 (Clements et al., 2010) to acquire imagery of the launch from five camera sites around the Space Shuttle pad perimeter as illustrated in Fig. 20.6. Deployed in pairs to each site, the cameras provided imagery not only for HDR testing purposes but also to generate stereoscopic 3D image sets. A diagram of the Space Shuttle pad perimeter camera site locations is shown in Fig. 20.7.


The RED ONE M experiment was successful in illustrating the capability of a single-exposure digital imager at the time. Clearly the solid rocket booster (SRB) plume is saturated and outside the available dynamic range. Detail of the vehicle is present, primarily lit from the rocket plume, with the addition of some ground-based spotlights. The five camera locations had similar exposure settings, resulting in similar dynamic range detail for all image sets.
Fig. 20.8 shows a full frame from the RED ONE M at camera site 3, southeast of the launch pad, illustrating the available lightness detail of the full plume. Launch debris may be present throughout the field of view, ranging from the SRB bright plume to the dark shadow areas of the plume cloud. If the shadow areas are comparable to starlight, and the SRB bright plume is considered to be greater than direct overhead sunlight conditions, the total dynamic range of the launch environment is greater than eight orders of magnitude. Efforts will be made to quantify the launch environment total dynamic range.

20.4.3 HDR Imaging During the Final Space Shuttle Flight STS-135
Market research was expanded for the final Space Shuttle flight of STS-135 to identify the growing number of available single-sensor imagers with increased dynamic range capability. New systems identified included the Vision Research Phantom HD Gold High Speed, RED EPIC with 5K resolution sensor, Cooke DiMax High Speed, Photron SA2 High Speed, and the ARRI Alexa (Lane et al., 2011). The RED ONE with M sensor was again used as a baseline for comparison.
20.4.3.1 RED ONE M test STS-135
A RED ONE camera with M sensor was deployed to the infield location near camera site 4. A 25-mm RED lens was used for the wide angle field of view. The resulting imagery was similar in dynamic range response to that in previous tests. A sample frame is shown in Fig. 20.9. Although the SRB plume is saturated, the overall imagery is of high quality, with detail observed throughout the field of view. An additional benefit is that the RED ONE imager is capable of 4K resolution.

20.4.3.2 ARRI Alexa test
Two ARRI Alexa cameras were placed within the Space Shuttle pad perimeter. The A camera was configured to capture a “film look” exposure with 180 degree shutter at 30 frames/s (16.67 ms exposure time) with a 50-mm lens. The B camera was configured to capture an “engineering” exposure with 22.5 degree shutter at 120 frames/s (0.52 ms exposure time) with a 40-mm lens. Whereas the 180 degree shutter creates the familiar film look motion blur, the engineering 22.5 degree shutter has the goal of reduced motion blur and sharp individual frames. Film look is a subjective term. It is commonly associated with the human visual experience when one is viewing a film-capture-based motion picture. Typical characteristics of “film look” include a frame rate of 24 frames/s, 180 degree shutter angle, narrow depth of field, and film grain-type noise. An engineering exposure, alternatively, has the goal of producing as sharp an image as possible in each individual frame, with high frame rate.
The 180 degree A camera required the use of a neutral density filter because of the longer exposure time. For the B camera, this test was one of the first using ARRI’s 120 frames/s feature. The ARRI Alexa is marketed as capable of 14 stops of dynamic range. The AIL laboratory test measured 13.9 stops at 0.5-stop RMS noise in log mode. Fig. 20.10 shows a sample frame from the “engineering” 120 frames/s B camera. Although the SRB plume is saturated, the overall imagery is of high quality. When digitally cropped on a subsection of the digital image that includes fast moving content, such as the orange SRB exhaust plume, the 180 degree shutter A camera image is less sharp than the 22.5 degree shutter B camera. The Alexa imagery workflow was considered one of the simplest while still producing high-quality imagery. The straightforward application of a 3D lookup table (LUT), generated from the online ARRI LUT Generator, to the log data files resulted in realistic looking color and lightness without further grading being required (ARRI, 2013a). The LUT, in the case of AIL processing, was generated for the DaVinci Resolve color grading system.

20.4.3.3 RED EPIC test
The RED EPIC without HDR mode was laboratory tested by the AIL as 11.5 stops at 0.5-stop RMS noise, logFilm mode. REDlogFilm applies a log curve to the linear sensor data without the addition of a film-like contrast curve. LogFilm replicates the characteristic curve of Cineon film scans (RED, 2013). For the STS-135 test, HDR mode was available but had not yet been tested, so it was not used. The RED EPIC has the benefit of a 5K resolution imager, upgradable to the DRAGON 6K sensor. The RED EPIC was configured to capture at 96 frames/s at a resolution of 5210 × 2700, with a 100-mm lens and a 1-ms shutter period.
The imagery captured was similar in dynamic range to that captured by other imagers tested in that the SRB plume was saturated. Overall the RED EPIC footage was of high quality and the increased pixel count allowed higher-quality cropping within the imagery. A sample RED EPIC frame is shown in Fig. 20.11.

20.4.3.4 Photron SA2 test
A Photron SA2 high-speed digital camera with 2K resolution with a 500-mm lens was deployed near camera site 3. The frame rate was set to 500 frames/s. Fig. 20.12 illustrates a frame from the Photron SA2 showing a debris item that was observed.

The field of view was selected specifically to image the Space Shuttle main engine hydrogen burn off “sparklers.” Portions of the Space Shuttle main engine flame are saturated, although detail can be seen in other portions as evident in the identification of a debris item passing behind the plume.
20.4.3.5 Cooke DiMax test
A Cooke DiMax high-speed digital camera with an 85-mm lens was mounted on a tracker near camera site 2. The camera resolution was 2016 × 2016, capturing images at 250 frames/s. The camera exhibited some banding immediately surrounding the saturated section of the plume as seen in Fig. 20.13, but otherwise operated as expected. On reviewing the imagery after launch, the manufacturer recommended a darker capture exposure setting.

20.4.3.6 Vision Research Phantom HD Gold test
A Vision Research Phantom HD Gold high-speed digital camera was located at the 275-ft level of the Space Shuttle fixed service structure. A 16-mm film camera was also located at this level, with similar fields of view configured for comparison. A sample frame from the Phantom HD Gold is shown in Fig. 20.14, while a sample frame from the 16-mm film camera is shown in Fig. 20.15. Both cameras were operated at 400 frames/s. The film was scanned via a film to high definition 10-bit log transfer. The Phantom HD Gold captured 14-bit linear data with gamma applied during the color grading process. Both frames have been cropped per their respective aspect ratios.


The darkened film image in Fig. 20.15 is a result of the automatic exposure control. More detail is observed in the plume area in the film image as compared with the digital image, at the expense of the darkened overall image. The Phantom HD Gold camera did not utilize autoexposure and was configured for proper exposure of the vehicle. The SRB plume is observed to saturate in the Phantom HD Gold image.
The changing exposure level of the film represents sequential contrast ratio, complicating comparison over the entire image sequence. From a single frame perspective as shown, simultaneous contrast ratio can be observed, albeit at different exposure levels. The dynamic range of the Phantom HD Gold imagery was better than expected as the SRB plume was saturated but did not bloom into surrounding pixels.
20.4.4 RED EPIC HDR Mode During Delta 4 WGS 5
The RED EPIC capability to capture in HDR mode, allowing the selection of an additional one to six stops, was tested in the post–Space Shuttle period. The RED EPIC stores two different frames in HDR mode, the A frame and the X frame. The RAW A frame contains the “standard exposure” portion of the capture, and the RAW X frame contains the “highlights” portion of the capture. “RAW” refers to the high-quality encoding format of the RED EPIC camera known as REDCODE, which is a proprietary RED un-debayered linear wavelet-based compression (RED, 2012).
An example RED EPIC HDR capture was made during the Delta 4 WGS 5 mission (Karr, 2013). This HDR+ 6 mode captured approximately 17 stops. To illustrate this range in limited print form, or via a low dynamic range monitor, the imagery must be shown as two separate frames. The A frame is shown in Fig. 20.16 and the X frame is shown in Fig. 20.17.


The capability to capture this range of brightness detail is unprecedented for a single imager-based system, and is an excellent example of the current progress in HDR image capture.
20.4.5 Review of HDR Field Experiments
At the close of the Space Shuttle program, field testing of digital imagers provided insight into the current state of technology, the ever-increasing complexity of working with a multitude of digital formats, and the benefits and trade-offs of the different imaging systems.
20.4.5.1 State of technology
How captured digital data are provided to the user is manufacturer dependent. For example, ARRI uses a dual gain architecture with two paths of different amplification for each pixel (ARRI, 2013b). ARRI processes the dual path data internal to the camera, providing a single output file available as RAW (with external recorder), LogC, or Rec. 709. Generation and application of postprocessor-specific LUTs is straightforward, resulting in a particularly user friendly workflow.
RED provides its HDR digital data as two separate file sequences comprising A and X frames. Access to both exposure frames has the benefit of increased flexibility in postprocessing, at the cost of increased complexity in understanding the tone-mapping process. The RED software CineXPro includes two tone-mapping functions, Simple Blend and Magic Motion, assisting the user in the tone-mapping process. Overall, the RED HDR mode had the highest dynamic range measured, as will be discussed in Section 20.5.
The high-speed camera manufacturers such as Vision Research, Photron, and Cooke DiMax all provide the capability to export data from manufacturer formats to either linear or gamma-corrected image sequences. In most cases, 16-bit short integer linear TIFF sequences were used, as HDR-type formats using half floats such as LogLuv TIFF were not available (Larson, 1998). The accompanying software packages from the high-speed camera vendors generally include basic image processing tools, with the expectation that most of the image processing will be conducted by a third-party application. As the RED and ARRI cameras are considered cinematic cameras encompassing tools and workflows to aid the user in producing cinematic-like images, high-speed cameras have traditionally been used in industrial applications such as vehicle safety crash testing, spacecraft launch environments, and munitions testing.
20.4.5.2 Digital formats
A significant challenge in testing a large sample of digital imagers is developing data workflows. Just as there are many vendors, so are there many proprietary data formats, encoding algorithms, export formats, software packages, and postprocessing guidelines. Metadata differ and are nonstandard. Color range and exposure were observed to differ from camera to camera, even within manufacturers, potentially requiring custom LUTs per individual imager for precise characterization of color and luminance response as required.
In some cases, file wrappers, encoding schemes, gamma, and color space functions are vendor specific, such as with RED Redcode files, but have wide acceptance and are importable and manageable either through vendor-provided software or popular third-party applications. In other cases such as with ARRI, file formats typically use ARRI LUTs for gamma and color space, but are wrapped in standard ProRes422 or ProRes444 wrappers. Some high-speed cameras such as the Vision Research Phantom have file formats that are natively importable to popular third-party applications, while others are not and must be exported as an image sequences for import to third-party applications.
20.4.5.3 Benefits and trade-offs
Finally, although the primary focus of this chapter is dynamic range, there are many additional considerations for a spacecraft imaging system. Accurate frame timing is extremely important for the syncing of debris events across multiple imager fields of view. Trigger mechanisms for remote start, resetting of false triggers, exposure adjustments, and black shading are other example requirements. The capability to withstand and operate in high-shock and high-vibration environments is essential for many camera locations. Environmental concerns, including temperature and humidity limits, need to be considered. Nonvolatile memory is beneficial in the event of power loss. Resolution, color response, sharpness, and sensor uniformity are also testable parameters of interest.
20.5 Calibrated Measurement of Imager Dynamic Range
A test procedure was developed to measure the dynamic range of imagers with the goal of an objective comparison. A DSC Labs Xyla 21 test chart was procured that includes 21 stops of dynamic range via a rear-lit voltage-regulated light source (Fig. 20.18). The Xyla 21 test chart features a stepped xylophone shape for minimizing flare interference from brighter steps. Additional techniques for reducing glare can be considered in future tests, such as imaging only one step at a time, although this will result in additional measurement and processing time. The Xyla 21 test chart is preferred to front-lit reflective charts as front-lit charts are more difficult to evenly relight over time, as test configurations change or the test environment is altered. Rear-lit grayscale stand-alone films require the use of an illuminator such as a light box, where special care is required to monitor the light source and voltage. The Xyla 21, being an all enclosed calibrated single unit, simplifies test setup and measurement.

The camera under test is mounted on a tripod and placed in a dark test room with no light leakage along with the Xyla 21 test chart. Camera lights and all reflective surfaces are masked to prevent reflections off the chart surface. A 25-mm Prime PL mount lens is attached to the camera. The camera distance to the chart is adjusted to maintain approximately 50 pixels per patch horizontal resolution, required by the Dynamic Range module of the analysis software program Imatest (Koren, 2014). For large-format sensors, a longer focal length lens may be required, such as an 85-mm lens for the RED DRAGON 6K.
A one-foot straight edge is placed across the front plane of the lens. Measurements are taken at each end of the straight edge to the face of the test chart to ensure the two planes are parallel to approximately 3 mm. The lens aperture is set to fully open, and the focus is set by the temporary placement of a Siemens star, as seen on an ISO 15775 chart, on the face of the test chart. Once the focus has been verified, the camera is set to the manufacturer-recommended native ISO, and data collection begins. Before the ambient lights in the room are turned off, a few seconds of video is captured of the brightly lit chart, to be used for alignment and autoprocessing in Imatest. The ambient room lights are then turned off and the door to the test room is closed so that only the light from the test chart reaches the camera under test. The lens remains at the lowest f-stop (wide open) to ensure the luminance of at least the first two or three chips will saturate the image sensor at the slowest exposure time (generally 1/24 or 1/30 of a second). A few seconds of video is collected, and then the exposure time is reduced by half (one stop). Again a few seconds of video is collected, and the process is repeated for a total of at least five measurements. The sample data are collected and processed with the appropriate vendor software, DaVinci Resolve, or a combination of proprietary vendor and commercial applications as summarized in Table 20.1.
Table 20.1
Dynamic Range Postprocessing Workflow Summary
| Imager | Capture Format | Processing Steps |
| ARRI Alexa | 12-bit LogC, ProRes444,1920 × 1080 | LogC — export 16-bit TIFF from DaVinci Resolve Rec. 709 — apply 3D LUT, export 16-bit TIFF from DaVinci Resolve |
| RED ONE M/MX | 12-bit linear, Redcode36,4096 × 2034 | Log/LogFilm Gamma — apply with CineXPro, export 16-bit TIFF Gamma3/Color3 — apply with CineXPro, export 16-bit TIFF |
| RED EPIC/DRAGON | 12-bit linear, Redcode 8:1, EPIC 4K 16:9, DRAGON 6K 16:9 | LogFilm Gamma — apply with CineXPro, export 16-bit TIFF Apply Simple Blend, Magic Motion tone-mapping as required. |
| Toshiba HD Hitachi DK | Uncompressed YUV, Blackmagic Hyperdeck Pro Recorder, .MOV wrapper | Rec. 709 gamma applied by camera. Export 16-bit TIFF from DaVinci Resolve |
| Blackmagic | Film mode, Apple ProRes 422HQ, .MOV wrapper,3840 × 2160 | Film gamma applied by camera. Export 16-bit TIFF from DaVinci Resolve |
| Canon 5DM3 Magic Lantern RAW Still | ML RAW, Full frame | Convert ML RAW with RAW2DNG. Export 16-bit TIFF DaVinci Resolve |
| Canon 5DM3 Magic Lantern HDR Movie | ML H.264,1920 × 1080 | Convert H.264 HDR file with AVISynth to HDR JPEG |
A sample frame is then processed through the Dynamic Range module of the test software program Imatest. Imatest has a number of Dynamic Range settings that may be configured in the software. Two primary metrics of interest are as follows:
1. Average density of the grayscale patches in terms of “normalized” exposure pixel value (normalized to 0–255)
2. Dynamic range (stops for several maximum RMS noise levels; high to low image quality: 0.1, 0.25, 0.5, and 1.0 f-stop RMS noise)
The measurement of dynamic range in terms of stops corresponds to the relative luminance differences the human eye perceives. By quantifying the range of tones in terms of a maximum specified RMS noise, we can make objective comparisons between imaging systems. Quite often dynamic range data are provided by manufacturers without their defining if the measurement includes all noisy shadow areas or a noise limit.
The normalized exposure is first plotted against the step value of the Xyla 21 chart for each exposure time captured during the measurement. Sample normalized exposure data for the ARRI Alexa are shown in Fig. 20.19. The goal of processing the one-stop-separated normalized exposures is to ensure the proper exposure, resulting in the greatest dynamic range, is in the dataset. To determine which exposure resulted in the greatest dynamic range, the dynamic range is plotted against the RMS noise for each exposure time captured. Dynamic range data for the ARRI Alexa are shown in Fig. 20.20.


In general, as is the case for the ARRI Alexa, the exposure setting that most often resulted in the peak dynamic range was the one where the brightest chip was just saturated. In the case of the ARRI Alexa data, this was the exposure time setting of 1/190 of a second. This value is taken as the peak dynamic range.
The RED EPIC and DRAGON HDR modes are treated similarly; however, an estimate of the total dynamic range is made on the basis of a combination of both A frame and the X frame, by equating similar scene luminance values from both frames. HDR exposure data for the RED EPIC are shown in Fig. 20.21, including a “shifted” X frame normalized to the sixth A frame step.
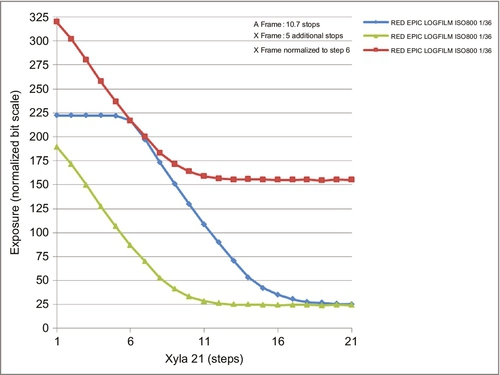
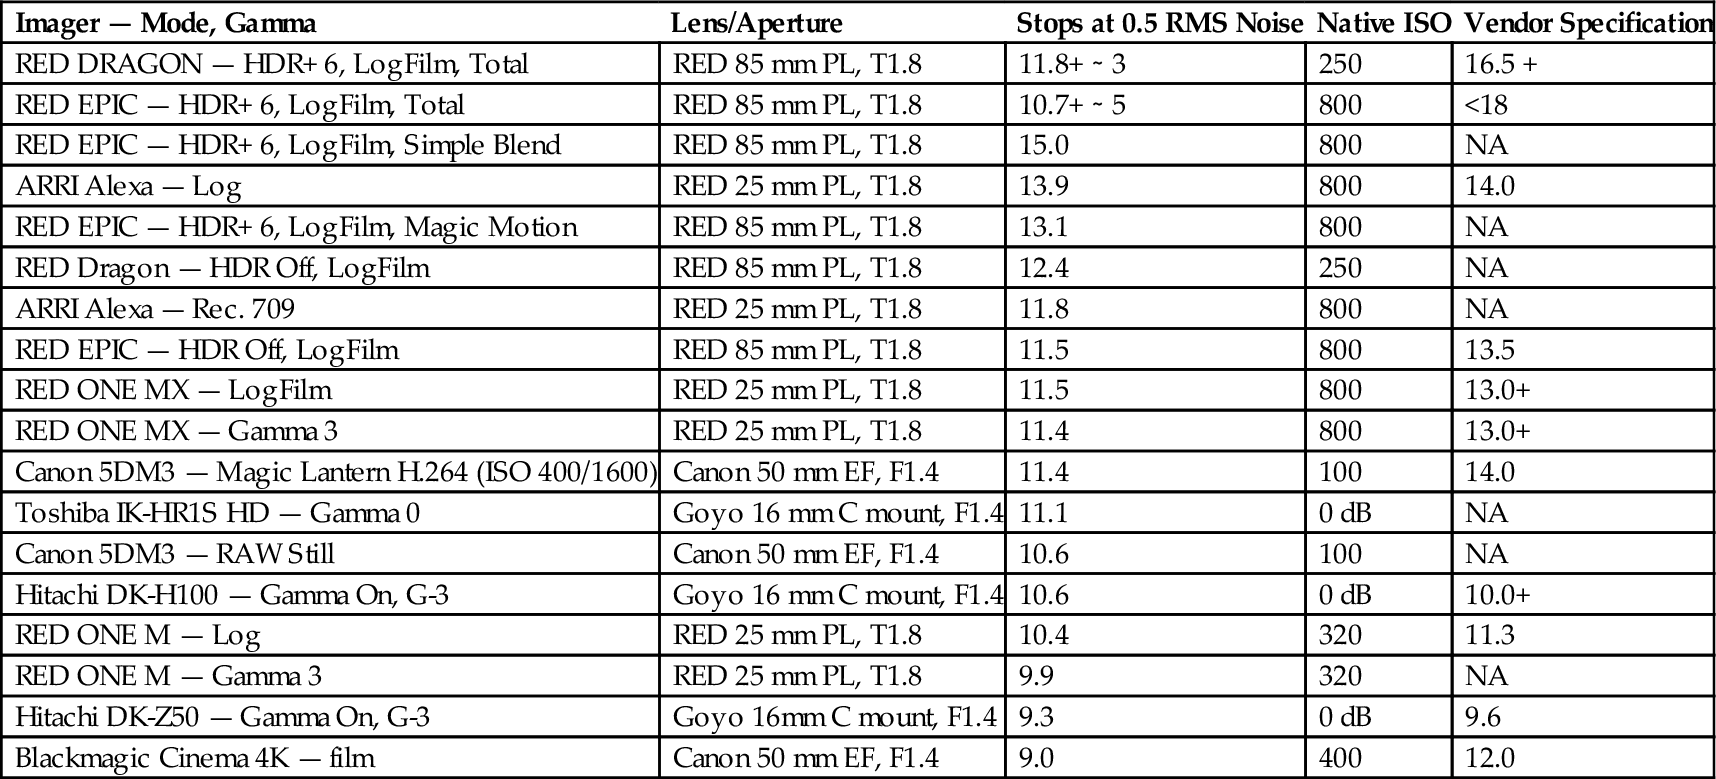
Results for imagers tested to date are shown in Table 20.2, including the native ISO values used. The dynamic range measurements are stated in terms of “medium quality,” corresponding to 0.5 stops of RMS noise. This level of noise was selected on the basis of measurements from a number of different camera manufacturers and comparisons with the manufacturers’ published dynamic range. The RED EPIC and DRAGON total measurements are approximate as they include the combination of the two measured A and X frames. Data for the RED tone-mapping functions Simple Blend and Magic Motion have been included.
Table 20.2
Dynamic Range Measurement of Digital Imagers
| Imager — Mode, Gamma | Lens/Aperture | Stops at 0.5 RMS Noise | Native ISO | Vendor Specification |
| RED DRAGON — HDR+ 6, LogFilm, Total | RED 85 mm PL, T1.8 | 11.8+ ∼ 3 | 250 | 16.5 + |
| RED EPIC — HDR+ 6, LogFilm, Total | RED 85 mm PL, T1.8 | 10.7+ ∼ 5 | 800 | <18 |
| RED EPIC — HDR+ 6, LogFilm, Simple Blend | RED 85 mm PL, T1.8 | 15.0 | 800 | NA |
| ARRI Alexa — Log | RED 25 mm PL, T1.8 | 13.9 | 800 | 14.0 |
| RED EPIC — HDR+ 6, LogFilm, Magic Motion | RED 85 mm PL, T1.8 | 13.1 | 800 | NA |
| RED Dragon — HDR Off, LogFilm | RED 85 mm PL, T1.8 | 12.4 | 250 | NA |
| ARRI Alexa — Rec. 709 | RED 25 mm PL, T1.8 | 11.8 | 800 | NA |
| RED EPIC — HDR Off, LogFilm | RED 85 mm PL, T1.8 | 11.5 | 800 | 13.5 |
| RED ONE MX — LogFilm | RED 25 mm PL, T1.8 | 11.5 | 800 | 13.0+ |
| RED ONE MX — Gamma 3 | RED 25 mm PL, T1.8 | 11.4 | 800 | 13.0+ |
| Canon 5DM3 — Magic Lantern H.264 (ISO 400/1600) | Canon 50 mm EF, F1.4 | 11.4 | 100 | 14.0 |
| Toshiba IK-HR1S HD — Gamma 0 | Goyo 16 mm C mount, F1.4 | 11.1 | 0 dB | NA |
| Canon 5DM3 — RAW Still | Canon 50 mm EF, F1.4 | 10.6 | 100 | NA |
| Hitachi DK-H100 — Gamma On, G-3 | Goyo 16 mm C mount, F1.4 | 10.6 | 0 dB | 10.0+ |
| RED ONE M — Log | RED 25 mm PL, T1.8 | 10.4 | 320 | 11.3 |
| RED ONE M — Gamma 3 | RED 25 mm PL, T1.8 | 9.9 | 320 | NA |
| Hitachi DK-Z50 — Gamma On, G-3 | Goyo 16mm C mount, F1.4 | 9.3 | 0 dB | 9.6 |
| Blackmagic Cinema 4K — film | Canon 50 mm EF, F1.4 | 9.0 | 400 | 12.0 |
NA, not available.
In some cases, as with the ARRI Alexa data, the vendor specification corresponds closely with the measured data. In this case the difference is 0.1 stops, well within the one-third stated repeatability error of the measurement (IMATEST, 2014). In other cases the measured dynamic range is less than the vendor-specified range. This could be a result of the vendor-specified data determined using a different maximum RMS noise, or perhaps including all noisy areas as part of the definition of total dynamic range.
Although film was not yet exposed with the Xyla 21 chart, with the digital transfer data processed through Imatest, the stated dynamic range of film at approximately 10–13 stops can still be compared with the measured data. Imagers such as the ARRI Alexa and RED EPIC/DRAGON appear to, at a minimum, match the dynamic range capabilities of film, and at best have exceeded it. Further work comparing film transfers at a similar maximum RMS noise would be of interest.
The stepped xylophone shape of the Xyla 21 chart helps to minimize, not eliminate, flare interference. Flare, or veiling glare, is stray light in lenses and optical systems caused by reflections between lens elements and the inside barrel of the lens.
20.6 HDR Workflow and Display Device Luminance
Evaluation of display devices is equally important in the HDR workflow. Ideally, the entire dynamic range that is captured and processed in the HDR workflow would also be displayed in the full range (Ward, 2008; Wanat et al., 2012). Current-generation HDR monitors such as the SIM2 HDR47ES4MB and the Dolby PRM are tested along with sample commercial monitors, including a Toshiba LED monitor and a Samsung plasma monitor.
A 15-stop HDR test card digital file was created in Adobe Photoshop in 32-bit floating point format and stored as an EXR file. A representation of the test card is shown in Fig. 20.22. Light values were measured via a Sekonic L-758Cine light meter in luminance spot meter mode. The built-in tube was used to minimize glare.

In the case of the SIM2 HDR47ES4MB monitor, the test card EXR file was gamma corrected and played on an HDR player created by goHDR via MacBook Thunderbolt to DualLink DVI (GOHDR, 2014). In the case of the Dolby, Samsung, and Toshiba monitors, DaVinci Resolve was used as the player via a Blackmagic video card. Linear-to-gamma conversion was accomplished in DaVinci Resolve via the addition of the appropriate 3D LUT. The Dolby monitor uses a 10-bit hardware and software workflow, and was measured for several color spaces, including sRGB, Rec. 709, and DCI. The Samsung and Toshiba monitors used an eight-bit workflow (Rec. 709 color space).
The raw measured simultaneous luminance data are included in Table 20.3. The bottom of the table includes rows for the maximum and minimum luminance, contrast ratio, and stops.
Table 20.3
Simultaneous Display Device Output Luminance (cd/m2)
| RGB Value | Stop | SIM2 HDR47ES4MB | Dolby PRM sRGB | Dolby PRM Rec. 709 | Dolby PRM DCI | Toshiba 4K LED | Samsung Plasma |
| 16 | 4 | 4000 | 480 | 480 | 450 | 240 | 40 |
| 8 | 3 | 2000 | 480 | 480 | 450 | 240 | 40 |
| 4 | 2 | 960 | 480 | 480 | 450 | 240 | 40 |
| 2 | 1 | 400 | 480 | 480 | 450 | 240 | 40 |
| 1 | 0 | 180 | 480 | 480 | 450 | 240 | 40 |
| 0.5 | −1 | 80 | 220 | 220 | 220 | 170 | 15 |
| 0.25 | −2 | 45 | 110 | 120 | 130 | 90 | 7 |
| 0.125 | −3 | 24 | 50 | 56 | 70 | 50 | 3 |
| 0.0625 | −4 | 12 | 23 | 32 | 40 | 23 | 1.6 |
| 0.0313 | −5 | 7 | 9 | 15 | 20 | 7.5 | 1 |
| 0.0156 | −6 | 2.8 | 4 | 7.5 | 10 | 2.6 | 0.54 |
| 0.0780 | −7 | 1.2 | 1.7 | 4 | 6 | 0.93 | 0.35 |
| 0.0039 | −8 | 0.6 | 0.76 | 2.3 | 3.3 | 0.47 | 0.25 |
| 0.0020 | −9 | 0.6 | 0.44 | 1.3 | 2 | 0.38 | 0.25 |
| 0.0010 | −10 | 0.54 | 0.44 | 0.9 | 1.3 | 0.35 | 0.25 |
| Maximum luminance | 4000 | 480 | 480 | 450 | 240 | 40 | |
| Minimum luminance | 0.54 | 0.44 | 0.9 | 1.3 | 0.35 | 0.25 | |
| Contrast ratio | 7407:1 | 1091:1 | 533:1 | 346:1 | 686:1 | 160:1 | |
| Stops | 12.9 | 10.1 | 9.1 | 8.4 | 9.4 | 7.3 | |

The measured contrast ratio data do not always correspond with manufacturer-stated data. This may be due to differences in the test methods, as well as differences in the test conditions. Contrast is typically measured by two methods, on/off and American National Standards Institute (ANSI) (International Committee for Display Metrology, 2012). On/off measures first a full black screen, followed by a full white screen, and therefore is a sequential, full range, type contrast measurement. ANSI uses a checkerboard pattern displaying black and white at the same time, and is therefore a simultaneous-type contrast measurement. The ANSI measurement is also dependent on the configuration of the test room, and the amount of light that is reflected back onto the screen, potentially reducing overall contrast. For the 15-stop HDR test card, the measurement data presented in Table 20.3 are similar to the ANSI simultaneous-type measurement data.
As an example, SIM2 states an ANSI contrast of greater than 20,000:1 (14.3 stops) as compared with the contrast for the measured data of 7407:1 (12.9 stops) (SIM2, 2014). The measured data in Table 20.3 were based on the created 15-stop HDR test card as opposed to an ANSI test card, and the exact SIM2 test room conditions were unknown. This may account for some of the 1.43 f-stop difference between the measured contrast ratio and manufacturer-stated contrast ratio. Further testing is required to verify the differences.
A graphical representation of the luminance data is shown in Fig. 20.23. From the graph the additional dynamic range of the SIM2 LCD with LED backlight monitor as compared with devices is observed in the region from 450 cd/m2 to a peak luminance of 4000 cd/m2. The total dynamic range of the SIM2 HDR47ES4MB monitor was measured as 12.9 stops.

The Dolby PRM monitor, as configured, had a peak luminance of 450 cd/m2 in the sRGB color space. The total dynamic range of the Dolby PRM monitor in this case was 10.1 stops. The Toshiba 4K LED monitor had a peak luminance of 240 cd/m2. Care had to be taken to ensure the dynamic range autoadjust function was disabled, as measurements were taken in a dark environment, in which the autoadjust feature reduces the output luminance. The total dynamic range of the Toshiba 4K LED monitor was 9.4 stops. The Samsung plasma monitor had a peak luminance of 40 cd/m2. The total dynamic range of the Samsung plasma monitor was 7.3 stops.
The addition of an HDR workflow and a display device provides the capability to increase the simultaneous contrast ratio, and ultimately the observable luminance dynamic range. The workflow must include data structures such as 16-bit floats that are capable of storing the data, and display devices with significant contrast ratio to display it. Ultimately, efficient HDR encoding algorithms will be needed to encode and allow real-time playback at various quality standards. End user hardware and software will be required that is compatible with the HDR data, including integration with standard postprocessing vendor applications.
20.7 Conclusions
HDR is a critical capability of imaging systems for use as engineering documentation of rocket launches. Digital imaging systems have now surpassed the dynamic range capability of film cameras used during the Space Shuttle program. The capability and use of digital imagers requires testing and evaluation, both in a controlled laboratory environment and during actual launch events. Field testing provided real-world lessons and experience with the current state of digital image systems. This experience transferred to the laboratory in terms of qualification testing of dynamic range capture, development of data workflows, and measurement of display device output luminance capability.
It is clear that future dynamic range workflows will require an examination of the entire digital process from capture to display. Handling of linear and nonlinear data formats, application of appropriate gamma response curves, conversion to low dynamic range and HDR, tone mapping, metadata, and display hardware and software must be considered. The digital imager marketplace is rapidly expanding and experiencing an ever-increasing number of new product releases. More access to the raw data is commonplace, creating opportunities for analysis and increasing complexity. Appropriate HDR test methods will need to continually evolve in order to match the advancement of technology.
The ultimate goal of implementation of HDR technology with digital imaging of spacecraft is to increase both the observable simultaneous and the overall sequential contrast ratio. This will allow image analysts the ability to “see” more of what is happening in the launch environment in a single playback, without adjustment of the available dynamic range, rescanning of film, or multiple iterations of playback.
With such an array of imagers available at a wide variety of price points, a better understanding of imager capabilities will aid in the making of more objective and cost-conscious purchase decisions regarding the implementation of new image systems. Future work will include the evaluation and prediction of the required dynamic range of specific scenes under variable lighting conditions. This work could include an evaluation of the required accuracy of the lighting model as well as the verification process. Finally, remote and automatic control of digital imagers adjusted on the basis of real-time lighting conditions will also be investigated further.