
Chapter 18
The ParaView Visualization
Application
Utkarsh Ayachit, Berk Geveci
Kitware, Inc.
Kenneth Moreland
Sandia National Laboratories
John Patchett, Jim Ahrens
Los Alamos National Laboratory
18.1 Introduction ...................................................... 383
18.2 Understanding the Need ......................................... 384
18.3 The ParaView Framework ....................................... 386
18.3.1 Configurations ........................................... 386
18.4 Parallel Data Processing ......................................... 387
18.5 The ParaView Application ....................................... 390
18.5.1 Graphical User Interface ................................. 390
18.5.2 Scripting with Python ................................... 391
18.6 Customizing with Plug-ins and Custom Applications ........... 391
18.7 Co-Processing: In Situ Visualization and Data Analysis ........ 392
18.8 ParaViewWeb: Interactive Visualization for the Web ........... 393
18.9 ParaView In Use ................................................. 394
18.9.1 Identifying and Validating Fragmentation in Shock
Physics Simulation ....................................... 394
18.9.2 ParaView at the Los Alamos National Laboratory ..... 396
18.9.3 Analyzing Simulations of the Earth’s Magnetosphere .. 397
18.10 Conclusion ........................................................ 397
References .......................................................... 399
ParaView is an open-source, multiplatform data analysis and visualization
application and framework. ParaView enables users to quickly build visual-
izations to analyze their data using qualitative and quantitative techniques.
The data exploration can be done interactively in 3D or programmatically
using ParaView’s batch processing capabilities.
.
383
384 High Performance Visualization
18.1 Introduction
This chapter describes the design and features of ParaView [15, 3], a tool
that enables visualization and analysis for extremely large data sets. Para-
View is a full-featured, general purpose user application with a graphical user
interface as well as a scripting interface that can be used to build visualiza-
tion pipelines for data analysis and rendering. At the same time, ParaView
is a framework for developing highly customized, domain-specific applications
for the desktop [1] or for the web [8]. Additionally, ParaView can be directly
linked into the simulation code for analysis [5] where data processing happens
as a step in the simulation code itself.
As a user application, ParaView supports the visualization and render-
ing of large data sets in parallel, on distributed-memory machines, in diverse
configurations, with minimal effort. These configurations includes multitile
displays and immersive VR environments such as CAVE [4, 14]. ParaView
supports hardware-accelerated parallel rendering using IceT (Chap. 17) and
using level-of-detail (LOD) techniques to further improve rendering perfor-
mance during interaction.
As an application framework, ParaView provides an API for developing
highly customized applications that can have domain-specific user interfaces
with custom workflows. Developers can also build plug-ins that add complex
functionality to the ParaView application, itself. Some examples of the plug-
ins include new readers, writers, or even user interface panels and wizards.
As an in situ processing framework, ParaView provides a library that
is flexible enough to be embedded in various simulation codes with relative
ease. The co-processing library can also be easily extended so that users can
deploy new analysis and visualization techniques to existing co-processing
installations.
This chapter begins with a brief discussion of the requirements and use-
cases ParaView was designed to address, while also looking at some of the
major features of ParaView that enable high performance visualization. Fi-
nally, the chapter explores some of the exciting applications where ParaView
serves as a vital visualization and analysis tool.
18.2 Understanding the Need
In the early 2000s, computational sciences started gaining momentum
thanks to the advent of advanced HPC resources, which made it possible
to solve large problems that were intractable until then. As simulation runs
started getting bigger, so did the data results that needed to be analyzed.
Therefore, the paradigm of fetching the data locally and then analyzing it
started to become impractical. Also, there was a dearth of general purpose
visualization tools. Most institutions developed custom solutions for problems
at hand, but they were inflexible and hard to maintain or adapt to different
The ParaView Visualization Application 385
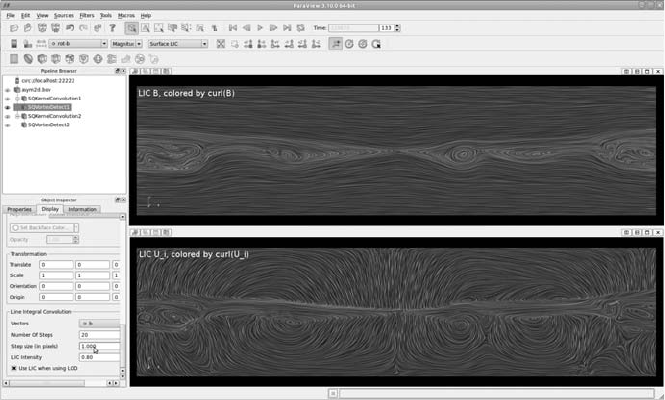
FIGURE 18.1: ParaView being used in the analysis of flow patterns associated
with magnetic flux ropes. Image courtesy of Homa Karimabadi (UCSD) and
Burlen Loring (LBNL).
problems. There was a need for an easy-to-use, general purpose visualization
application that could handle large data sets by leveraging the parallel com-
puting capabilities offered by the HPC resources. Some of the requirements
for such an application are described briefly below.
HPC sites often differ in the configurations they use for their setups. Some
clusters comprise of identical nodes equipped with graphics cards, while others
are set up to do hardware-accelerated rendering only on a smaller subset
of nodes. Still others are composed of large M×N tile displays and other
immersive configurations like CAVE. It is necessary that the visualization
application supports all these configurations to provide the best possible user
experience and utilization of the resources available. Furthermore, different
sites have different mechanisms for authenticating and submitting jobs. It is
necessary that the application hides these complexities from the user.
The ability to handle large data is also a critical requirement. Large data
is defined as data that exceeds the resource limits of a single machine. A vi-
sualization application needs to exploit techniques like data streaming and
parallelism so that it can visualize such large data. For ensuring that all the
processing happens within reasonable performance limits, techniques like mul-
tiresolution representations and parallelism can help improve data processing
and rendering performance.
Albeit important, visualization is just one of the many tasks a simulation
scientist encounters. Thus, it is essential that visualization tools are simple,
intuitive, and easy-to-use so that they can be easily integrated into scientific
386 High Performance Visualization
workflows. Developers should also be able to customize the application to add
support for file formats, for example, and also, under interface components,
make it easier for experts to use a specific domain.
These are some of the major requirements that led to the design and
development of ParaView.
18.3 The ParaView Framework
ParaView is designed as a layered architecture. At the core is the visualiza-
tion toolkit (VTK ) [13]. VTK provides ParaView with a robust data model
that can handle most types of data sets that modern simulation codes can
produce including adaptive mesh refinement (AMR), curvilinear grids, un-
structured grids with hexes, tets and even higher-order elements, and block
hierarchies. VTK also provides the execution model that defines the mecha-
nism for specifying algorithms that process or produce data and interactions
between different algorithms connected in a pipeline. On top of the VTK layer
sits the ParaView ServerManager, which abstracts the complexity of dealing
with remote and distributed environments. The ServerManager provides the
client with an unified interface to build visualization pipelines without requir-
ing it to understand the configuration in which ParaView is being operated.
The user interface layer is built on top of the ServerManager. This layered ap-
proach allows for the rapid development of different applications that leverage
the full parallel data processing and visualization capabilities of ParaView.
ParaView currently provides three standard interface implementations: the
Qt-based GUI that forms the ParaView application, a Python-based script-
ing interface that supports batch scripting, and a web-based interface that is
availableasParaViewWeb.
VTK, and consequently ParaView, is based on what is known as the vi-
sualization pipeline [6, 10]. The visualization pipeline comprises filters with
inputs and outputs that can be connected together in a data flow pipeline.
As the data flows into the input of a filter, it is processed by the filter to
produce an output result which is then fed as the input for the next filter
in the pipeline and so on. ParaView’s ServerManager exposes this underlying
pipeline to the application layer. Additionally, ParaView provides higher-level
abstractions such as views and representations for rendering the data. Views
correspond to a display viewport in which data can be shown. Representa-
tions correspond to the data processing and mapping algorithms that convert
raw data to forms suitable for presenting in a view. There are several types
of views used to generate different renderings of the data including 3D views,
line plots, bar plots, parallel coordinate plots, etc.

The ParaView Visualization Application 387
18.3.1 Configurations
ParaView can be functionally classified into three components: a data-
server (where all the data processing and filtering happens), a render-server,
and a client (which encapsulates the control and interface components). Differ-
ent runtime configurations are defined for ParaView, based on which process
these three components reside. When the ParaView client starts up, by default
all three functions are performed by the same process. This is the simplest case.
ParaView can then connect to a remote pvserver process that can be running
on a distributed machine. In this case, the data-server and render-server roles
are taken over by the pvserver processes. Alternatively, the remote servers can
be launched as a pvdataserver acting as the data-server and a pvrenderserver
acting as the render-server, both of which can be running in parallel. This
configuration is suitable in setups where all nodes in the cluster cannot be
used for rendering. Finally, ParaView can also be run in batch mode using pv-
batch. When running in parallel in this mode, the root-node acts as the client,
while all the nodes in the group work as the data-server and render-server
combined. When using any of the client–server configurations, it’s possible to
pass command line arguments to the server executables to provide information
about tile displays or other immersive setups.
18.4 Parallel Data Processing
ParaView handles large data sets by using data parallelism. In this opera-
tional mode, the data is divided amongst participating processes. Each process
performs the same operation on its piece of data. Extra communication maybe
required to ensure that the results of performing the operation on chunks of
data is the same as performing the operation on the whole data set.
For demonstrative purposes, consider the very simplified mesh below.
Now suppose the user wants to perform visualizations on this mesh using three
processes. The white, gray, and stippled gray regions divide the cells of the
mesh as shown below.
..................Content has been hidden....................
You can't read the all page of ebook, please click here login for view all page.