

Chapter 19
The ViSUS Visualization Framework
Valerio Pascucci
University of Utah
Giorgio Scorzelli
University of Utah
Brian Summa
University of Utah
Peer-Timo Bremer
University of Utah
Attila Gyulassy
University of Utah
Cameron Christensen
University of Utah
Sujin Philip
University of Utah
Sidharth Kumar
University of Utah
19.1 Introduction ...................................................... 402
19.2 ViSUS Software Architecture .................................... 402
19.3 Applications ...................................................... 408
References .......................................................... 412
The ViSUS software framework
1
has been designed as an environment that
allows the interactive exploration of massive scientific models on a variety of
hardware, possibly over geographically distributed platforms. This chapter is
devoted to the description of the scalability principles that are at the basis of
1
For more information and software downloads see http://visus.co and
http://visus.us.
401
402 High Performance Visualization
the ViSUS design and how they can be used in practical applications, both in
scientific visualization and other domains such as digital photography or the
exploration of geospatial models.
19.1 Introduction
The ViSUS software framework was designed with the primary philosophy
that the visualization of massive data need not be tied to specialized hardware
or infrastructure. In other words, a visualization environment for large data
can be designed to be lightweight, highly scalable, and run on a variety of plat-
forms or hardware. Moreover, if designed generally, such an infrastructure can
have a wide variety of applications, all from the same code base. Figure 19.1
details example applications and the major components of the ViSUS infras-
tructure. The components can be grouped into three major categories: first,
a lightweight and fast out-of-core data management framework using multi-
resolution space-filling curves. This allows the organization of information in
an order that exploits the cache hierarchies of any modern data storage ar-
chitectures. Second, a data flow framework that allows data to be processed
during movement. Processing massive data sets in their entirety would be a
long and expensive operation, which hinders interactive exploration. By de-
signing new algorithms to fit within this framework, data can be processed
as it moves. The third category is a portable visualization layer, which was
designed to scale from mobile devices to Powerwall displays with same the
code base. This chapter describes the ViSUS infrastructure, and also explores
practical examples in real-world applications.
19.2 ViSUS Software Architecture
Figure 19.1 provides a diagram of the ViSUS software architecture. This
section details ViSUS’s three major components and how they are used to
achieve a fast, scalable, and highly portable data processing and visualization
environment.
Data Access Layer. The ViSUS data access layer is a key component allow-
ing an immediate and efficient data pipeline processing that otherwise would
be stalled by traditional system I/O cost. In particular, the ViSUS I/O com-
ponent, and its generalized database component, are focused on enabling the
effective deployment of out-of-core and data streaming algorithms. Out-of-
core computing [11] specifically addresses the issues of algorithm redesign and
data layout restructuring. These are necessary to enable data access patterns
having minimal performance degradation with external memory storage. Al-
gorithmic approaches in this area also yield valuable techniques for parallel
and distributed computing. In this environment, one typically has to deal with

The ViSUS Visualization Framework 403
FIGURE 19.1: The architecture of the ViSUS software framework. Arrows
denote external and internal dependences of the main software components.
Additionally, the architecture shows the relationship with several example
applications that have been successfully developed with this framework.
the similar issue of balancing processing time with the time required for data
access and movement among elements of a distributed or parallel application.
The solution to the out-of-core processing problem is typically divided into
two parts: (1) algorithm analysis, to understand the data access patterns and,
when possible, redesign algorithms to maximize data locality; and (2) storage
of data in the secondary memory using a layout consistent with the access
patterns of the algorithm, amortizing the cost of individual I/O operations
over several memory access operations.
To achieve real-time rates for visualization and/or analysis of extreme scale
data, one would commonly seek some form of adaptive level of detail and/or
data streaming. By traversing simulation data hierarchically from the coarse
to the fine resolutions and progressively updating output data structures de-
rived from this data, one can provide a framework that allows for real-time
access of the simulation data that will perform well even on an extreme scale
data set. Many of the parameters for interaction, such as display viewpoint,
are determined by users at runtime, and therefore, precomputing these levels
of details optimized for specific queries is infeasible. Therefore, to maintain
efficiency, a storage data layout must satisfy two general requirements: (1) if
the input hierarchy is traversed in coarse-to-fine order, data in the same level
of resolution should be accessed at the same time; and (2) within each level of
resolution, the regions in close spatial proximity are stored in close proximity
in memory.
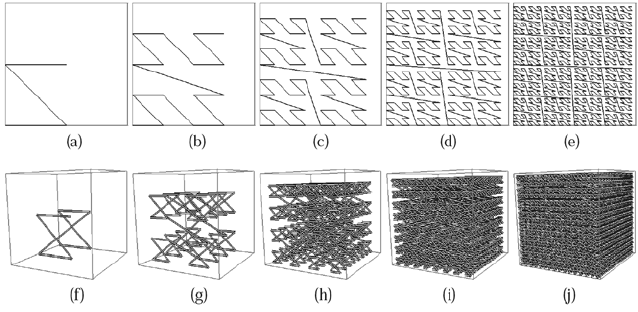
Space-filling curves [9] were also used successfully to develop a static in-
dexing scheme that generates a data layout satisfying both the above re-
quirements for hierarchical traversal (see Fig. 19.2). The data access layer of
ViSUS employs a hierarchical variant of a Lebesgue space-filling curve [5].
The data layout of this curve is commonly referred to as an HZ-order in the
404 High Performance Visualization
FIGURE 19.2: (a)–(e) The first five levels of resolution of the 2D Lebesgue’s
space-filling curve. (f)–(j) The first five levels of resolution of the 3D Lebesgue’s
space-filling curve.
literature. This data access layer has three key features that make it particu-
larly attractive. First, the order of the data is independent of the out-of-core
block structure, so that its use in different settings (e.g., local disk access or
transmission over a network) does not require any large data reorganization.
Second, conversion from the Z-order indexing [4] used in classical database
approaches to ViSUS’s HZ-order indexing scheme can be implemented with a
simple sequence of bit string manipulations. Third, since there is no data repli-
cation, the performance penalties associated with guaranteeing consistency are
avoided, especially for dynamic updates and increased storage requirements,
typically associated with most hierarchical and out-of-core schemes.
Parallel I/O for Large Scale Simulations. The multiresolution data lay-
out of ViSUS, discussed above, is a progressive, linear format and, therefore,
has a write routine that is inherently serial. During the execution of large scale
simulations, it is ideal for each node in the simulation to be able to write its
piece of the domain data directly into this layout. Therefore, a parallel write
strategy must be employed. Figure 19.3 illustrates different possible parallel
strategies that have been considered. As shown in Figure 19.3a, each process
can naively write its own data directly to the proper location in a unique
underlying binary file. This is inefficient, though, due to the large number of
small granularity, concurrent accesses to the same file. Moreover, as the data
gets large, it becomes disadvantageous to store the entire data set as a sin-
gle, large file and typically the entire data set is partitioned into a series of
smaller more manageable pieces. This disjointness can be used by a parallel
write routine. As each simulation process produces a portion of the data, it
can store its piece of the overall data set locally and pass the data on to an
aggregator process.

The ViSUS Visualization Framework 405
FIGURE 19.3: Parallel I/O strategies: (a) Naive approach where each process
writes its data in the same file; (b) an alternative approach where contiguous
data segment is transmitted to an intermediate aggregator that writes to disk;
and (c) communication reducing approach with bundling of noncontiguous
accesses into a single message.
The aggregator processes can be used to gather the individual pieces and
composite the entire data set. Figure 19.3b shows this strategy, where each
process transmits a contiguous data segment to an intermediate aggregator.
Once the aggregator’s buffer is complete, the data is written to disk using a
single large I/O operation. Figure 19.3c, illustrates a strategy where several
noncontiguous memory accesses from each process are bundled into a single
message. This approach also reduces the overhead due to the number of small
network messages needed to transfer the data to the aggregators. This strategy
has been shown to exhibit a good throughput performance and weak scaling
for S3D combustion simulation applications when compared to the standard
Fortran I/O benchmark [2, 3]. In particular, recent results
2
have shown empir-
ically how this strategy scales well for a large number of nodes (currently up
to 32,000) while enabling real-time monitoring of high-resolution simulations
(see 19.3).
LightStream Dataflow and Scene Graph. Even simple manipulations
can be overly expensive when applied to each variable in a large-scale data
set. Instead, it is ideal to process the data based on need, by pushing data
through a processing pipeline as the user interacts with different portions
of the data. The ViSUS multiresolution data layout enables efficient access
to different regions of the data at varying resolutions. Therefore, different
compute modules can be implemented using progressive algorithms to operate
on this data stream. Operations like binning, clustering, or rescaling are trivial
to implement on this hierarchy, given some known statistics on the data,
such as the function value range, etc. These operators can be applied to the
data stream as is, while the data is moving to the user, progressively refining
2
Execution on the Hopper 2 system at NERSC.
..................Content has been hidden....................
You can't read the all page of ebook, please click here login for view all page.