
406 High Performance Visualization
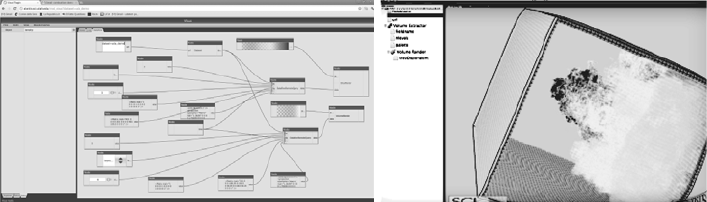
FIGURE 19.4: The LightStream data flow used for analysis and visualiza-
tion of a 3D combustion simulation (Uintah code). Several data flow modules
chained together to provide a light and flexible stream processing capability
(left). One visualization that is the result from this data flow (right).
the operation as more data arrives. More complex operations can also be
reformulated to work well using the hierarchy. For instance, using the layout
for 2D image data produces a hierarchy, which is identical to a subsampled
image pyramid on the data. Moreover, as data is requested progressively, the
transfer will traverse this pyramid in a coarse-to-fine manner. Techniques like
gradient-domain image editing can be reformulated to use this progressive
stream and produce visually acceptable solutions [10, 7, 8]. These adaptive,
progressive solutions allow the user to explore a full resolution solution as if
it was fully available, without the expensive, full computation.
ViSUS LightStream facilitates this stream processing model by providing
definable modules within a data flow framework with a well-understood API.
Figure 19.4 gives an example of a data flow for the analysis and visualization
of a scientific simulation. This particular example is the data flow for a Uintah
combustion simulation used by the Center for the Simulation of Accidental
Fires and Explosions (C-SAFE) at the University of Utah. Each LightStream
module provides streaming capability through input and output data ports
that can be used in a variety of data transfer/sharing modes. In this way,
groups of modules can be chained to provide complex processing operations
as the data is transferred from the initial source to the final data analysis and
visualization stages. This data flow is typically driven by user demands and
interactions. A variety of “standard” modules are part of the base system, such
as data differencing (for change detection), content-based image clustering (for
feature detection), or volume rendering with multiple, science-centric transfer
function. These can be used by new developers as templates for their own
progressive streaming data processing modules.
ViSUS also provides a scene graph hierarchy for both organizing objects
in a particular environment and the sharing and inheriting of parameters.
Each component in a model is represented by a node in this scene graph and
inherits the transformations and environment parameters from its parents. 3D
volume or 2D slice extractors are children of a data set node. As an example
The ViSUS Visualization Framework 407
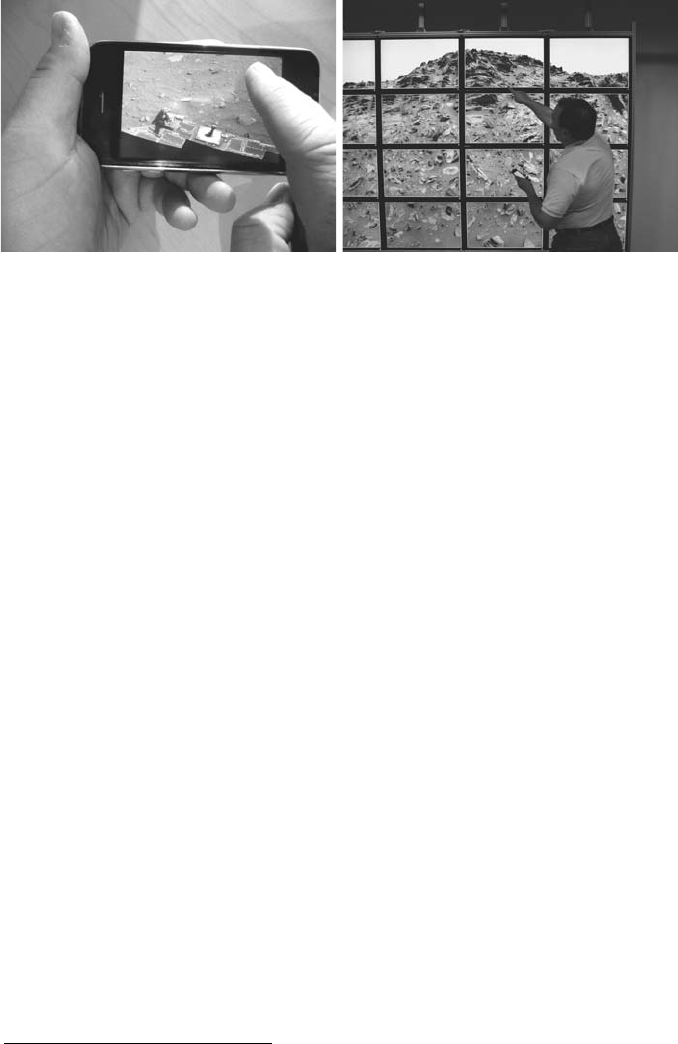
FIGURE 19.5: The same application and visualization of a Mars panorama
running on an iPhone 3G mobile device (left) and a Powerwall display (right).
Data courtesy of NASA.
of inheritance, a scene graph parameter for a transfer function can be applied
to the scene graph node of a data set. If the extractor on this data set does
not provide its own transfer function, it will be inherited.
Portable Visualization Layer—ViSUS AppKit. The visualization com-
ponent of ViSUS was built with the philosophy that a single code base can be
designed to run on a variety of platforms and hardware ranging from mobile
devices to Powerwall displays. To enable this portability, the the basic draw
routines were designed to be OpenGL ES compatible. This is a limited subset
of OpenGL used primarily for mobile devices. More advanced draw routines
can be enabled if a system’s hardware can support it. In this way, the data vi-
sualization can scale in quality depending on the available hardware. Beyond
the display of the data, the underlying GUI library can hinder portability
to multiple devices. At this time, ViSUS has made use of the Juce
3
library,
which is lightweight and supports mobile platforms such as iOS and Android in
addition to major operating systems. ViSUS provides a demo viewer, which
contains standard visualizations such as slicing, volume rendering, and iso-
surfacing. Similarly to the example LightStream modules, these routines can
be expanded through a well-defined API. Additionally, the base system can
display 2D and 3D time-varying data. As mentioned above, each of these vi-
sualizations can operate on the end result of a LightStream data flow. The
system considers a 2D data set as a special case of a slice renderer, and there-
fore, the same code base is used for 2D and 3D data sets. Combining all of
theabovedesigndecisionsallowsthesamecodebasetobeusedonmultiple
platforms, seamlessly, for data of arbitrary dimensions. Figure 19.5 shows the
same application and visualization running on an iPhone 3G mobile device
and a Powerwall display.
3
See http://www.rawmaterialsoftware.com.

408 High Performance Visualization
FIGURE 19.6: The ViSUS software framework visualizing and processing
medical imagery. On the left, the Neurotracker application providing the seg-
mentation of neurons from extremely high-resolution Confocal Fluorescence
Microscopy brain imagery. This data is courtesy of the Center for Integrated
Neuroscience and Human Behavior at the Brain Institute, University of Utah.
In the center, an application for the interactive exploration of an electron mi-
croscopy image of a slice of a rabbit retina. This data set is courtesy of the
MarcLab at the University of Utah. On the right, a 3D slicing example using
the Visible Male data set.
19.3 Applications
As shown in the upper and right portions of the infrastructure diagram
in Figure 19.1, ViSUS has the versatility to be used in a wide range of appli-
cations. This section highlights a representative subset of these applications.
The general philosophy behind the ViSUS applications is the deployment of
light tools that are task driven as a complement to general-purpose solutions
provided by other existing systems.
Neurotracker and Other Medical Applications. The Neurotracker is
an application built on the ViSUS framework that targets the segmentation
of neurons from extremely high resolution Confocal Fluorescence Microscopy
brain imagery.
4
The core data processing of the Neurotracker uses the ViSUS
I/O library to get fast access to the brain imaging data combined with multi-
resolution topological analysis used to seed the segmentation of neurons. A
marching image segmentation routine extracts filament structures from the
topological seeds. The user interface of the the Neurotracker is built with the
ViSUS GUI components specialized for segmentation.
Figure 19.6 also highlights two additional medical imaging applications.
In the center image of Figure 19.6, an example of the ViSUS framework is
used for interactive exploration of an electron microscopy image of a slice of
a rabbit retina. In all, this 2D data set is over 3.4 gigapixels in size.
5
On the
right of Figure 19.6 is a 3D data slicing example of the Visible Male
6
data set
comprised of over 4.6 billion color voxels.
4
Data is courtesy of the Center for Integrated Neuroscience and Human Behavior at the
Brain Institute, University of Utah (http://brain.utah.edu/).
5
Data is courtesy of the MarcLab at the University of Utah (http://prometheus.med.
utah.edu/ extasciitilde{}marclab/).
6
See http://www.nlm.nih.gov/research/visible/visible\_human.html.

The ViSUS Visualization Framework 409
FIGURE 19.7: Remote climate visualization with ViSUS. The ViSUS frame-
work providing a visualization for a temperature change ensemble simulation
for the Earth’s surface for the December 2009 climate summit meeting in
Copenhagen (left). A visualization of global cloud density for a more recent
climate simulation (right).
Web server and plug-in. ViSUS has been extended to support a client–
server model in addition to the traditional viewer. The ViSUS server can be
used as a standalone application or a web server plug-in module. The ViSUS
server uses HTTP (a stateless protocol) in order to support many clients.
A traditional client–server infrastructure, where the client established and
maintained a stable connection to the server, can only handle a limited number
of clients robustly. Using HTTP, the ViSUS server can scale to thousands of
connections. The ViSUS client keeps a number of connections (normally 48)
alive in a pool using the “keep-alive” option of HTTP. The use of lossy or
lossless compression is configurable by the user. For example, ViSUS supports
JPEG and EXR for lossy compression of byte and float data, respectively.
Because the ViSUS server is an open client–server architecture, it is therefore
possible to port the plug-in to any web server which supports a C++ module
(i.e., apache, IIS). The ViSUS client can be enabled to cache data to the
local memory or to a disk. In this way, a client can minimize transfer time by
referencing data already sent, as well as having the ability to work offline if
the server becomes unreachable. The ViSUS portable visualization framework
(Appkit) also has the ability to be compiled as a Google Chrome, Microsoft
Internet Explorer, or Mozilla Firefox web browser plug-in. This allows a ViSUS
framework based viewer to be easily integrated into web visualization portals.
Remote Climate Analysis and Visualization. The ViSUS software
framework has been used in the climate modeling community to visualize
climate change simulations comprised of many variables over a large num-
ber of timesteps. This type of data provides the opportunity to both build
high-quality data analysis routines and challenge the performance of the data
management infrastructure. Figure 19.7 shows ViSUS rendering 10TB of data
used by a finalist in the Data Transfer Challenge of Supercomputing 2009.
Initially, this work showed the possibility of transferring, transforming, ana-
lyzing, and rendering a large data set on geographically distributed computing
resources [1]. At the same time, this work was also used to introduce more

410 High Performance Visualization
FIGURE 19.8: 500 megapixel visualization of a 2D panorama data set of
Mount Rushmore (left). The color shift between images in a panorama mosaic
(middle). An application using a LightStream data flow to provide approxi-
mate gradient domain solution as a user interacts with the data (right). Data
set courtesy of City Escapes Photography.
forms of analysis and visualizations, providing novel insights into the dynamics
of global carbon cycle, atmospheric chemistry, land and ocean ecological pro-
cesses, and their coupling with climate. This work was used to present findings
regarding the Earth’s temperature change based on historical and projected
simulation data at a December 2009 climate summit meeting in Copenhagen.
The right of Figure 19.7 shows the ViSUS framework providing a visualization
of global cloud density for a more recent simulation.
Panorama Multiscale Processing and Viewer. The ViSUS framework
along with the LightStream data flows can be used for real-time, large
panorama processing and visualization. In Figure 19.8, the left image is a
visualization of a 500 megapixel 2D image of Mount Rushmore.
7
In this flat-
tened image, there are detected color shifts due to the fact that the image
is a mosaic of many individual images. The middle of Figure 19.8 provides a
visualization of the original picture data for a panorama of Salt Lake City,
which is comprised of over 600 individual images for a total image mosaic size
of 3.2 gigapixels. As mentioned in 19.2, the LightStream data flow can be used
to operate on the multiresolution data as the panorama is being viewed and
provide an approximate gradient domain solution [10, 7, 8] for each viewpoint.
In this way, a user can explore the panorama as if the full gradient domain
solution was available without it ever being computed in full. This preview is
shown on the right in Figure 19.8.
Real-Time Simulation Monitoring. Ideally, a user-scientist would like to
view a simulation as it is computed, in order to steer or correct the simulation
as unforeseen events arise. Simulation data is often very large. For instance, a
single field of a timestep from the S3D combustion simulation in Figure 19.9
(left) is approximately 128 GB in size. In the time needed to transfer this
single timestep, the user-scientist would have lost any chance for significant
steering/correction of an ongoing simulation or at least take the opportunity
7
Data courtesy of City Escapes Photography (http://www.cityescapesphotography.
com).
..................Content has been hidden....................
You can't read the all page of ebook, please click here login for view all page.