
420 High Performance Visualization
trol, based on the grid sampling rate. LOD selection primarily impacts I/O,
while refinement control has implications for both primary storage (RAM)
and computation. Coarser grids have a smaller memory footprint, and can
substantially reduce memory requirements, as well as the computational and
graphical expense of many visual and nonvisual analysis operations, whose
costs are proportional to the number of grid points.
The next concrete example illustrates the concepts of LOD and multi-
resolution, and their respective impacts on computing resources. Assume a
computing mesh with 1024
3
grid points that are transformed into a VDC,
resulting in three levels of detail corresponding to compression rates of 1:1 (no
compression), 10:1, and 100:1. The wavelet coefficients for each LOD reside
in separate files on a disk named lod2, lod1,andlod0, respectively. More-
over, the number of coefficients stored in each file would be approximately
1024
3
−
1024
3
10
−
1024
3
100
,
1024
3
10
−
1024
3
100
,and
1024
3
100
, respectively. As described
earlier, reconstruction of our data using the coarsest approximation (100:1)
requires reading the coefficients from lod0, while the second coarsest approxi-
mation is reconstructed from the coefficients from both lod1 and lod0,andso
on. The choice of LOD will determine how much data are read from a disk.
Due to the multiresolution properties of wavelets, a second form of data re-
duction can be had by performing an incomplete wavelet reconstruction, halt-
ing the inverse transform after the grid has been reconstructed to 512
3
, 256
3
,
or 128
3
grid points, for example. A multiresolution approximation contains
fewer grid points than the original data, thus resulting in reduced memory
and compute resources required to store and operate on the approximation.
Note that the grid resolution refinement selection is independent of the LOD.
However, regardless of the refinement level, higher level LODs will contribute
more information, leading to more a more accurate approximation.
20.3 Visualization-Guided Analysis
As an illustration of the visualization-guided analysis capabilities of VA-
POR, this section describes the workflow used in addressing a research prob-
lem in Magneto-Hydrodynamics (MHD) [6]. The data set explored is output
from an MHD simulation with a high Reynolds number, computed on a 1536
3
grid, with 16 variables, requiring 216GB per timestep. It was expected that,
at this resolution, geometric structures, known as current sheets, would form.
A current sheet is characterized by the magnitude of the electrical current
achieving local maxima along a 2D surface. While current sheets were ex-
pected to appear, it was not known exactly what shapes these surfaces would
take. There are theoretical reasons to expect that the current sheets could wind
into a rolled-up structure, i.e., a current roll; however, this phenomenon was
not observed in previous simulations. Direct volume rendering of one scalar
variable from the data, at full-resolution, without data reduction, would be
possible, but the demands on computing resources would be substantial. The

The VAPOR Visualization Application 421
(a) (b)
(c) (d)
FIGURE 20.1: Exploration of the current field of a 1536
3
MHD simulation. A
volume rendering of current magnitude generated using reduced data (a), an
isolated ROI exhibiting a current “roll-up” (b), a close up of the phenomenon
(c), and magnetic field lines passing through the center of the roll-up (d). The
images in (b)–(d) were generated with the highest refinement level and LOD
data.
image in Figure 20.1a is a full-domain volume rendering of the current field
reconstructed from the VDC by reading only
1
100
oftheavailablewavelet
coefficients and performing a partial inverse wavelet transform to produce a
grid with
1
64
the resolution of the original mesh (384
3
grid points). Both the
reduction in grid resolution (saving computation and memory costs) and in
the wavelet coefficients used to reconstruct the variable from wavelet space
(saving I/O costs) were necessary for interactivity.
Through visual inspection of the highly compressed data involving the in-
teractive manipulation of viewpoints, transfer functions, and cutting planes,
a small ROI was identified, containing a current roll shown isolated in Fig-
ures 20.1b and 20.1c. Once isolated, additional visualization and analysis tools

422 High Performance Visualization
can be interactively applied in this smaller region, using both increased grid
resolution and LOD quality. In Figure 20.1d, two contour planes are shown,
along with the magnetic field lines passing through the center of the roll. The
seeding location for these field lines was selected by picking locations on the
contour planes in regions of high current magnitude, near the center of the
current roll cross section.
20.4 Progressive Access Examination
To further illustrate the effectiveness of VAPOR’s progressive access data
model, a qualitative comparison of VAPOR’s two data reduction techniques—
LOD and refinement level selection—are presented below. Two different data
sets are used for comparison: the MHD data discussed in the previous section,
and a numerical weather simulation of the severe Atlantic storm, Erica [5],
computed on a 1300 × 950 × 50 grid. The MHD data set is used to demon-
strate the impact of data reduction on direct volume rendering, while the
Erica data set is used to demonstrate the impact to pathline integration in
an unsteady velocity flow field. Figure 20.2a shows a volume rendering of the
original MHD data, while Figure 20.2b shows data reduced by both LOD and
resolution. Similarly, Figure 20.4a shows the integration over 20 timesteps of
five randomly seeded pathlines, while Figure 20.4b shows the results when
using reduced data.
(a) (b)
FIGURE 20.2: Volume rendering of an isolated ROI showing the magnitude
of the current field from a 1536
3
simulation. The original, unreduced data
are shown (a) along with data reduced by a combination of both LOD and
resolution (b). The corresponding reduction factors for LOD and resolution
coarsening are 10:1 and 8:1, respectively.
Figures 20.3 and 20.5 compare images generated with reduced MHD and
Erica data, respectively. The top rows show images generated from data at
the highest refinement level, but with LODs corresponding to compression
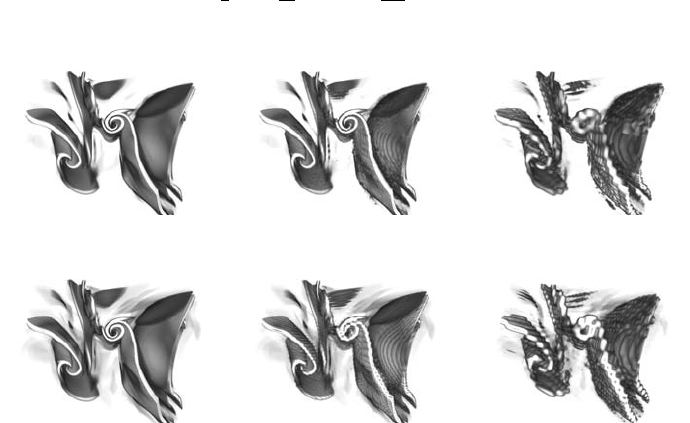
The VAPOR Visualization Application 423
rates of 10:1 (a), 100:1 (b), and 500:1 (c). Similarly, the bottom rows show
images generated from data at the highest LOD, but with refinement levels
corresponding to grids at
1
8
(d),
1
64
(e), and
1
512
(f) of the original resolution.
(a) (b) (c)
(d) (e) (f)
FIGURE 20.3: Direct volume rendering of reduced MHD enstrophy data (vol-
ume rendering of original data shown in Figure 20.2a). The images in the top
row were produced with the native grid resolution, but varying the LODs with
reduction factors of 10:1 (a), 100:1 (b), and 500:1 (c). The bottom row used
the highest LOD for all images, but varies the grid resolutions with reduction
factors of 8:1 (d), 64:1 (e), and 512:1 (f). Reduced LOD primarily benefits
I/O performance, while reduced grid resolution primarily benefits memory,
computation, and graphics.
The reader can subjectively evaluate the quality of these images, keeping
in mind the substantial reductions in data involved. While the leftmost images
would obviously be preferable for publication purposes, many analysis oper-
ations might be suitable for enabling qualitative understanding, using highly
compressed data for visualization.
20.4.1 Discussion
In general, the accuracy of the reduced data depends strongly on the data’s
properties, in particular the degree of coherence between neighboring sam-
ples. However, the two examples presented above illustrate some principles
generally applicable in the visualization of large data sets. When performing
volume rendering (or similar visualizations, such as isosurface rendering, that
map data values to graphics primitives), there is little benefit to having grid

424 High Performance Visualization
(a) (b)
FIGURE 20.4: Pathlines from the time-varying velocity field of a simulation
of the Atlantic storm Erica. Pathlines generated from the original, unreduced
data are shown (a), along with data reduced by a combination of both LOD
and resolution (b). The corresponding reduction factors for LOD and resolu-
tion coarsening are 10:1 and 8:1, respectively.
resolutions whose screen projection sampling rate exceeds, or even approaches,
that of the display device itself. Visual quality rarely improves by increasing
the refinement level once the projected voxels subtend a screen area smaller
than the screen pixel size. In such a case, little information is lost if resolution
is reduced, to afford interactivity.
Similarly, when performing an unsteady flow integration (or other opera-
tions requiring significant CPU processing on multiple volumes of data), it is
again valuable to perform the initial analysis and visualization interactively.
Interactivity can be obtained by using both lowered resolution and level of de-
tail, and also by reducing the time sampling rate. By performing visualization
and analysis on a small subregion, the quality impact of resolution, time sam-
pling and compression level can be assessed. The desired visualizations can
be previewed interactively at a lower accuracy by setting up the appropriate
parameters for a subsequent noninteractive session of sufficient accuracy, to
precisely illustrate the features of interest.
20.5 Conclusion
VAPOR provides a desktop environment for the interactive exploration
of high-resolution numerical simulation outputs. The interactive exploration
of data sets, whose size would otherwise overwhelm desktop computing re-
..................Content has been hidden....................
You can't read the all page of ebook, please click here login for view all page.