
The VAPOR Visualization Application 425
(a) (b) (c)
(d) (e) (f)
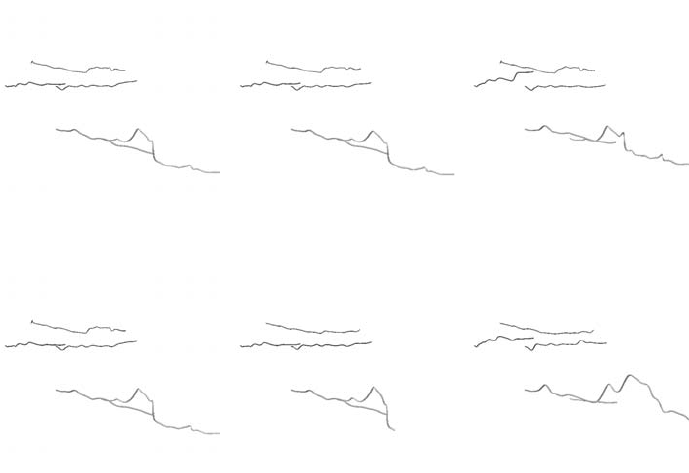
FIGURE 20.5: Pathline integration of five randomly seeded pathlines using
reduced storm simulation data. Pathlines generated with original data shown
in Figure 20.4a. The images in the top row were produced with the native
grid resolution, but varying the LODs with reduction factors of 10:1 (a), 100:1
(b), and 500:1 (c). The bottom row used the highest LOD for all images, but
varies the grid resolutions with reduction factors of 8:1 (d), 64:1 (e), and 512:1
(f).
sources, is enabled by the use of a variety of user-controllable data reduction
techniques. These include:
• compression ratio (LOD selection), which is in direct proportion to the
I/O performed;
• refinement level (resolution), which is proportional to processing time
(including graphics rendering time), and also, it can have a significant
impact on memory overhead, and;
• a time sampling rate and region size, both of which are in direct pro-
portion to both processing time and I/O time.
To maintain interactivity, users can explicitly manipulate the parameters
associated with all of these data reduction offerings provided by VAPOR.
426 High Performance Visualization
When final, high-quality results are required, the parameters can be set for
possibly noninteractive visualization and performed without user supervision,
provided the computing platform has sufficient resources to handle the full
fidelity data.
In addition to these user-controllable mechanisms, VAPOR also makes
extensive use of data caching to avoid the unnecessary recalculation of previous
results, and more significantly, to minimize the reading of data from secondary
storage.
The VAPOR Visualization Application 427
References
[1] John Clyne, Pablo Mininni, Alan Norton, and Mark Rast. Interactive
Desktop Analysis of High Resolution Simulations: Application to Tur-
bulent Plume Dynamics and Current Sheet Formation. New Journal of
Physics, 9(301), 2007.
[2] John Clyne and Mark Rast. A Prototype Discovery Environment for An-
alyzing and Visualizing Terascale Turbulent Fluid Flow Simulations. In
Proceedings of Visualization and Data Analysis 2005, January 2005.
[3] Eric Jones, Travis Oliphant, Pearu Peterson, et al. SciPy: Open Source
Scientific Tools for Python, 2012. http://www.scipy.org/.
[4] John Lamping, Ramana Rao, and Peter Pirolli. A Focus+Context Tech-
nique Based on Hyperbolic Geometry for Visualizing Large Hierarchies. In
Proceedings of the SIGCHI conference on Human Factors in Computing
Systems, CHI ’95, pages 401–408, 1995.
[5] Ching-Hwang Liu and Roger M. Wakimoto. Observations of Mesoscale
Circulations within Extratropical Cyclones over the North Atlantic Ocean
during ERICA. Monthly Weather Review, 125(3), 1997.
[6] P. D. Mininni, A. Pouquet, and D. C. Montgomery. Small Scale Structures
in Three-Dimensional Magnetohydrodynamic Turbulence. Physical Review
Letters, 97(244503), 2006.
..................Content has been hidden....................
You can't read the all page of ebook, please click here login for view all page.