

Back End
Task 0
Back End
Task 1
Back End
Task n
•
•
•
Viewer
Thread 0
•
•
•
Viewer
Thread 1
Viewer
Thread n
Data
Source
Scene
Graph
DBase
Render
and
Display
Partially Rendered
Payload
Renderable
Scene Data
Visapult ViewerVisapult Back End
Desktop/WorkstationParallel
Platform
FIGURE 3.4 Visapult’s remote and distributed visualization architecture. Image courtesy of E.
Wes Bethel (LBNL).
FIGURE 3.6 An unmodified molecular docking application, run in parallel, on a distributed-mem-
ory system using CRRS. Here, the cluster is configured for a 3 w 2 tiled display setup. The monitor
for the “remote user machine” in this image is the one on the right. Image source: Paul et al., 2008.

(f)
RGB(f)
f
RGB
Shading, Compositing
…
Map data value f
to color and opacity
FIGURE 4.3 Volume rendering overview. The volume is sampled, samples are assigned optical
properties (RGB, Alpha). The different properties are shaded and composited to form the final image.
FIGURE 4.4 On 60 nodes, the system can ray cast (left image) a 316M triangle isosurface
from timestep 273 of a Richtmyer-Meshkov (RM) instability calculation (LLNL), in HD resolution,
at 101fps, with replicated data, 21,326MB of triangles and acceleration structures, and at 16fps if
the DC is used to store only 2,666MB per node. Using one shadow ray or 36 ambient occlusion rays
per pixel (right image) the system can achieve 4.76fps and 1.90fps, respectively. Image source: Ize
et al., 2011.
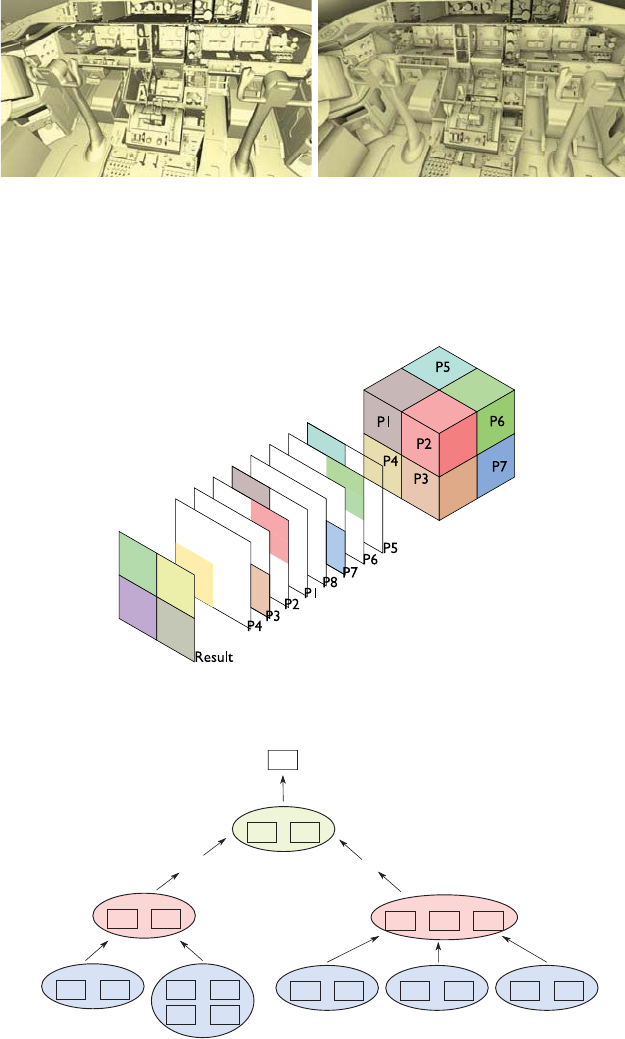
FIGURE 4.5 On 60 nodes, the 259M triangle Boeing data set using HD resolution can be ray cast
(left image) at 96fps if all 15,637MB of triangle and acceleration structure data are replicated on
each node and at 77fps if DC is used to store only 1,955MB of data and cache per node. Using 36
ambient occlusion rays per pixel (right image) the system achieves 1.46fps. Image source: Ize et al.,
2011.
FIGURE 5.1 Sort-last image compositing.
!"#$"%& !"#$"%&
!"#$"%& !"#$"%&
!"#$"%&
!"#$"%&
'''
'''
'''
'''
!"#$"%&
(
")*+,-
(")*+,.
(")*+,/
(&%)01
(&%)01
(&%)01 (&%)01
(&%)01
(&%)01
(&%)01
(&%)01
23*40,(&%)01
!"#$"%&
(&%)01
FIGURE 5.3 Tree-based compositing.

Table of
target k-
values for
Intrepid
BG/P and
Jaguar
XT5
!"" #" $%" &'"
#" #" #" #" #"
$%" $%" $%" $%" $%"
&'" &'" &'" &'" &'"
%!" %!" %!" %!" %!"
$'#" %!" $'#" $'#" $'#"
'(%" %!" $'#" $'#" $'#"
($'" %!" $'#" $'#" $'#"
$")" %!" $'#" $'#" $'#"
'")" &'" $'#" $'#" $'#"
!")" &'" &'" &'" &'"
#")" &'" &'" &'" &'"
$%")" &'" &'" &'" &'"
&'")" &'" &'" &'" &'"
!" #" $%" &'"
!" !" !" !"
!" !" !" !"
$%" #" $%" $%"
$%" $%" $%" $%"
#" #" #" #"
$%" #" #" #"
$%" &'" #" #"
%!" &'" &'" #"
#" &'" &'" &'"
#" $%" &'" %!"
!" #" &'" %!"
!" &'" &'" #"
$%" $%" %!" #"
Intrepid Jaguar
Megapixels
Processes
FIGURE 5.8 Target k-values for two different machines are shown. Optimizations such as active
pixel encoding enable the use of higher k-values than before. In the original algorithm, k = 8 was
used, but the tables above show that with active-pixel encoding, k-values as high as 128 are opti-
mal, depending on the machine.
FIGURE 5.10 Core-collapse supernova volume rendered in parallel and composited using the
radix-k algorithm.

FIGURE 6.2 Streamlines showing outflows in a magnetic flow field computed by an Active
Galactic Nuclei astrophysics simulation (FLASH). Image courtesy of D. Pugmire (ORNL), data cour-
tesy of Paul Sutter (UIUC).
FIGURE 6.1 A stream surface visualizes recirculating flow in a vortex breakdown bubble. The
surface, computed from high-resolution adaptive, unstructured flow simulation output, consists of
several million triangles and was rendered using an adaptive approach for its transparency, designed
to reveal the flow structure inside the bubble. Two stripes highlight the different trajectories taken
by particles encountering the recirculation. Image courtesy of C. Garth, University of Kaiserslautern,
data courtesy of M. Rütten, German Aerospace Center, Göttingen.
..................Content has been hidden....................
You can't read the all page of ebook, please click here login for view all page.