

P
T
P
H
IntegrationI/O
FIGURE 12.12 This Gantt chart shows a comparison of integration and I/O performance/activity
of the parallelize-over-seeds P
T
and P
H
versions for one of the benchmark runs. Each line represents
one thread (left column) or task (right column). The P
H
approach outperforms the P
T
one by about
10w, since the four I/O threads in the P
H
can supply new data blocks to the four integration threads
at an optimal rate. However, work distribution between nodes is not optimally balanced. In the P
T
implementation, the I/O wait time dominates the computation by a large margin, due to redundant
data block reads, and work being distributed less evenly. This can be easily seen in the enlarged
section of the Gantt chart. Image source: Camp et al., 2011.

P
H
P
T
2 tasks
integrating
8 threads
integrating
Integration
I/O
MPI Send
MPI Recv
FIGURE 12.14 This Gantt chart shows a comparison of integration, I/O, MPI_Send, and MPI_
Recv performance/activity of the parallelize-over- blocks P
T
and P
H
versions for one of the benchmark
runs. Each line represents one thread (top) or task (bottom). The comparison reveals that the initial
I/O phase, using only one thread, takes about 4x longer. The successive integration is faster, since
multiple threads can work on the same set of blocks, leading to less communication. Towards the
end, the eight threads are performing IC integration in the P
H
approach, as opposed to only two tasks
in the P
T
model. Image source: Camp et al., 2011.
FIGURE 13.1 Contouring of two trillion cells, visualized with VisIt on Franklin using 32000 cores.
Image source: Childs et al., 2010.

FIGURE 13.3 Contouring of replicated data (one trillion cells total), visualized with VisIt on
Franklin using 16,016 cores. Image source: Childs et al., 2010.
FIGURE 13.4 Rendering of an isosurface from a 321 million cell Denovo simulation, produced by
VisIt using 12,270 cores of JaguarPF. Image source: Childs et al., 2010.

FIGURE 13.5 Volume rendering of data from a 321 million cell Denovo simulation, produced by
VisIt using 12,270 cores on JaguarPF. Image source: Childs et al., 2010.
FIGURE 13.6 Volume rendering of one trillion cells, visualized by VisIt on JaguarPF using 16,000
cores. Image source: Childs et al., 2010.
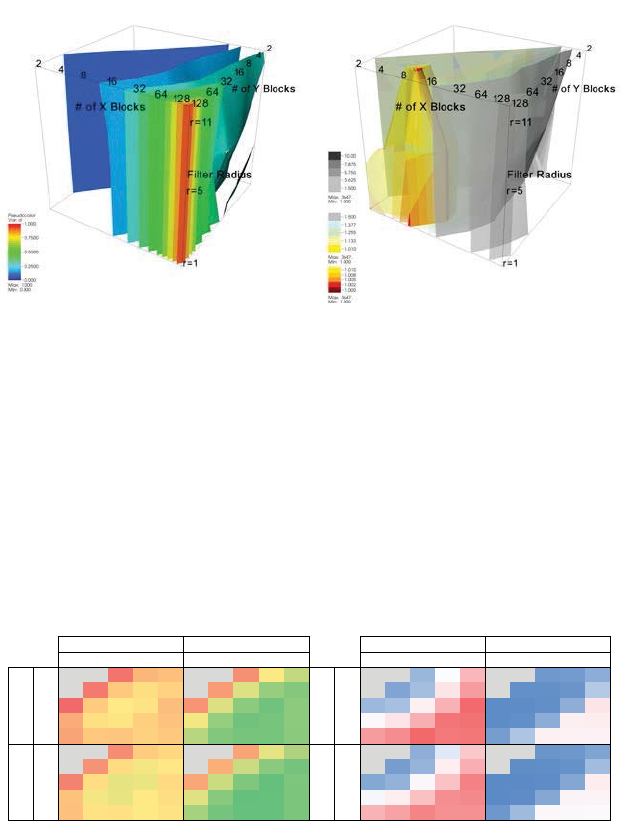
(a) Runtimes normalized by maximum
highlight the poorest performing configu-
rations.
(b) Runtime normalized by minimum
highlight the best performing configura-
tions.
FIGURE 14.5 Visualization of performance data collected by varying the number and size of the
GPU thread blocks for the 3D bilateral filter are shown at three different filter sizes, r = {1, 5, 11}.
In (a), the performance data (normalized to the maximum value) highlights the poorest performing
configurations; the red and yellow isocontours are close to the viewer. In (b), the performance data
(normalized to the minimum value) highlights the best performing configurations. These appear as
the cone-shaped red/yellow isocontours. Image source: Bethel, 2009.
124 8161 2 4 816
1 2.92 1.61 1.00 0.77 0.74 3.00 1.59 0.90 0.58 0.44
2 1.64 0.98 0.71 0.63 0.68 1.58 0.86 0.51 0.35 0.30
4 1.04 0.70 0.59 0.61 0.74 0.89 0.51 0.32 0.26 0.33
8 0.81 0.63 0.61 0.68 0.73 0.56 0.34 0.25 0.27 0.32
16 0.83 0.71 0.72 0.68 0.71 0.42 0.30 0.27 0.27 0.32
1 2.69 1.48 0.92 0.70 0.66 2.77 1.46 0.83 0.53 0.40
2 1.51 0.90 0.64 0.57 0.60 1.46 0.79 0.47 0.32 0.27
4 0.95 0.64 0.53 0.54 0.65 0.82 0.46 0.29 0.23 0.29
8 0.73 0.56 0.54 0.60 0.63 0.51 0.31 0.23 0.24 0.28
16 0.74 0.62 0.62 0.59 0.61 0.38 0.27 0.24 0.24 0.28
NoERT
ERT
Array Order Z Order
(a) Runtime (s)
124 8161 2 4 816
1 38 39 50 115 481 27 25 25 28 42
2 32 36 57 238 632 18 17 17 22 67
4 52 59 179 517 907 14 14 16 43240
8 139 243 527 839 873 14 17 43 182 202
16 636 724 909 827 834 29 63 176 166 166
1 33 33 4395401 24 23 22 24 35
2 25 29 48 193 530 16 15 15 19 56
4 38 47144 429 773 12 12 14 37 198
8 106 192 436 711 74112 14 37 153 163
16 506 596 765 696 701 24 53 148 137 130
Array Order
Z Order
NoERTERT
(b) L2 cache misses (millions)
FIGURE 14.6 Parallel ray casting volume rendering performance measures on the NVIDIA/Fermi
GPU include absolute runtime (a), and L2 cache miss rates (b), averaged over ten views for dif-
ferent thread block sizes. Gray boxes indicated thread blocks with too few threads to fill a warp of
execution. Surprisingly, the best performing configurations do not correspond to the best use of the
memory hierarchy on that platform. Image source: Bethel and Howison, 2012.
..................Content has been hidden....................
You can't read the all page of ebook, please click here login for view all page.