

FIGURE 19.7 Remote climate visualization with ViSUS. The ViSUS framework providing a visu-
alization for a temperature change ensemble simulation for the Earth’s surface for the December
2009 climate summit meeting in Copenhagen (left). A visualization of global cloud density for a more
recent climate simulation (right).
FIGURE 19.8 500 megapixel visualization of a 2D panorama data set of Mount Rushmore (left).
The color shift between images in a panorama mosaic (middle). An application using a LightStream
data flow to provide approximate gradient domain solution as a user interacts with the data (right).
Data set courtesy of City Escapes Photography.

(a) (b)
(c) (d)
FIGURE 20.1 Exploration of the current field of a 1536
3
MHD simulation. A volume rendering of
current magnitude generated using reduced data (a), an isolated ROI exhibiting a current “roll-up”
(b), a close up of the phenomenon (c), and magnetic field lines passing through the center of the
roll-up (d). The images in (b)–(d) were generated with the highest refinement level and LOD data.

(a) (b)
FIGURE 20.2 Volume rendering of an isolated ROI showing the magnitude of the current field
from a 1536
3
simulation. The original, unreduced data are shown (left) along with data reduced by
a combination of both LOD and resolution (right). The corresponding reduction factors for LOD and
resolution coarsening are 10:1 and 8:1, respectively.

(a) (b) (c)
(d) (e) (f)
FIGURE 20.3 Direct volume rendering of reduced MHD enstrophy data (volume rendering of
original data shown in Figure 20.2a). The images in the top row were produced with the native grid
resolution, but varying the LODs with reduction factors of 10:1 (a), 100:1 (b), and 500:1 (c). The bot-
tom row used the highest LOD for all images, but varies the grid resolutions with reduction factors of
8:1 (d), 64:1 (e), and 512:1 (f). Reduced LOD primarily benefits I/O performance, while reduced grid
resolution primarily benefits memory, computation, and graphics.
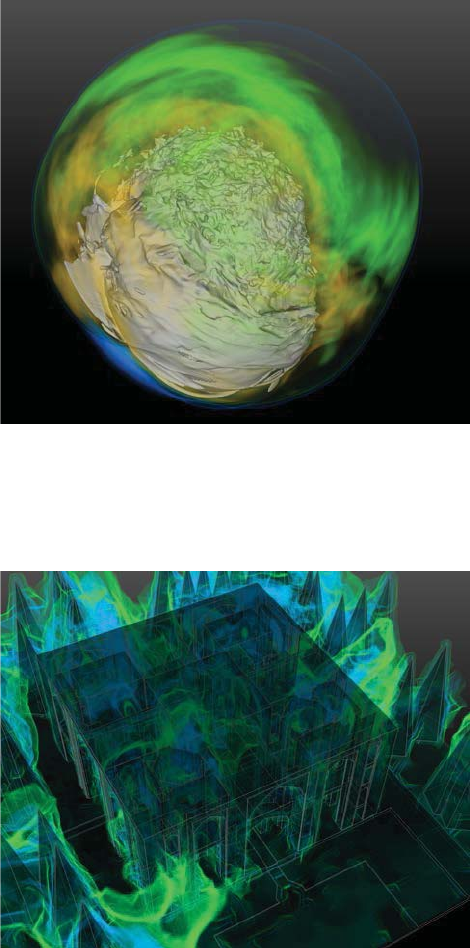
FIGURE 21.5 Supernova remnant density field rendering, demonstrating distributed structured
volume rendering, with embedded polygonal surfaces. Data courtesy of Dr. John Blondin, North
Carolina State University.
FIGURE 21.6 Simulated air flow through the Kashan–Iran Fin Garden building and surrounding
vegetation. Unstructured volume rendered velocity through semi-transparent architectural geom-
etry. Data courtesy of Studio Integrate.
..................Content has been hidden....................
You can't read the all page of ebook, please click here login for view all page.