
122 High Performance Visualization
dex for a high-cardinality variable typically requires many bitmaps. One can
reduce the number of bitmaps needed by binning the data. However, the cor-
responding index would not be able to answer some queries accurately. The
cost of resolving the query accurately could be quite high [25]. Additional
data structures might be needed to answer the queries with predictable per-
formance [42].
The bitmaps inside the bitmap indices also offer a way to count the num-
ber of records satisfying certain conditions quickly. This feature can be used
to quickly compute conditional histograms. For example, in addition to di-
rectly counting from the bitmaps, it is also possible to count the rows in
each histogram bucket by reading the relevant raw data, or use a combina-
tion of bitmaps and the raw data. Stockinger et al. [29] described a set of
algorithms for efficient parallel computation of conditional histograms. The
ability to quickly compute conditional histograms, in turn, accelerates many
histogram-based visualization methods, such as histogram-based parallel coor-
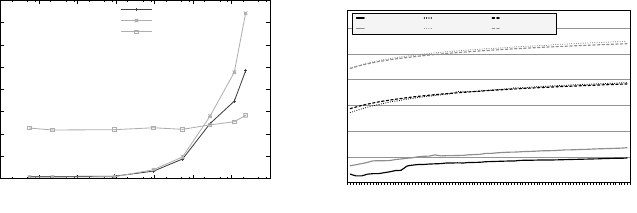
dinates described later in 7.3.1. Figure 7.2a illustrates the serial performance
for computing conditional histograms, using bitmap indexing by way of the
FastBit [36] software.
Histogram-based analysis methods—such as density-based segmentation
and feature detection methods—require the ability to evaluate bin-queries
efficiently [26]. A bin-query extracts the data associated with a set of histogram
bins and is comprised of a series of queries, for example, in the 3D case, of
the form [(x
i
≤ x<x
i+1
)AND(y
i
≤ y<y
i+1
)AND(z
i
≤ z<z
i+1
)], where i
indicates the index of a selected bin and x, y,andz refer to the dimensions
of the histogram. Instead of evaluating complex bin-queries explicitly, one
can use bitmaps—one for each nonzero histogram bin—to efficiently store the
inverse mapping from histogram-bins to the data. Figure 7.2b illustrates the
performance advantage of this approach for evaluating bin-queries. In practice,
the overhead for computing the per bin bitmaps depends on the number of
nonzero bins, but is, in general, moderate.
A number of the above described methods have been implemented in an
open-source software called FastBit [36]. In the context of QDV, FastBit is
used to process range queries and equality queries, as well as to compute
conditional histograms and bin-queries. FastBit has also been integrated with
the parallel visualization system VisIt, described later in Chapter 16, making
FastBit-based QDV capabilities available to the user community.
7.2.2 Data Interfaces
In order to make effective use of semantic indexing methods to accelerate
data subselection, advanced data interfaces are needed that make index and
query methods accessible within state-of-the-art scientific data formats. Such
interfaces should ideally have the following characteristics. First, they enable
access to a large range of scientific data formats. Second, they avoid costly
data copy and file conversion operations for indexing purposes. Third, they
Query-Driven Visualization and Analysis 123
H H H
7LPHV
1XPEHURI+LWV
)DVW%LW5HJXODU
)DVW%LW$GDSWLYH
&XVWRP5HJXODU
(a) Conditional histogram performance.
27.06s
245.56s
27.37s
301.13s
0.740s
6.724s
0.517s
7.537s
0.004s
0.022s
0.002s
0.009s
0.001
0.01
0.1
1
10
100
1000
10
16
22
28
34
40
46
52
58
64
70
76
82
88
94
100
106
Time in seconds
Number of selected bins
Bitvector (2D) FastBit (2D) Sequential (2D)
Bitvector (3D) FastBit (3D) Sequential (3D)
(b) Bin-query performance.
FIGURE 7.2: On the left, (a) shows timings for serial computation of regularly
and adaptively binned 2D histograms on a 3D (≈ 90 ×10
6
particles) particle
data set using bitmap indexing and a baseline sequential scan method. Image
source: R¨ubel et al. 2008 [27]. Timings for serial evaluation of 3D bin-queries
are shown in (b), using a 2D (≈ 2.4 ×10
6
particles) and 3D (≈ 90 ×10
6
parti-
cles) particle data set. Bin queries are evaluated using: (1) per-bin bitvectors
returned by FastBit, (2) FastBit queries, and (3) a baseline sequential scan
method. Image source: R¨ubel et al., 2010 [26].
scale to massive data sets. Fourth, they are capable of performing indexing
and query operations on large, distributed, multicore platforms. For example,
Gosink et al. [16] described HDF5-FastQuery, a library that integrates serial
index/query operations using FastBit with HDF5.
Recently, Chou et al. introduced FastQuery [9], which integrates parallel-
capable index/query operations using FastBit—including bitmap index com-
putation, storage, and data subset selection—with a variety of array-based
data formats. FastQuery provides a simple array-based I/O interface to the
data. Access to the data is then performed via data format specific readers
that implement the FastQuery I/O interface. The system is, in this way, ag-
nostic to the underlying data format and can be easily extended to support
new data formats. FastQuery also uses FastBit for index/query operations. To
enable parallel index/query operations, FastQuery uses the concept of sub-
arrays. Similar to Fortran and other programming languages, subarrays are
specified using the general form of lower : upper : stride. Usage of subarrays
provides added flexibility in the data analysis, but more importantly—since
subarrays are, by definition, smaller than the complete data set—index/query
times can be greatly reduced compared to approaches that are constrained
to processing the entire data set. This subarray feature, furthermore, enables
FastQuery to divide the data into chunks during index creation, chunks that
can be processed in parallel in a distributed-memory environment. Evaluation
of data queries is then parallelized in a similar fashion. In addition to subar-
rays, FastQuery also supports parallelism across files and data variables. Chou
124 High Performance Visualization
et al. demonstrated good scalability of both indexing and query evaluation,
to several thousands of cores. For details, see the work by Chou et al. [9].
7.3 Formulating Multivariate Queries
Semantic indexing provides the user with the ability to quickly locate
data subsets of interest. In order to make effective use of this ability, efficient
interfaces and visualization methods are needed that allow the user to quickly
identify data portions of interest, specify multivariate data queries to extract
the relevant data, and validate query results. As mentioned earlier, a QDV-
based analysis is typically performed in a process of iterative refinement of
queries and analysis of query results. To effectively support such an iterative
workflow, the query interface and visualization should provide the user with
feedback on possible strategies to refine and improve the query specification,
and be efficient to provide the user with fast, in-time feedback about query-
results, in particular, within the context of large data.
Scientific visualization is very effective for the analysis of physical phenom-
ena and plays an important role in the context of QDV for the validation of
query results. Highlighting query results in scientific visualizations provides an
effective means for the analysis of spatial structures and distributions of the
selected data portions. However, scientific visualization methods are limited
with respect to the visualization of high-dimensional variable space in that
only a limited number of data dimensions can be visualized at once. Scientific
visualizations, hence, play only a limited role as interfaces for formulating
multivariate queries.
On the other hand, information visualization methods—such as scatter-
plot matrix and parallel coordinate plots—are very effective for the visualiza-
tion and exploration of high-dimensional variable spaces and the analysis of
relationships between different data dimensions. In the context of QDV, infor-
mation visualizations, therefore, play a key role as interfaces for the specifica-
tion of complex, multidimensional queries and the validation of query results.
Both scientific and information visualization play an important role in
QDV. In the context of QDV, multiple scientific and information visualization
views—each highlighting different aspects of the data—are, therefore, often
linked to highlight the same data subsets (queries) in a well-defined manner
to facilitate effective coordination between the views. In literature, this design
pattern is often referred to as brushing and linking [34]. Using multiple views
allows the user to analyze different data aspects without being overwhelmed
by the high dimensionality of the data.
To ease validation and refinement of data queries, automated analysis
methods may be used for the post-processing of query results to, for example,
segment and label the distinct spatial components of a query. Information de-
rived through the post-processing of query results provides important means
Query-Driven Visualization and Analysis 125
to enhance the visualization, to help suggest further query refinements, and
to automate the definition of queries to extract features of interest.
The next sections describe the use of parallel coordinates as an effective
interface to formulate high-dimensional data queries (see 7.3.1). Afterwards,
the post-processing of query results are discussed, enhancing the QDV-based
analysis through the use of automated methods for the segmentation of query
results and methods for investigation of the importance of variables to the
query solution and their interactions (see 7.3.2).
7.3.1 Parallel Coordinates Multivariate Query Interface
Parallel coordinates are a common information visualization technique [18].
Each data variable is represented by a vertical axis in the plot (see Fig. 7.3).
A parallel coordinates plot is constructed by drawing a polyline connecting
the points where a data record’s variable values intersect each axis.
Parallel coordinates provide a very effective interface for defining multi-
dimensional range queries. Using sliders attached to each parallel axis of the
plot, a user defines range thresholds in each displayed data dimension. Selec-
tion is performed iteratively by defining and refining thresholds one axis at a
time. By rendering the user-selected data subset (the focus view) in front of
the parallel coordinates plot created from the entire data set—or a subset of
the data defined using a previous query—(the context view), the user receives
immediate feedback about general properties of the selection (see Fig. 7.7).
Data outliers stand out visually as single or small groups of lines diverging
from the main data trends. Data trends appear as dense groups of lines (or
bright colored bins, in the case of histogram-based parallel coordinates). A
comparison of the focus and context view helps to convey understanding about
similarities and differences between the two views. Analysis of data queries de-
fined in parallel coordinates, using additional linked visualizations—such as
physical views of the data—then provides additional information about the
structure of a query. These various forms of visual query feedback help to
validate and refine query-based selections. Figure 7.7 exemplifies the use of
parallel coordinates for the interactive query-driven analysis of laser plasma
particle acceleration data discussed in more detail later in 7.4.2.2.
Parallel coordinates also support iterative, multiresolution exploration of
data at multiple time-scales. For example, initially a user may view data on
a weekly scale. After selecting a week(s) of interest, this initial selection may
be used as context view. By scaling the parallel axis to show only the data
ranges covered by the context selection—also called dimensional scaling—the
selection can be viewed and refined in greater detail at daily resolution.
In practice, parallel coordinates have disadvantages when applied to very
large data. In the traditional approach, the parallel coordinates plot is ren-
dered by drawing a polyline for each data record. When there are relatively
few data records, this approach is reasonable and produces legible results. But
when applied to large data sets, the plot can be quickly cluttered and difficult

126 High Performance Visualization
(a) (b)
(c)
FIGURE 7.3: The left images, (a) and (b), show a comparison of two different
parallel coordinate renderings of a particle data set consisting of 256,463 data
records and 7 variables using: (a) traditional line-based parallel coordinates
and (b) high-resolution, histogram-based parallel coordinates with 700 bins
per data dimension. The histogram-based rendering reveals many more details
when displaying large numbers of data records. Image (c) shows the temporal
histogram-based parallel coordinates of two particle beams in a laser-plasma
accelerator data set, at timesteps t =[14, 22]. Color is used to indicate the dis-
crete timesteps. The two different beams can be readily identified in x (second
axis). Differences in the acceleration can be clearly seen in the momentum in
the x direction, px (first axis). Image source: R¨ubel et. al, 2008 [27].
to interpret, as is the case in Figure 7.3a. Worst of all, the computational and
rendering complexity of parallel coordinates is proportional to the size of the
data set. As data sizes grow, these problems quickly become intractable.
Histogram-based parallel coordinates [27, 21] are an efficient, density-based
method for computing and rendering parallel coordinates plots. Rather than
viewing the parallel coordinates plot as a collection of polylines (one polyline
per data record), one can discretize the relationship of all data records between
pairs of parallel axes using 2D histograms.
Based on the 2D histograms—one per neighboring axes pair—rendering
proceeds by drawing one quadrilateral per nonempty bin, where each quadri-
lateral connects two data ranges between the neighboring axes. Quadrilateral
color and opacity is a function of histogram bin magnitude, so more densely
populated regions are visually differentiated from regions with lower density.
This approach has a significant advantage for large data applications: the
rendering complexity no longer depends on the size of the original data, but
only on the resolution of the underlying histograms. The histograms, for the
context view, need to be computed only once. The calculation of the focus
view histograms happens in response to user changes to query ranges and are
accelerated by FastBit. Previous studies examine the scalability characteris-
tics of those algorithms on large supercomputers when applied to very large
scientific data sets [27, 29, 3].
Figure 7.3b shows how more information in data is revealed through a
combination of visualization and rendering principles and techniques. For ex-
ample, color brightness or transparency can convey the number of records per
..................Content has been hidden....................
You can't read the all page of ebook, please click here login for view all page.