


Management tools
This chapter provides an introduction to the Hyper-Scale Manager (HSM) management graphical user interface (GUI) for IBM XIV Gen3, IBM FlashSystem A9000 and A9000R, and IBM Spectrum Accelerate software.
The web-based GUI provides a revolutionary object-centered interface design that is aimed toward ease of use together with enhanced efficiency for storage administrators. The interface has the following features:
•Customizable dashboard
•Integrated real-time statistics
•A single-page application so that you can view all relevant information for every object at a glance
The following additional information is included in this chapter:
•Installing the Hyper-Scale Manager GUI
•Logging in to the GUI
•Adding a system to the inventory
•Removing a system or changing the IP address of a system in the inventory
|
Important: The material that is presented in this chapter was prepared with an early code of Hyper-Scale Manager 5.3 user interface (UI). Some contents and layout might differ from the version you are using.
|
1.1 Management graphical user interface
Starting with version 5.1, the Hyper-Scale Manager, which was introduced for use with FlashSystem A9000 and A9000R, provides a new web-based management GUI for all members of the Spectrum Accelerate family, including the XIV Storage System Gen3, FlashSystem A9000 and A9000R, as well as any IBM Spectrum Accelerate software installations. By using the GUI, you can manage and monitor one or more supported IBM XIV Gen3, IBM FlashSystem A9000 and A9000R, or IBM Spectrum Accelerate systems in real time from a web browser.
The following functional highlights are included:
•Customizable dashboard
•Context-oriented UI in a single-page web-based application so that you can view all relevant information for every object at a glance
•Smart view of object relationships and dependencies in a visual map (for example, a view of all volumes that are mapped to a host)
•Instant object-centered management and monitoring
•Advanced filters for focusing on the required object
•Quick tracing of objects and fast navigation between objects
•One-click selection and operation options (map, unmap, delete, and so on)
•Health score of all systems in the inventory
•Integrated statistics information
The name of the management GUI is accessed by directing your web browser at the Hyper-Scale Manager server (http://<Hyper-ScaleManager server IP address>:8080 or for secure https://<Hyper-ScaleManager server IP address>:8443).
Figure 1-1 shows the Hyper-Scale Manager login window.

Figure 1-1 IBM Hyper-Scale Manager login window
IBM Hyper-Scale Manager is also the portal for access to IBM Hyper-Scale Manager Cloud Integration and the product and application programming interface (API) documentation.
|
Tip: If Hyper-Scale Manager is not installed and configured in your environment, see 1.2, “Installing and configuring Hyper-Scale Manager” on page 22 for summarized instructions.
|
1.1.1 Working with the Storage Management GUI
The Storage Management GUI is made up of static and dynamic elements. The static elements consist of the top navigation pane and the side menu. The remainder of the display is dynamic and controlled by the user.
When you initially enter the Storage Management GUI, it displays the Dashboard view by default. (See “Dashboard” on page 5.)
Figure 1-2 shows the New Tabs view, which is represented by the white rectangle on the left. You can use search and filter options to display storage objects, such as spools, volumes, hosts, and users, according to your search criteria.

Figure 1-2 Static and dynamic elements of IBM Hyper-Scale Manager
GUI icons
Additional icons are used throughout the GUI. Running your mouse over the following icons reveals additional information. See Table 1-1.
Table 1-1 GUI icons and descriptions
|
Icon
|
Description
|
|
|
Active alerts
|
|
|
Additional information required
|
|
|
Missing information
|
|
|
Additional information provided
|
Top navigation pane
The top navigation pane of the GUI gives you quick access to system information, configuration changes, and system documentation. See Table 1-2.
Table 1-2 Top navigation pane icons, their names, and descriptions
|
Icon
|
Name
|
Description
|
Quick links for more information
|
|
|
Dashboard
|
For the overall health of attached inventory
|
|
|
|
New Tab
|
For customized searches of the attached inventory
|
|
|
|
Alerts
|
For displaying information about the highest severity issues of the attached inventory
|
|
|
|
Commands Log
|
Displays the history of XCLI commands that are used during the active session
|
|
|
|
New Item
|
For quickly adding new items, such as volumes, users, and hosts, to the attached inventory
|
|
|
|
Switch to dark
|
For quickly switch between dark and light view of GUI
|
|
|
|
Settings
|
For changing the Hyper-Scale Manager settings
|
|
|
|
Help
|
For additional GUI information and a link to the IBM Knowledge Center for product information
|
|
|
|
User
|
For logging out of the GUI
|
Dashboard
The Dashboard gives you an overall inventory status view of all systems health, data reduction savings, provisioned capacity, and real-time statistics. See Figure 1-3 and Figure 1-4 on page 6.

Figure 1-3 Dashboard for all systems that are configured in HSM

Figure 1-4 Dashboard for one type of system
|
Note: Click Switch to Dark in the upper-right corner of the window to change the color scheme of the Dashboard display.
|
The following information is available in the Dashboard view.
Health Widget (Hub)
The Health Widget, shown in Figure 1-5 and also referred to as the Hub, displays the number of systems in the inventory and a high-level view of the health of the installed inventory.

Figure 1-5 Dashboard Health Widget
If the health of the system is less than 100%, the corresponding Hub arms indicate a warning or alert with a small number in the circle at the end of each arm. Clicking the Hub arm that indicates an issue displays additional information about the issue. Clicking one of the alerts opens the table view with the associated information and actions. See Figure 1-6.
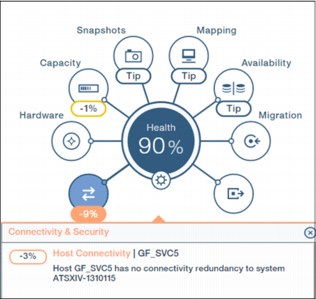
Figure 1-6 Dashboard Health Widget that shows the system with issues
Data reduction saving
The Savings section of the Dashboard displays the data reduction efficiency as a result of compression and deduplication of written data. Figure 1-7 displays information, including thin provisioning on XIV systems.

Figure 1-7 Dashboard Data Reduction Saving section
Capacity
The Capacity section of the Dashboard displays current and projected information about various capacity aspects of all, or a subset, of the systems in the inventory. See Figure 1-8.

Figure 1-8 Dashboard Capacity section
The following information is contained in the Capacity section of the Dashboard, as indicated by the corresponding letters in Figure 1-8. This is looking specifically at the same type of systems. The view for all systems in the inventory, if different types (such as FlashSystem A9000 and XIV) will look differently, as shown in Figure 1-9.
•Number of systems in the inventory (a)
•Written, allocated, and projected system capacity of the systems in the inventory (b)
•Reclaimable capacity of the systems in the inventory (c)
•Physical usage of the systems in the inventory (d)

Figure 1-9 Physical usage view for all systems in the inventory
For more detailed information about data reduction savings, see the chapter about Capacity management and planning in IBM FlashSystem A9000 and IBM FlashSystem A9000R Architecture, Implementation, and Usage, SG24-8345.
Real-time statistics
The real-time statistics section of the Dashboard displays latency and input/output operations per second (IOPS) information for all systems in the inventory. See Figure 1-10. The graphs are grouped by color based on the type.

Figure 1-10 Dashboard real-time statistics section
Tabs
Information that is displayed in a tab is determined by choices that are made by the user. The following capabilities and information are available in most of the tabs:
•Smart filtering:
– Search anything in your environment in seconds by any parameter or condition.
– Use smart filtering for policy control to find non-valid objects by searching.
– Additional wildcard filtering using an asterisk (*) and OR.
•Contextual table views:
– Can be configured with any column and mixture among mapping, mirroring, and snapshots.
– No pre-made views with separate focus points.
– The user builds a view with their own interests and tasks.
•Integrated statistics:
– Inside the GUI in real time. Helps in daily decision making.
– Shows the statistics of a chosen, historic or current element, by comparing or drilling down.
•Hub relations:
– Mini-dashboard for chosen objects.
– Ability to troubleshoot and monitor objects quickly.
•Actions:
– Always visible for any chosen object.
– User can immediately change, modify, or add anything and view properties of any object, whether aggregated or single.
– Fast modification with one click.
Getting started with Tabs
Clicking the TAB icon in the top navigation pane causes a new tab to open and it displays a large blank window with a navigation that shows how to get started in a new tab (the “Start by clicking Menu or Filter” circle). After a menu item or filter has been selected, the window in the left portion of the main window that will display information according to filters that are selected by the user. The right portion of the window displays information that is associated with the filters that are selected by the user.
Start by clicking Menu or Filter to select one of the menu items from the side menu or use the filter to begin drilling down to the information that you want, as shown in Figure 1-11. Notice that you can maximize the left side of the screen starting with V5.3 by clicking the “Expand Table” arrow.

Figure 1-11 New tab view
|
Note: New with Hyper-Scale Manager V5.3 is the ability to expand or shrink the table view as shown in Figure 1-11.
|
Selecting filters
Clicking in the filter field in the upper-left portion of the table view displays a list of commonly used filters, as shown in Figure 1-12.

Figure 1-12 Filters list
Select one of the filters (for example, Volume) in the list to display additional searchable subfilters or to simply view all matching items for the selected filter.
You can use the subfilters to quickly drill down to the information that you want. In this example, the System can be selected from the drop-down list, then other filters can be applied with. See Figure 1-13.

Figure 1-13 System list and filters
You can also use the asterisk (*) as a wildcard to search for a specific name. You can also use OR to search for more than one option. You can see this option in the drop down list (as shown in Figure 1-14) or by simply typing the wildcard option in the filter.

Figure 1-14 Filter search options
Figure 1-15 shows an example of typing in a search with a wildcard before selecting a filter. This type of search shows all the matching objects based on the entered search criteria. This example shows all objects that begin with the letter “t.”

Figure 1-15 Search with a wildcard
Use the drop-down list to select a system in the inventory. With each additional filter selection, an additional field displays, so that you can drill down to the information that you want. Remember to use the scroll bar on the right side of the list to see all of the available systems. See Figure 1-16.

Figure 1-16 Table view filter adjustment field
When all filters are selected, click the Search icon (magnifying glass) to display the results of the search, or simply press the Enter key.
If available, the lower portion of the table view displays statistical information that is based on the selection that was made. The capability to access the historic or current statistics of a chosen element for comparisons or for drilling down helps you in daily decision making. This is shown in Figure 1-17. You can have two statistical views open at the same time, under the table view.

Figure 1-17 Table view sections
You can also compare the statistics of related elements by selecting several elements in the list that is displayed.
Working with the Statistics view
Historical statistics have other filters for drilling down to more specific information. The Range menu gives you the option to choose specific time frames. See Figure 1-18.

Figure 1-18 Current and historic time range filter
Additional filters are available for historical statistics so that you can drill down to specific information. See Figure 1-19.

Figure 1-19 Historical statistics filters
Other statistical views include latency, bandwidth, physical usage, physical usage plus forecast, written/allocated, written/projected, written/projected system plus forecast and projected/actual.
|
Note: Statistics views that include potential are applicable to IBM FlashSystem A9000 and A9000R.
|
After you collect the current or historical data, a graphical representation of the data appears. Click the plus sign (+) icon in the upper-right corner to open a second view to allow comparative statistical analysis. Click the x icon in the upper-right corner to close the views. An example of this is shown in Figure 1-20.

Figure 1-20 Cloned statistics section
|
Note: If the screen resolution is big enough and the browser maximized, you might be able to open a maximum of three different statistical graphs.
|
Working with the Hub view
The Hub section of the table view gives you quick access to related information about the selected item.
Each element of a Hub leg displays related information about the selected item below the Hub, as shown in Figure 1-21. A leg with a dashed circle indicates that there are no associations with this category.

Figure 1-21 Hosts view
Beginning with Hyper-Scale Manager V5.3, when the HUB is minimized, the elements are displayed as icons on a single line, as shown in Figure 1-21.
Working with the System Hardware view
You can use the System Hardware view to click a component in the graphical representation of the hardware and drill down to specific information about that component. Hovering the cursor over any of the components in the hardware displays what that component is, as seen in Figure 1-22 on page 15. Clicking the component opens the details about it.

Figure 1-22 System Hardware view
Working with the Actions menu
Use the table view to perform certain actions against the selected system. The actions vary, depending on the filtered selection. For an example of a list of actions, see Figure 1-23.

Figure 1-23 System Actions list
|
Tip: To close the Actions menu, click the Actions menu again or click anywhere outside the menu. When opening the Actions menu with a right-click, you can close it by clicking outside the menu or with the Esc key.
|
Alerts
The Alerts window displays information about all of the alerts for the systems in the inventory. If there are active alerts on any system that is managed by the Hyper-Scale Manager, an icon displays on the top menu bar, as shown in Figure 1-24. The icon shape might change based on the severity of the alerts. Clicking the icon opens a quick view of the active alerts.

Figure 1-24 Alerts window
Click an alert in the list to begin drilling down to additional information about the alert. To close the All Alerts view, simply click the icon again or anywhere outside the view.
Commands log
The Hyper-Scale Manager issues xcli commands to the system when the administrator creates or modifies an object. Those commands are shown for an active session under the commands log icon, as shown in Figure 1-25.

Figure 1-25 Commands log
The commands that have been executed through the Hyper-Scale Manager can then be copied or exported in CSV format for later use.
|
Reminder: Commands log is generated for an active session. It is cleared with a log out from the Hyper-Scale Manager.
|
New item
Click the New icon to access a list of items that can be created. See Figure 1-26.

Figure 1-26 Create New window
Clicking any of the items in the list opens the table view. The table view displays a section for entering the required information for adding the item.
Settings
Click the Settings icon in the top navigation pane to open the Preferences window. This window is used by a storage administrator to change the Management Server preferences. See Figure 1-27.

Figure 1-27 Settings window for changing preferences
The Management Server option is available for quick access to the Inventory view where systems can be added or deleted. This option is used to maintain Management Server-related access information. If access has been restricted, the user will have to log in with advanced mode to perform these actions.
The Settings icon also includes options to launch the Cloud Integration application as well as creating a capacity report.
Help
The Help menu contains videos and documentation links for assistance with the Hyper-Scale Manager, links to IBM Knowledge Center and access to the Hyper-Scale API documentation. Help is accessed through the top menu bar using the Help icon, as shown in Figure 1-28. You will also see a file on what is new in the version installed and tips on navigating and using the Hyper-Scale Manager as well as a direct link to download the XCLI. Beginning with V5.3, you also have an option to view details about the Hyper-Scale Manager.

Figure 1-28 Help menu
User
Use the User icon to sign out of the GUI and return to the IBM Storage Manager login window. See Figure 1-29.

Figure 1-29 Sign Out window
Side menu
Use the Side menu for quick access to the following filters that are listed in Table 1-3.
Table 1-3 Side menu icons and menus
|
Icons
|
Menus
|
Quick links for more information
|
|
|
|
This icon opens the main dashboard view
|
 |
 |
|
|
|
 |
|
|
|
 |
|
|
|
 |
|
|
|
 |
|
|
|
 |
|
|
|
 |
|
|
|
 |
Connect to the online community
|
1.1.2 Systems & Domains Views
Choosing any of the systems or domains views displays the associated data in the table view:
•Systems: Displays a list of the systems in the inventory.
•Domains: Displays a list of all domains in all systems in the inventory.
•All Alerts: Displays a list of all alerts from all systems in the inventory.
•Events: Displays a list of all events from all systems in the inventory.
•System Connectivity: Displays all target connections of all systems in the inventory.
•System Ports Connectivity: Displays connectivity at the port level.
•Quorum Witnesses: Displays details about the quorum witnesses used in IBM HyperSwap®.
•Hardware View: Displays a list of all systems in the inventory and capacity information.
Clicking the top portion of the table view reveals more filter options for drilling down to specific information.
1.1.3 Statistics Views
Choosing any of the statistics filters displays associated data and statistics in the table view:
•System & Ports Performance Statistics: Displays all systems in the inventory and associated interface performance statistics in a graphical format.
•Volume Performance Statistics: Displays all volumes in all systems in the inventory and associated volume performance statistics in a graphical format.
•Host & Ports Performance Statistics: Displays all hosts in all systems in the inventory and associated performance statistics in a graphical format.
•Quality of Service (QoS) Performance Statistics: Displays QoS performance class information from all systems in the inventory and associated QoS statistics in a graphical format.
•System Capacity History & Forecast: Displays all systems in the inventory and associated interface capacity history and future forecast.
•Pool Capacity History & Forecast: Displays all pools in the inventory and associated interface capacity history and future forecast.
•Host Capacity History & Forecast: Displays all hosts in the inventory and associated interface capacity history and future forecast.
Clicking the column titles of the table view allows you to add and remove columns from the table view.
1.1.4 Pools & Volumes Views
Choosing any of the pools or volumes filters displays associated data in the table view:
•Pools: Displays all pools in all systems in the inventory.
•Volumes: Displays all volumes in all systems in the inventory and associated volume statistics in a graphical format.
•Snapshots: Displays all snapshots from all systems in the inventory and snapshot statistics in a graphical format.
•Snapshot Scheduled Pools: Displays all the pools that include a Snapshot schedule for all the systems in the inventory.
•Consistency Groups: Displays all consistency groups in all systems in the inventory.
•Snapshot Groups: Displays a grouping of snapshots of individual volumes in a consistency group at a specific point in time.
To add and remove columns from the table view, click the table view column tiles.
1.1.5 Hosts & Clusters Views
Choosing any of the physical host or cluster filters displays the associated data in the table view:
•Mapped Volumes: Displays all volumes in all systems in the inventory and associated volume statistics in a graphical format.
•Mapped Snapshots: Displays all mapped snapshots in all systems in the inventory and associated volume statistics in a graphical format.
•Hosts: Displays all physical hosts and clusters in the inventory and associated physical host statistics in a graphical format.
•Clusters: Displays all clusters in the inventory and associated cluster statistics in a graphical format.
•Host Connectivity: Displays all physical hosts and their connection type in the inventory and physical host statistics in a graphical format.
•Quality of Service (QoS): Displays all QoS information in the inventory.
To add and remove columns from the table view, click the table view column tiles.
1.1.6 Remote Views
Choosing any of the remote filters displays the associated data in the table view:
•Mirrored/HyperSwap Volumes (Availability): Displays all mirrored volumes in the inventory and their associated volume statistics in a graphical format.
•Mirrored/HyperSwap CGs (Availability): Displays all mirrored consistency groups in all the systems in the inventory.
•Online Volume Mobility: Displays all online volume mobility (OLVM) volumes in the inventory and their associated OLVM statistics in a graphical format.
•Migrating Volumes: Displays the volumes that are currently in a migration process.
•Mirroring / Online Mobility Connectivity: Displays connectivity information for the selected system.
•Migration Connectivity: Displays target parameters for the selected system.
To add and remove columns from the table view, click the table view column tiles.
1.1.7 Access Views
Choosing the access filter displays associated data in the table view:
•Users: Displays all users with access to systems in the inventory. The amount of system access is determined by the user category that is assigned to each user by the storage administrator.
•User Groups: Displays a group of application administrators who share a set of snapshot creation permissions.
1.1.8 Management Server
To access the Management Server menu, the storage administrator must be logged in as advanced mode if the server configuration has been restricted. This menu includes the following options:
•Manager Configuration: Click Manager Configuration to access the Inventory (Home) window where the storage administrator can enter the Hyper-Scale Manager Access Code, System Machine Account, and Notifications configuration to a specific system in the inventory.
•Add System to Monitor: Click Add System to Monitor to add a system to the inventory.
•Security (recommended): Click Security (recommended) to modify restricted access, password, and Auto Logout Time.
1.2 Installing and configuring Hyper-Scale Manager
To launch the web browser-based Storage Management GUI, the Hyper-Scale Manager server must be installed and configured.
1.2.1 Installing Hyper-Scale Manager
This procedure describes how to install the Hyper-Scale Manager application.
Before you begin
Download the installation file from Fix Central:
The name of the installation file is IBM-Hyper-Scale-Manager_x.x.x-x.bin.
|
Important: Keep up with the latest version to support new functions in the FlashSystem A9000 and A9000R as well as the latest updates in the Hyper-Scale Manager.
|
Prerequisites
The following list shows the installation prerequisites:
•The installation takes place on a 64-bit Red Hat Enterprise Linux (RHEL) 6.x or later 64-bit operating system or CentOS 6.8 or later.
•The server requires the following components and memory:
– At least two CPU cores and 4 GB of RAM
– At least 1 GB of disk space in the /tmp directory
– 76 GB free space under the installation path (The path is configurable, and it does not have to be the home directory.)
|
Important: To determine the right about of CPU and RAM specifications for your environment, refer to the release notes included with the Hyper-Scale Manager on Fix Central.
|
Determining that the requirements are met
To determine the amount of available disk space, enter the following command:
$ df -h %DIRECTORY%
If less than 1 GB of disk space and less than 76 GB of free disk space are available in the /tmp installation directory, follow these steps:
1. Delete unnecessary files from the /tmp/ installation directory to meet the disk space requirement.
2. Extend the file system that contains the /tmp/ installation directory. If necessary, contact the system administrator for information about extending file systems.
|
Important:
Note the following advice:
•The installation must be performed by the root user or a user with root privileges (sudo).
•For the best performance, install Hyper-Scale Manager on a dedicated, independent server.
•The Hyper-Scale Manager can be installed on a physical or virtual server.
|
Installation
Complete the following steps to install Hyper-Scale Manager:
1. Transfer (usually File Transfer Protocol (FTP) or Secure Copy Protocol (SCP) works) the downloaded installation package file into your RHEL or CentOS server by using the root user name.
2. Log in to your RHEL or CentOS server and change to the directory that contains the installation package file. Run the following command (Example 1-1) to verify that run permissions are set on the installation package file.
Example 1-1 Command for setting run permissions
$ chmod +x IBM-Hyper-Scale-Manager_5.3.bin
3. Run the command that is shown in Example 1-2 to start the installation.
Example 1-2 Command to start the installation
# ./IBM-Hyper-Scale-Manager_5.3.bin
4. Accept the installation location or select another location and press Enter. Enter y to approve the installation, as shown in Example 1-3, or n to cancel the installation.
Example 1-3 Approving the installation
IBM Hyper-Scale Manager is going to be installed under a designated user ‘msms’.
Press ‘Enter’ to accept the installation location [/home/msms] or a different path to override >
Press any key to continue the installation
IBM Hyper-Scale Manager will be installed under /home/msms/hyperscale.
Please approve to continue with the installation [y/n] >y
5. Accept the license agreement.
6. When the installation is complete, verify that all of the required ports are opened on the operating system (OS) firewall:
– Outbound only: Simple Mail Transfer Protocol (SMTP): Port 25
– XIV Gen3, FlashSystem A9000 and A9000R, and Spectrum Accelerate software communication: Port 7778
– Web GUI: Port 8443 (HTTPS) or 8080 (HTTP)
Upgrading
It is possible to upgrade Hyper-Scale Manager with similar process as install.
•Transfer (usually FTP or SCP works) the downloaded installation package file into your Red Hat Enterprise Linux (RHEL) management server by using the root user name.
•Log in to your management server with the root user and make the file executable with the command chmod +x IBM-Hyper-Scale-Manager_5.x.bin, as shown in Example 1-1.
•Run the ./IBM-Hyper-Scale-Manager_5.x.bin command that is shown in Example 1-2 to start the installation. If an older version of the GUI exists on the server, a menu shows three options, as shown in Example 1-4 on page 24:
– Upgrade
– Uninstall
– Exit
Example 1-4 Menu with upgrade option
----------------------------------------------------------------------------
------ IBM Hyper-Scale Manager 5.x -------
----------------------------------------------------------------------------
IBM Hyper-Scale Manager version 5.x is already installed on this server.
Please select one of the following:
1) Upgrade
2) Uninstall
3) Exit
Please enter your choice > 1
IBM Hyper-Scale Manager will be upgraded from version 5.x to 5.y.
Are you sure you want to upgrade now? [y/n]
|
Note 1: The upgrade option only works from 5.0.x to 5.1.x or higher. You cannot upgrade from earlier versions of Hyper-Scale Manager. What you can do is to transfer your already configured systems from the old Hyper-Scale Manager to the new installation.
However, be aware that the transfer will not merge with the existing configuration, it will replace it.
To do the systems configuration transfer from pre 5.x Hyper-Scale Manager, complete the following steps:
1. Copy the systems.xml file from <$MSMS_HOME>/server/data to the same path in the 5.x server installation.
2. Restart 5.x HSM service with service xivms stop and service xivms start.
Note 2: The systems.xml file is editable in a text editing tool, so if you want to merge, it is possible to copy and paste two files together. But no automatic process has been created.
|
1.2.2 Launching the GUI
To connect and log in to the GUI, complete the following steps:
1. Open one of the following internet browsers:
– Google Chrome version 49 or later
– Mozilla Firefox version 45 or later
2. Connect with one of the following URLs:
– http://<hostname>:8080
– https://<hostname>:8443
– http://<IP address>:8080
– https://<IP address>:8443
3. The Hyper-Scale Manager Login window opens. Enter your credentials and click Login to enter the Management GUI.
1.2.3 Using the installation wizard
When you start IBM Storage Manager for the first time, an installation wizard welcome window opens. The wizard is used to apply the initial system configuration. Follow these steps:

Figure 1-30 Installation wizard welcome window
|
Note: These screen shots were taken with a Hyper-Scale Manager version prior to V5.3. If installing V5.3 or later, the dialog boxes appear slightly different, but the main steps are the same.
|
2. Add your first system by entering at least one Internet Protocol (IP)/Domain Name System (DNS) address to add that system to your inventory. Click Continue to proceed to the next window. See Figure 1-31.

Figure 1-31 Installation wizard window for adding a system
3. Enter the default user credentials and click Continue to begin your setup. The default admin user name comes with the storage administrator role. See Figure 1-32.

Figure 1-32 Installation wizard login window
|
Tip: The default user name and password with storage administrator access are shown:
•User name: admin
•Password: adminadmin
|
4. Any administrative action on IBM Hyper-Scale Manager that is performed from the GUI requires the Hyper-Scale Manager access code. See Figure 1-33.

Figure 1-33 Installation wizard window to define the Hyper-Scale Manager access code
This account information is used by Hyper-Scale Manager to connect to IBM XIV Gen3, IBM FlashSystem A9000 and A9000R, and IBM Spectrum Accelerate software systems:
– This user must be defined.
– This user does not change the configuration.
– This user’s name default is manager_server_user, and it can be edited.
– This user can be defined in Lightweight Directory Access Protocol (LDAP). (Ensure that this user is added to all IBM XIV Gen3, IBM FlashSystem A9000 and A9000R, and IBM Spectrum Accelerate software systems storage admin groups in the LDAP).
– This user must have a storage administrator role (similar to the admin user).
– This user must be defined with the same password on all IBM XIV Gen3, IBM FlashSystem A9000 and A9000R, and IBM Spectrum Accelerate software systems in the Hyper-Scale Manager inventory.
Define a System Machine Account and password to connect to and monitor your system inventory from Hyper-Scale Manager. Click Continue to complete the initial setup. See Figure 1-34.
|
Tip: The default System Machine Account name is manager_server_user. The storage administrator defines the password.
|

Figure 1-34 Installation complete wizard window
1.2.4 Log in to IBM Hyper-Scale Manager after the initial setup
Enter the URL for the IBM Hyper-Scale Manager server in one of the supported web browsers:
http://<Hyper-Scale Manager server IP address>:8080
Alternatively, enter the following URL for secure connectivity:
https://<Hyper-Scale Manager server IP address>:8443
The login window is displayed, as shown in Figure 1-35. Enter your assigned user name and password, then click Login.
The default user name is admin. The default password is adminadmin. The user with these credentials can log on in advanced mode and further configure Hyper-Scale Manager as explained in 1.2.5, “Adding a system after the initial setup” on page 30 and 1.2.6, “Removing a system or modifying a system IP address” on page 31. The administrator should also change the default password.

Figure 1-35 IBM Hyper-Scale Manager login window
It is possible to restrict advanced access. When advanced access is restricted, you must specifically log on in advanced mode to further configure the Hyper-Scale Manager settings. Figure 1-36 shows the Advanced Mode login window.

Figure 1-36 Advanced mode login window
1.2.5 Adding a system after the initial setup
If you are logged in, you can add a system to your inventory after the initial setup by completing the following steps:
1. Log in to the Hyper-Scale Manager.

Figure 1-37 Adding a system to the inventory
3. Enter an IP or DNS address for the system that you are adding.
4. Click System Machine Account on the Hub to add or change the system machine account information.
5. Click Notifications on the Hub to enable and add users to receive notifications from the system that is added.
6. Click Apply to save the information that was entered. Click Cancel to not save the information that was entered.
1.2.6 Removing a system or modifying a system IP address
When the storage administrator is logged on in advanced mode, the storage administrator can remove a system from the inventory or change the IP address of a system in the inventory. To remove a system from your inventory or to change the IP address of a system in your inventory, complete the following steps:
1. Log in to the Hyper-Scale Manager.
2. In the menu on the left, select Hyper-Scale Manager and then click Manager Configuration.
3. Click the small blue menu icon in the upper-right corner of the section that contains the system to remove. See Figure 1-38.

Figure 1-38 Removing a system from inventory or modifying the IP address of a system in inventory
4. Click Remove to delete the system from the inventory. Click Modify IP to change the
IP address of a system.
IP address of a system.
5. Click Apply to save the changes. Click Cancel to leave the information unchanged.
..................Content has been hidden....................
You can't read the all page of ebook, please click here login for view all page.