


Troubleshooting and diagnostics
This chapter provides information about troubleshooting common problems that can occur in IBM Spectrum Virtualize environment. It describes situations that are related to IBM SAN Volume Controller, the SAN environment, optional external storage subsystems, and hosts. It also explains how to collect the necessary problem determination data.
This chapter includes the following topics:
11.1 Starting troubleshooting
Troubleshooting is a systematic approach to solving a problem. The goal of troubleshooting or problem determination is to understand why something does not work as expected and find a resolution. Therefore, the first step is to describe the problem as accurately as possible, then perform log collection from all the involved products of the solution as soon as the problem is reported. Ideally, an effective problem report describes the expected behavior, the actual behavior, and, if possible, how to reproduce the behavior.
The following questions help define the problem for effective troubleshooting:
•What are the symptoms of the problem?
– What is reporting the problem?
– What are the error codes and messages?
– What is the business impact of the problem?
– Where does the problem occur?
– Is the problem specific to one or multiple hosts, one or both nodes?
– Is the current environment and configuration supported?
•When does the problem occur?
– Does the problem occur only at a specific time of day or night?
– How often does the problem occur?
– What sequence of events leads up to the time that the problem is reported?
– Does the problem occur after an environment change, such as upgrading or installing software or hardware?
•Under which conditions does the problem occur?
– Does the problem always occur when the same task is being performed?
– Does a certain sequence of events need to occur for the problem to surface?
– Do any other applications fail at the same time?
•Can the problem be reproduced?
– Can the problem be re-created on a test system?
– Are multiple users or applications encountering the same type of problem?
– Can the problem be re-created by running a single command, a set of commands, a specific application, or a stand-alone application?
Log file collection that is done close to the time of the incident and an accurate timeline are critical for effective troubleshooting.
11.1.1 Using the GUI
The graphical user interface (GUI) is a good starting point for your troubleshooting. It features two icons at the top that can be accessed from any window of the GUI.
As shown in Figure 11-1 on page 497, the first icon shows IBM Spectrum Virtualize events, such as an error or a warning. The second icon shows suggested tasks and background tasks that are running, or that were recently completed.
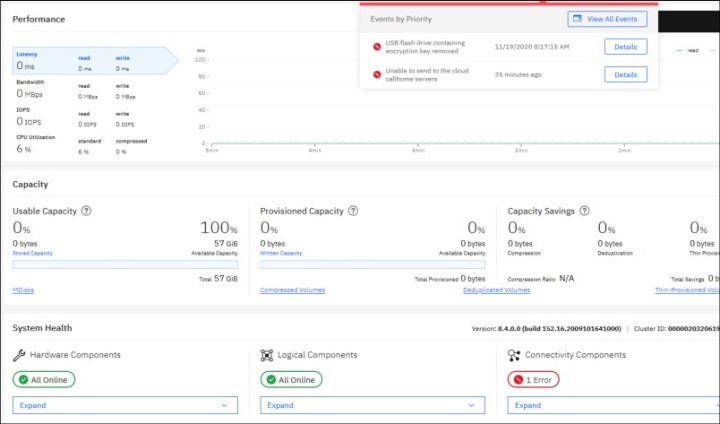
Figure 11-1 Events and tasks icons in GUI
The Dashboard window (see Figure 11-2) provides an at-a-glance look into the condition of the system and notification of any critical issues that require immediate action. It contains sections for performance, capacity, and system health that provide an overall understanding of what is happening on the system.

Figure 11-2 Dashboard
The System Health section in the bottom part of the Dashboard provides information about the health status of hardware, and logical and connectivity components. If you click Expand in each of these categories, the status of individual components is shown, as shown in the example in Figure 11-3. You can also click More Details, which takes you to the window that is related to that specific component, or is shows you more information about it.

Figure 11-3 System Health section in Dashboard
For more information about the entire list of components in each category, see this IBM Documentation web page.
11.1.2 Recommended actions and fix procedure
The fix procedures were carefully designed to assist users to fix the problem without causing more issues. When multiple unfixed error codes are in the Event log, the management GUI provides a way to run the next recommended fix procedure. Therefore, the first step in troubleshooting is to run the fix procedures on the error codes in the Event log.
These messages and codes provide reference information about informational configuration events and error event codes when a service action is required. Cluster Error Code (CEC) is visible in the cluster event log; Node Error Code (NEC) is visible in node status in the service assistant GUI. A cluster can encounter the following types of failure recoveries because of various conditions:
•Node assert (warmstart or Tier1/T1 recovery) is reported as CEC 2030
•Cluster recovery(Tier2/T2 recovery) is reported as CEC 1001
•System recovery(Tier3/T3 recovery) is required when all nodes of the clustered system report NEC 550/578
•System restore (Tier4/T4 recovery) is to restore the cluster to a point where it can be used to restore from an off-cluster backup (to be used by IBM Support only).
For more information about the available messages and codes, see this IBM Documentation web page.
The Monitoring → Events window shows information messages, warnings, and issues on the IBM Spectrum Virtualize. So, this is a good place to check the current problems in the system.
Using the Recommended Actions filter, the most important events that need to be fixed are displayed.
If there is an important issue that needs to be fixed, the Run Fix button is available in the upper-left corner with an error message, indicating which event must be fixed as soon as possible. This fix procedure assists you to resolve problems in IBM Spectrum Virtualize. It analyzes the system, provides more information about the problem, suggest actions to be taken with steps to be followed, and finally checks to see whether the problem is resolved.
So, if any error is reported by the system, such as system configuration problems and hardware failures, always use the fix procedures to resolve it.
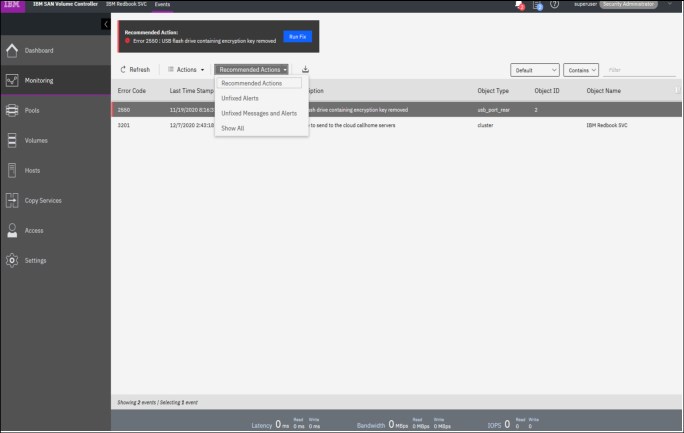
Figure 11-4 Monitoring > Events window
|
Resolve alerts in a timely manner: When an issue or a potential issue is reported, resolve it as quickly as possible to minimize its effect and potentially avoid more serious problems with your system.
|
For more information about any event, select an event in the table, and click Properties in the Actions menu. You can also access the Run Fix Procedure and properties by right-clicking an event.
In the Properties and Sense Data window for the specific event (see Figure 11-5 on page 500), more information about the event is displayed. You can review and also click Run Fix to run the fix procedure.

Figure 11-5 Properties and sense data for event window
|
Tip: From the Properties and Sense Data for Event Window, you can use the Previous and Next buttons to move between events.
|
Another common practice is to use the IBM Spectrum Virtualize CLI to find issues and resolve them. You can use the IBM Spectrum Virtualize CLI to perform common error recovery steps. Although the maintenance procedures perform these steps, it is sometimes faster to run these commands directly through the CLI.
Run these commands whenever you encounter the following issues:
•You experience a back-end storage issue (for example, error code 1370 or error code 1630).
•You performed maintenance on the back-end storage subsystems.
|
Important: Run the following commands when back-end storage is configured, a zoning change occurs, or any other type of changes that are related to the communication between IBM Spectrum Virtualize and back-end storage subsystem occurs. This process ensures that IBM Spectrum Virtualize recognized the changes.
|
Common error recovery involves the following IBM Spectrum Virtualize CLI commands:
•lscontroller and lsmdisk
Provides current status of all controllers and MDisks.
•detectmdisk
Discovers the changes in the backend.
•lscontroller <controller_id_or_name>
Checks the controller that was causing the issue and verifies that all the WWPNs are listed as you expect. It also checks that the path_counts are distributed evenly across the WWPNs.
•lsmdisk
Determines whether all MDisks are online.
|
Note: When an issue is resolved by using the CLI, check if the error was removed from the Monitoring → Events window. If not, ensure that the error was fixed, and if so, manually mark the error as fixed.
|
11.2 Diagnostic data collection
Data collection and problem isolation in an IT environment are sometimes difficult tasks. In the following section, the essential steps that are needed to collect debug data to find and isolate problems in an IBM Spectrum Virtualize environment are described.
11.2.1 Collecting data from IBM Spectrum Virtualize
When a problem exists with an IBM SAN Volume Controller and you must open a case with IBM support, you must provide the support packages for the device. To automatically collect and upload the support packages to IBM Support center, use IBM Spectrum Virtualize.
You also can download the package from the device and manually upload to IBM. The easiest way is to automatically upload the support packages from IBM Spectrum Virtualize by using the GUI or CLI.
Data collection by using the GUI
To collect data by using the GUI, complete the following steps:
1. Click Settings → Support → Support Package. Both options to collect and upload support packages are available.
2. To automatically upload the support packages, click Upload Support Package.
3. In the pop-up window, enter the IBM Salesforce case number (TS00xxxxx) and the type of support package to upload to the IBM Support center. The Snap Type 4 option can be used to collect standard logs and generate a new statesave on each node of the system.
The Upload Support Package window is shown in Figure 11-6.
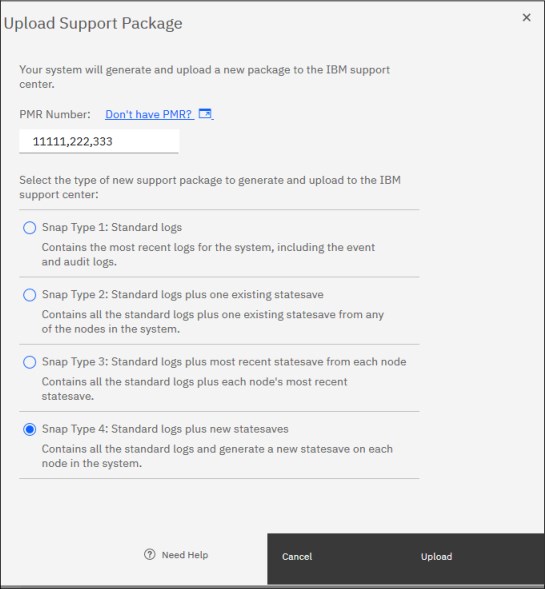
Figure 11-6 Upload Support Package window
For more information about the required support package that is most suitable to diagnose different type of issues, see this IBM Support web page.
Consider the following points:
•For issues that are related to interoperability with hosts or storage, use Snap Type 4.
•For critical performance issues, collect Snap Type 1 and then, collect Snap Type 4.
•For general performance issues, collect Snap Type 4.
•For issues related to replication, including 1920 errors, collect Snap Type 4 from both systems.
•For issues related to compressed volumes, collect Snap Type 4.
•For 2030, 1196 or 1195 errors collect Snap Type 4.
•For all other issues, collect Snap Type 4.
Data collection by using the CLI
To collect the same type of support packages by using the CLI, you must first generate a new livedump of the system by using the svc_livedump command, and then upload the log files and new generated dumps by using the svc_snap command, as shown in Example 11-1. To verify whether the support package was successfully uploaded, use the sainfo lscmdstatus command (TS00xxxxx is the IBM Salesforce Ticket ID).
Example 11-1 The svc_livedump command
IBM_2145:ITSO_DH8_B:superuser>svc_livedump -nodes all -yes
Livedump - Fetching Node Configuration
Livedump - Checking for dependent vdisks
Livedump - Check Node status
Livedump - Prepare specified nodes - this may take some time...
Livedump - Prepare node 1
Livedump - Prepare node 2
Livedump - Trigger specified nodes
Livedump - Triggering livedump on node 1
Livedump - Triggering livedump on node 2
Livedump - Waiting for livedumps to complete dumping on nodes 1,2
Livedump - Waiting for livedumps to complete dumping on nodes 2
Livedump - Successfully captured livedumps on nodes 1,2
IBM_2145:ITSO_DH8_B:superuser>svc_snap upload pmr=TS00XXXXX gui3
Collecting data
Packaging files
Snap data collected in /dumps/snap.ABCDEFG.171128.223133.tgz
IBM_2145:ITSO_DH8_B:superuser>sainfo lscmdstatus
last_command satask supportupload -pmr TS00XXXXX-filename /dumps/snap.ABCDEFG.171128.223133.tgz
last_command_status CMMVC8044E Command completed successfully.
T3_status
T3_status_data
cpfiles_status Complete
cpfiles_status_data Copied 1 of 1
snap_status Complete
snap_filename /dumps/snap.ABCDEFG.171128.223133.tgz
installcanistersoftware_status
supportupload_status Complete
supportupload_status_data [PMR=TS00XXXXX] Upload complete
supportupload_progress_percent 0
supportupload_throughput_KBps 0
supportupload_filename /dumps/snap.ABCDEFG.171128.223133.tgz
downloadsoftware_status
downloadsoftware_status_data
downloadsoftware_progress_percent 0
downloadsoftware_throughput_KBps 0
downloadsoftware_size
IBM_2145:ITSO_DH8_B:superuser>
11.2.2 More data collection
Data collection methods vary by storage platform, SAN switch, and operating system.
When an issue exists in a SAN environment and it is not clear where the problem is occurring, you might need to collect data from several devices in the SAN.
The following basic information must be collected for each type of device:
•Hosts:
– Operating system: Version and level
– HBA: Driver and firmware level
– Multipathing driver level
•SAN switches:
– Hardware model
– Software version
•Storage subsystems:
– Hardware model
– Software version
11.3 Common problems and isolation techniques
SANs, storage subsystems, and host systems can be complicated. They often consist of hundreds or thousands of disks, multiple redundant subsystem controllers, virtualization engines, and different types of SAN switches. All of these components must be configured, monitored, and managed correctly. If issues occur, administrators must know what to look for and where to look.
IBM Spectrum Virtualize features useful error logging mechanisms. It keeps track of its internal events and informs the user about issues in the SAN or storage subsystem. It also helps to isolate problems with the attached host systems. By using these functions, administrators can easily locate any issue areas and take the necessary steps to fix any events.
In many cases, IBM Spectrum Virtualize and its service and maintenance features guide administrators directly, provide help, and suggest remedial action. Furthermore, IBM Spectrum Virtualize determines whether the problem still persists.
Another feature that helps administrators to isolate and identify issues that might be related to IBM Spectrum Virtualize is the ability of their nodes to maintain a database of other devices that communicate with the IBM Spectrum Virtualize device. Devices, such as hosts and back-end storages, are added or removed from the database as they start or stop communicating to IBM Spectrum Virtualize.
Although IBM Spectrum Virtualize node hardware and software events can be verified in the GUI or CLI, external events, such as failures in the SAN zoning configuration, hosts, and back-end storages, are common. They also must have troubleshooting performed out of IBM Spectrum Virtualize. For example, a misconfiguration in the SAN zoning might lead to the IBM Spectrum Virtualize cluster not working properly.
This problem occurs because the IBM Spectrum Virtualize cluster nodes communicate with each other by using the Fibre Channel SAN fabrics.
In this case, check the following areas from an IBM Spectrum Virtualize perspective:
•The attached hosts. For more information, see 11.3.1, “Host problems” on page 505.
•The SAN. For more information, see 11.3.2, “SAN problems” on page 509.
•The attached storage subsystem. For more information, see 11.3.3, “Storage subsystem problems” on page 511.
•The local FC port masking. For more information, see 8.1.3, “Port masking” on page 354.
11.3.1 Host problems
From the host perspective, you can experience various situations that range from performance degradation to inaccessible disks. To diagnose any host-related issue, you can start checking the hosts configuration on IBM Spectrum Virtualize side. The Hosts window in the GUI or the following CLI commands are used to start a verification in any possible hosts-related issue:
•lshost
Checks the host’s status. If the status is online, the host ports are online in both nodes of an I/O group. If the status is offline, the host ports are offline in both nodes of an I/O group. If the status is inactive, it means that the host features volumes that are mapped to it, but all of its ports received no SCSI commands in the last 5 minutes. Also, if status is degraded, it means at least one (but not all) of the host ports is not online in at least one node of an I/O group. Example 11-2 shows the lshost command output.
Example 11-2 The lshost command
IBM_2145:ITSO_DH8_B:superuser>lshost
id name port_count iogrp_count status site_id site_name host_cluster_id host_cluster_name
0 Win2K8 2 4 degraded
1 ESX_62_B 2 4 online
2 ESX_62_A 2 1 offline
•lshost <host_id_or_name>
Shows more information about a specific host. It is often used when you must identify which host port is not online in IBM Spectrum Virtualize node.
Example 11-3 shows the lshost <host_id_or_name> command output.
Example 11-3 The lshost <host_id_or_name> command
IBM_2145:ITSO_DH8_B:superuser>lshost Win2K8
id 0
name Win2K8
port_count 2
type generic
mask 1111111111111111111111111111111111111111111111111111111111111111
iogrp_count 4
status degraded
site_id
site_name
host_cluster_id
host_cluster_name
WWPN 100000051E0F81CD
node_logged_in_count 2
state active
WWPN 100000051E0F81CC
node_logged_in_count 0
state offline
•lshostvdiskmap
Check that all volumes are mapped to the correct hosts. If a volume is not mapped correctly, create the necessary host mapping.
•lsfabric -host <host_id_or_name>
Use this command with parameter -host <host_id_or_name> to display Fibre Channel (FC) connectivity between nodes and hosts. Example 11-4 shows the lsfabric -host <host_id_or_name> command output.
Example 11-4 The lsfabric -host <host_id_or_name> command
IBM_2145:ITSO_DH8_B:superuser>lsfabric -host Win2K8
remote_wwpn remote_nportid id node_name local_wwpn local_port local_nportid state name cluster_name type
100000051E0F81CD 021800 1 node1 500507680C220416 2 020400 active Win2K8 host
100000051E0F81CD 021800 2 node2 500507680C22041D 2 020000 active Win2K8 host
To perform troubleshooting on the host side, check the following components:
•Any special software that you use.
•Any recent change in the operating system, such as patching the operating system and an upgrade.
•Operating system version and maintenance or service pack level
•Multipathing type and driver level
•Host bus adapter model, firmware, and driver level
•Host bus adapter connectivity issues
Based on this list, the host administrator must check and correct any problems.
Hosts with higher queue depth might overload shared storage ports. Therefore, it is recommended to verify that the sum total of the queue depth of all hosts sharing a single target Fibre Channel port is limited to 2048. If any of the hosts have a queue depth of more than 128, it must be reviewed because queue full conditions can lead to I/O errors and extended error recoveries.
For more information about managing hosts on IBM Spectrum Virtualize, see Chapter 8, “Configuring host systems” on page 353.
Apart from hardware-related situations, problems can exist in such areas as the operating system or the software that is used on the host. These problems normally are handled by the host administrator or the service provider of the host system. However, the multipathing driver that is installed on the host and its features can help to determine possible issues.
For example, for a volume path issue reported by SDD output on the host by using the datapath query adapter and datapath query device commands. The adapter in degraded state means that the specific HBA on the server side cannot reach all of the nodes in the I/O group to which the volumes are associated.
|
Note: Subsystem Device Driver Device Specific Module (SDDDSM) and Subsystem Device Driver Path Control Module (SDDPCM) reached End of Service (EOS). Therefore, migrate SDDDSM to MSDSM on Windows platform and SDDPCM to AIXPCM on AIX/VIOS platforms.
|
For more information, see the following IBM Support web pages:
Faulty paths can be caused by hardware and software problems, such as the following examples:
•Hardware:
– Faulty Small Form-factor Pluggable transceiver (SFP) on the host or SAN switch
– Faulty fiber optic cables
– Faulty HBAs
– Faulty physical SAN ports within a switch can lead to replacement of entire switch
– Contaminated SFPs/cable connectors
•Software:
– A back-level multipathing driver
– Obsolete HBA firmware or driver
– Wrong zoning
– Incorrect host-to-VDisk mapping
Based on field experience, it is recommended that you complete the following hardware checks first:
•Whether any connection error indicators are lit on the host or SAN switch.
•Whether all of the parts are seated correctly. For example, cables are securely plugged in to the SFPs and the SFPs are plugged all the way into the switch port sockets.
•Ensure that no fiber optic cables are broken. If possible, swap the cables with cables that are known to work.
After the hardware check, continue to check the following aspects of software setup:
•Check that the HBA driver level and firmware level are at the preferred and supported levels.
•Check the multipathing driver level, and make sure that it is at the preferred and supported level.
•Check for link layer errors that are reported by the host or the SAN switch, which can indicate a cabling or SFP failure.
•Verify your SAN zoning configuration.
•Check the general SAN switch status and health for all switches in the fabric.
iSCSI and iSER configuration and performance issues
In this section, we discuss the iSCSI and iSER configuration and performance issues.
Link issues
If the Ethernet port link does not come online, check whether the SFP or cables and check whether the port supports auto-negotiation with the switch. This check is especially true for SFPs that support 25 G and higher because a mismatch can exist in Forward Error Correction (FEC), which can prevent a port to auto-negotiate.
Longer cables are exposed to more noise and interference; that is, high Bit Error Ratio (BER); therefore, they require more powerful error correction codes.
Two IEEE 802.3 FEC specifications are available. If an auto-negotiation issue occurs, verify whether any compatibility issue exists with SFPs at both end points:
•Clause 74: Fire Code (FC-FEC) or BASE-R (BR-FEC) (16.4 dB loss specification).
•Clause 91: Reed-Solomon; that is, RS-FEC (22.4 dB loss specification).
Priority flow control
Priority flow control (PFC) is an Ethernet protocol that supports the ability to assign priorities to different types of traffic within the network. On most Data Center Bridging Capability Exchange protocol (DCBX) supported switches, verify that Link Layer Discovery Protocol (LLDP) is enabled. The presence of a VLAN is a prerequisite for configuring PFC. It is recommended to set the priority tag in the range 0 - 7.
A DCBX-enables switch and a storage adapter exchange parameters that describe traffic classes and PFC capabilities.
In the IBM FlashSystem, Ethernet traffic is divided into the following Classes of Service that are based on feature use case:
•Host attachment (iSCSI/iSER)
•Backend Storage (iSCSI)
•Node-to-node communication (RDMA clustering)
If challenges occur while configuring PFC, verify the following attributes to help determine the issue:
•Configure IP/VLAN by using cfgportip.
•Configure class of service (COS) by using chsytsemethernet.
•Ensure that the priority tag is enabled on the switch.
•Ensure that lsportip output shows: dcbx_state, pfc_enabled_tags.
Enhanced Transmission Selection (ETS) settings are recommended if a port is shared.
Standard network connectivity check
Verify that the required TCP/UDP ports are allowed in the network firewall. The following ports for various host attachments are available:
• Software iSCSI requires TCP Port 3260
• iSER/RoCE host requires 3260
• iSER/iWRAP host requires TCP Port 860
Verify that the IP addresses are reachable and the TCP ports are open.
iSCSI performance issues
In specific situations, the TCP/IP layer might try to combine several ACK responses together into a single response to improve performance, but that process can negatively affect iSCSI read performance as the storage target waits for the response to arrive. This issue is observed when the application is single-threaded and features a low queue depth.
It is recommended to disable the TCPDelayedAck parameter on the host platforms to improve overall storage I/O performance. If the host platform does not provide a mechanism to disable TCPDelayedAck, verify whether a smaller “Max I/O Transfer Size” with more concurrency (queue depth >16) improves overall latency and bandwidth usage for the specific host workload. In most Linux distributions, this size is controlled by the max_sectors_kb parameter with a suggested transfer size of 32 KB.
Also, review network switch diagnostic data to evaluate packet drop and retransmission in the network. It is advisable to enable flow control and PFC to enhance the reliability of the network delivery system to avoid packet loss, which enhances storage performance.
11.3.2 SAN problems
Introducing IBM Spectrum Virtualize into your SAN environment and the use of its virtualization functions are not difficult tasks. However, before you can use IBM Spectrum Virtualize in your environment, you must follow some basic rules. These rules are not complicated, but you can make mistakes that lead to accessibility issues or a reduction in the performance experienced.
Two types of SAN zones are needed to run IBM Spectrum Virtualize in your environment: a host zone and a storage zone. In addition, you must have an IBM Spectrum Virtualize zone that contains all of the IBM Spectrum Virtualize node ports of the IBM Spectrum Virtualize cluster. This IBM Spectrum Virtualize zone enables intracluster communication.
For more information about setting up IBM Spectrum Virtualize in a SAN fabric environment, see Chapter 2, “Storage area network guidelines” on page 21.
Because IBM Spectrum Virtualize is a major component of the SAN and connects the host to the storage subsystem, check and monitor the SAN fabrics.
Some situations of performance degradation and buffer-to-buffer credit exhaustion can be caused by incorrect local FC port masking and remote FC port masking. To ensure healthy operation of your IBM SAN Volume Controller, configure your local FC port masking and your remote FC port masking.
The ports that are intended to have only intracluster or node-to-node communication traffic must not have replication data or host or backend data running on it. The ports that are intended to have only replication traffic must not have intracluster or node-to-node communication data or host or backend data running on it.
Some situations can cause issues in the SAN fabric and SAN switches. Problems can be related to a hardware fault or to a software problem on the switch.
Some situations can cause issues in the SAN fabric and SAN switches. Problems can be related to a hardware fault or to a software problem on the switch.
The following hardware defects often are the easiest problems to find:
•Switch power, fan, or cooling units
•Installed SFP modules
•Fiber optic cables
Software failures are more difficult to analyze. In most cases, you must collect data and involve IBM Support. However, before you take any other steps, check the installed code level for any known issues. Also, check whether a new code level is available that resolves the problem that you are experiencing.
The most common SAN issues often are related to zoning. For example, perhaps you chose the wrong WWPN for a host zone, such as when two IBM SAN Volume Controller node ports must be zoned to one HBA with one port from each IBM SAN Volume Controller node. As shown in Example 11-5, two ports are zoned that belong to the same node. Therefore, the result is that the host and its multipathing driver do not see all of the necessary paths.
Example 11-5 Incorrect WWPN zoning
zone: Senegal_Win2k3_itsosvccl1_iogrp0_Zone
50:05:07:68:10:20:37:dc
50:05:07:68:10:40:37:dc
20:00:00:e0:8b:89:cc:c2
The correct zoning must look like the zoning that is shown in Example 11-6.
Example 11-6 Correct WWPN zoning
zone: Senegal_Win2k3_itsosvccl1_iogrp0_Zone
50:05:07:68:10:40:37:e5
50:05:07:68:10:40:37:dc
20:00:00:e0:8b:89:cc:c2
The following IBM FlashSystem error codes are related to the SAN environment:
•Error 1060 - Fibre Channel ports are not operational
•Error 1220 - A remote port is excluded
A bottleneck is another common issue related to SAN switches. The bottleneck can be present in a port where a host, storage subsystem, or IBM Spectrum Virtualize device is connected, or in Inter-Switch Link (ISL) ports. The bottleneck can occur in some cases, such as when a device that is connected to the fabric is slow to process received frames or if a SAN switch port cannot transmit frames at a rate that is required by a device that is connected to the fabric.
These cases can slow down communication between devices in your SAN. To resolve this type of issue, refer to the SAN switch documentation or open a case with the vendor to investigate and identify what is causing the bottleneck and fix it.
If you cannot fix the issue with these actions, use the method that is described in 11.5, “Call Home Connect Cloud and Health Checker feature” on page 522, collect the SAN switch debugging data, and then, contact the vendor for assistance.
11.3.3 Storage subsystem problems
Today, various heterogeneous storage subsystems are available. These subsystems feature different management tools, setup strategies, and possible problem areas, depending on the manufacturer. To support a stable environment, all subsystems must be correctly configured, and follow the respective preferred practices with no existing issues.
Check the following areas if you experience a storage-subsystem-related issue:
•Storage subsystem configuration. Ensure that a valid configuration and preferred practices are applied to the subsystem.
•Storage subsystem controllers. Check the health and configurable settings on the controllers.
•Storage subsystem array. Check the state of the hardware, such as a disk drive module (DDM) failure or enclosure alerts.
•Storage volumes. Ensure that the logical unit number (LUN) masking is correct.
•Host attachment ports. Check the status, configuration, and connectivity to SAN switches.
•Layout and size of RAID arrays and LUNs. Performance and redundancy are contributing factors.
IBM Spectrum Virtualize has several CLI commands that you can use to check the status of the system and attached storage subsystem. Before you start a complete data collection or problem isolation on the SAN or subsystem level, use the following commands first and check the status from the IBM Spectrum Virtualize perspective:
•lscontroller <controller_id_or_name>
Check that multiple worldwide port names (WWPNs) that match the back-end storage subsystem controller ports are available.
Check that the path_counts are evenly distributed across each storage subsystem controller, or that they are distributed correctly based on the preferred controller. The total of all path_counts must add up to the number of managed disks (MDisks) multiplied by the number of IBM Spectrum Virtualize nodes.
•lsmdisk
Check that all MDisks are online (not degraded or offline).
•lsmdisk <MDisk_id_or_name>
Check several of the MDisks from each storage subsystem controller. Are they online? Do they all have path_count = number of backend ports in the zone to IBM Spectrum Virtualize x number of nodes? An example of the output from this command is shown in Example 11-7.
Example 11-7 Issuing an lsmdisk command
IBM_2145:itsosvccl1:superuser>lsmdisk 0
id 0
name MDisk0
status online
mode array
MDisk_grp_id 0
MDisk_grp_name Pool0
capacity 198.2TB
quorum_index
block_size
controller_name
ctrl_type
ctrl_WWNN
controller_id
path_count
max_path_count
ctrl_LUN_#
UID
preferred_WWPN
active_WWPN
fast_write_state empty
raid_status online
raid_level raid6
redundancy 2
strip_size 256
spare_goal
spare_protection_min
balanced exact
tier tier0_flash
slow_write_priority latency
fabric_type
site_id
site_name
easy_tier_load
encrypt no
distributed yes
drive_class_id 0
drive_count 8
stripe_width 7
rebuild_areas_total 1
rebuild_areas_available 1
rebuild_areas_goal 1
dedupe no
preferred_iscsi_port_id
active_iscsi_port_id
replacement_date
over_provisioned yes
supports_unmap yes
provisioning_group_id 0
physical_capacity 85.87TB
physical_free_capacity 78.72TB
write_protected no
allocated_capacity 155.06TB
effective_used_capacity 16.58TB.
IBM_2145:itsosvccl1:superuser>lsmdisk 1
id 1
name flash9h01_itsosvccl1_0
status online
mode managed
mdisk_grp_id 0
mdisk_grp_name Pool0
capacity 1.6TB
quorum_index
block_size 512
controller_name itsoflash9h01
ctrl_type 4
ctrl_WWNN 500507605E852080
controller_id 1
path_count 32
max_path_count 32
ctrl_LUN_# 0000000000000000
UID 6005076441b53004400000000000000100000000000000000000000000000000
preferred_WWPN
active_WWPN many
.
lines removed for brevity
.
IBM_2145:itsosvccl1:superuser>
Example 11-7 on page 511 also shows that the external storage controller includes eight ports that are zoned to IBM Spectrum Virtualize, and IBM Spectrum Virtualize has four nodes. Therefore, 8 x 4 = 32.
•lsvdisk
Check that all volumes are online (not degraded or offline). If the volumes are degraded, are any stopped FlashCopy jobs present? Restart any stopped FlashCopy jobs or seek IBM Spectrum Virtualize support guidance.
•lsfabric
Use this command with the various options, such as -controller controllerid. Also, check different parts of the IBM Spectrum Virtualize configuration to ensure that multiple paths are available from each IBM Spectrum Virtualize node port to an attached host or controller. Confirm that all IBM Spectrum Virtualize node port WWPNs are connected to the back-end storage consistently.
Determining the correct number of paths to a storage subsystem
By using IBM Spectrum Virtualize CLI commands, it is possible to determine the total number of paths to a storage subsystem. To determine the suitable value of the available paths, use the following formula:
Number of MDisks x Number of SVC nodes per Cluster = Number of paths
mdisk_link_count x Number of SVC nodes per Cluster = Sum of path_count
Example 11-8 shows how to obtain this information by using the lscontroller <controllerid> and svcinfo lsnode commands.
Example 11-8 Output of the svcinfo lscontroller command
IBM_2145:itsosvccl1:superuser>lscontroller 1
id 1
controller_name itsof9h01
WWNN 500507605E852080
mdisk_link_count 16
max_mdisk_link_count 16
degraded no
vendor_id IBM
product_id_low FlashSys
product_id_high tem-9840
product_revision 1430
ctrl_s/n 01106d4c0110-0000-0
allow_quorum yes
fabric_type fc
site_id
site_name
WWPN 500507605E8520B1
path_count 64
max_path_count 64
WWPN 500507605E8520A1
path_count 64
max_path_count 64
WWPN 500507605E852081
path_count 64
max_path_count 64
WWPN 500507605E852091
path_count 64
max_path_count 64
WWPN 500507605E8520B2
path_count 64
max_path_count 64
WWPN 500507605E8520A2
path_count 64
max_path_count 64
WWPN 500507605E852082
path_count 64
max_path_count 64
WWPN 500507605E852092
path_count 64
max_path_count 64
IBM_2145:itsosvccl1:superuser>svcinfo lsnode
id name UPS_serial_number WWNN status IO_group_id IO_group_name config_node UPS_unique_id hardware iscsi_name iscsi_alias panel_name enclosure_id canister_id enclosure_serial_number site_id site_name
1 node1 500507680C003AE1 online 0 io_grp0 yes DH8 iqn.1986-03.com.ibm:2145.itsosvccl1.node1 78CBFEA0
2 node2 500507680C003ACA online 0 io_grp0 no DH8 iqn.1986-03.com.ibm:2145.itsosvccl1.node2 78CBRB0
3 node3 500507680C003A9F online 1 io_grp1 no DH8 iqn.1986-03.com.ibm:2145.itsosvccl1.node3 78CBLP0
4 node4 500507680C003DB6 online 1 io_grp1 no DH8 iqn.1986-03.com.ibm:2145.itsosvccl1.node4 78CCAQ0
IBM_2145:itsosvccl1:superuser>
Example 11-8 on page 513 also shows that 16 MDisks are present for the storage subsystem controller with ID 1, and four IBM Spectrum Virtualize nodes are in the IBM Spectrum Virtualize cluster. In this example, the path_count is 16 x 4 = 64.
IBM Spectrum Virtualize includes useful tools for finding and analyzing back-end storage subsystem issues because it has a monitoring and logging mechanism.
Typical events for storage subsystem controllers include incorrect configuration, which results in a 1625 - Incorrect disk controller configuration error code. Other issues that are related to the storage subsystem include failures pointing to the managed disk I/O (error code 1310), disk media (error code 1320), and error recovery procedure (error code 1370).
However, all messages do not have only one specific reason for being issued. Therefore, you must check multiple areas for issues, not just the storage subsystem.
To determine the root cause of a problem, complete the following steps:
1. Check the Recommended Actions window by clicking Monitoring → Events.
2. Check the attached storage subsystem for misconfigurations or failures:
a. Independent of the type of storage subsystem, first check whether the system has any unfixed errors. Use the service or maintenance features that are provided with the storage subsystem to fix these issues.
b. Check whether volume mapping is correct. The storage subsystem LUNs must be mapped to a host object with IBM SAN Volume Controller ports. Also, observe the IBM Spectrum Virtualize restrictions for back-end storage subsystems, which can be found at this IBM Support web page.
If you need to identify which of the attached MDisks has a corresponding LUN ID, run the IBM Spectrum Virtualize lsmdisk CLI command, as shown in Example 11-9. This command also shows to which storage subsystem a specific MDisk belongs (the controller ID).
Example 11-9 Determining the ID for the MDisk
IBM_2145:itsosvccl1:admin>lsmdisk
id name status mode mdisk_grp_id mdisk_grp_name capacity ctrl_LUN_# controller_name UID
0 mdisk0 online managed 0 MDG-1 600.0GB 0000000000000000 controller0 600a0b800017423300000059469cf84500000000000000000000000000000000
2 mdisk2 online managed 0 MDG-1 70.9GB 0000000000000002 controller0 600a0b800017443100000096469cf0e800000000000000000000000000000000
3. Check the SAN environment for switch problems or zoning failures.
Make sure that the zones are properly configured, and the zone set is activated. The zones that allow communication between the storage subsystem and the IBM Spectrum Virtualize device must contain WWPNs of the storage subsystem and WWPNs of IBM SAN Volume Controller or Storwize V7000.
4. Collect all support data and contact IBM Support.
Collect the support data for the involved SAN, IBM Spectrum Virtualize, or storage systems as described in 11.5, “Call Home Connect Cloud and Health Checker feature” on page 522.
11.3.4 Native IP replication problems
The native IP replication feature uses the following TCP/IP ports for remote cluster path discovery and data transfer:
•IP Partnership management IP communication: TCP Port 3260
•IP Partnership data path connections: TCP Port 3265
If a connectivity issue exists between the cluster in the management communication path, a cluster reports error code 2021: Partner cluster IP address unreachable. However, when a connectivity issue exists in the data path, the cluster reports error code 2020: IP Remote Copy link unavailable.
If the IP addresses are reachable and TCP ports are open, verify whether the end-to-end network supports a Maximum Transmission Unit (MTU) of 1500 bytes without packet fragmentation. When an external host-based ping utility is used to validate end-to-end MTU support, use the “do not fragment” qualifier.
Fix the network path so that traffic can flow correctly. After the connection is made, the error corrects automatically.
Network quality of service largely influences the effective bandwidth usage of the dedicated link between the cluster. Bandwidth usage is inversely proportional to round-trip time (RTT) and rate of packet drop or retransmission in the network.
For standard block traffic, a packet drop or retransmission of 0.5% or more can lead to unacceptable use of the available bandwidth. Work with network team to investigate oversubscription or other quality of service of the link, with an objective to bring the packet drop percentage as low as possible (less than 0.1%).
11.3.5 Remote Direct Memory Access-based clustering
Remote Direct Memory Access (RDMA) technology supports zero-copy networking, which makes it possible to read data directly from the main memory of one computer and write that data directly to the main memory of another computer. This technology bypasses the CPU intervention while processing the I/O leading to lower latency and a faster rate of data transfer.
IBM Spectrum Virtualize Cluster can be formed by using RDMA-capable NICs that use RoCE or iWARP technology. Consider the following points:
•Inter-node Ethernet connectivity can be done over identical ports only; such ports must be connected within the same switching fabric.
•If the cluster is to be created without any ISL (up to 300 meters), deploy Independent (isolated) switches.
•If the cluster is to be created on short-distance ISL (up to 10 km; that is, 6.2 miles), provision as many ISLs between switches as RDMA-capable cluster ports.
•For long-distance ISL (up to 100 km; that is 62 miles), DWDM and CWDM methods are applicable for L2 networks. Packet switched or VXLAN methods are deployed for L3 network as this equipment comes with deeper buffer “pockets”.
The following Ports must be opened in the firewall for IP-based RDMA clustering:
•TCP 4791, 21451, 21452, and 21455
•UDP 4791, 21451, 21452, and 21455
The first step to review if the node IP address is reachable and verify the required TCP/UDP ports are accessible in both directions. The following CLI output can be helpful to find the reason for connectivity error:
sainfo lsnodeipconnectivity
11.3.6 Advanced Copy services problems
The performance of a specific storage feature or overall storage subsystem are generally interlinked; that is, a bottleneck in one software or hardware layer might propagate to other layers. Therefore, problem isolation is critical part of performance analysis.
The first thing to check is if any unfixed events exist that require attention. After the fix procedure is followed to correct the alerts, the next step is to check the audit log to determine whether any activity exists that can trigger the performance issue. If that information correlates, more analysis can be done to check whether that specific feature is used.
The most common root causes for performance issues are SAN congestion, configuration changes, incorrect sizing/estimation of advanced copy services (replication, FlashCopy, and volume mirroring) or I/O load change, because of hardware component failure.
The following sections are a quick reference to common misconfigurations.
Remote Copy
Any disturbances in the SAN/WAN can cause congestion and packet drop, which can affect Metro Mirror (MM) or Global Mirror (GM) traffic. Because host I/O latency depends on MM or GM I/O completion to the remote cluster, a host can experience high latency. Based on various parameters, replication can be operatively stopped to protect host. Therefore, the following conditions affect GM/MM:
•Network congestion or fluctuation. Fix the network. Also, verify that port masking is enabled so that the congestion in replication ports does not affect clustering or host or storage ports.
•Overload of secondary or primary cluster. Monitor and throttle the host, which causes the condition.
•High background copy rate, which leaves less bandwidth to replicate foreground host I/O. Adjust the background copy rate so that the link does not get oversubscribed.
•A large Global Mirror with Change Volumes (GMCV) consistency group might introduce hundreds of milliseconds of pause when the replication cycle starts. Reduce the number of relationships in a consistency group if the observed I/O pause is not acceptable.
HyperSwap
Verify that the link between the sites is stable and has enough bandwidth to replicate the peak workload. Also, check if a volume must frequently change the replication direction from one site to other. This issue occurs when a specific volume is being written by hosts from both sites. Evaluate if this problem can be avoided to reduce frequent direction change. (Ignore it if the solution is designed to consider active/active access.)
If a single volume resynchronization between the sites takes too long, review the partnership link_bandwidth_mbits and per relationship_bandwidth_limit parameters.
FlashCopy
Consider the following points:
•Verify that the preferred node of FlashCopy source and target volumes is the same to avoid excessive internode communications.
•Verify the high background copy rates and clean rate of FlashCopy relations because these factors might cause backend overload.
•Port saturation or node saturation. Review if the values are correctly sized.
•Check the number of FC relationships in any FlashCopy consistency group. The larger the number of relationships, the higher the I/O pause time (Peak I/O Latency) when the CG starts.
•If the host I/O pattern is small and random, evaluate if reducing the FlashCopy grain size to 64 KB provides any improvement in latency compared to the default grain size of 256 KB.
Compression
Compress a volume if the data is compressible. No benefit is gained by compressing a volume where compression saving is less than 25% because that rate can reduce the overall performance of the RACE compression engine.
|
Note: A sequential I/O access pattern might not be a suitable candidate for RACE. Use the Comprestimator/Data Reduction Estimation Tool to size the workload.
|
Volume mirroring
Write performance of the mirrored volumes is dictated by the slowest copy. Reads are served from the Copy0 of the volume (in the case of a stretched cluster topology, both the copies can serve reads, which is dictated by the host site attribute). Therefore, size the solution accordingly.
|
Note: Because the mirroring layer maintains a bitmap copy on the quorum device, any unavailability of the quorum takes the mirroring volumes offline. Similarly, slow access to the quorum might also affect the performance of mirroring volumes.
|
Data reduction pools
Data reduction pools (DRPs) internally implement a log structured array (LSA), which means that writes (new or over-writes or updates) always allocate newer storage blocks.
The older blocks (with invalid data) are marked for garbage collection later. The garbage collection process defers the work as much as possible because the more it is deferred, the higher the chance of having to move only some valid data from the block to make that block available it to the free pool.
However, when the pool reaches more than 85% of its allocated capacity, garbage collection must speed up and move valid data more aggressively to make space available sooner. This process can lead to increased latency because of increased CPU usage and load on the backend. Therefore, it is recommended to manage storage provisioning to avoid such scenarios.
Users also are encouraged to pay specific attention to any GUI notifications and use best practices for managing physical space. Use data reduction only at one layer (at the virtualization layer or the back-end storage or drives) because no benefit is gain to compress and deduplicate the same data twice.
Encrypted data cannot be compressed; therefore, data reduction must be done before the data is encrypted. Correct sizing is crucial to get the best of performance from data reduction; therefore, use data reduction estimation tools to evaluate system performance and space saving.
11.3.7 Health status during upgrade
It is important to understand that during the software upgrade process, alerts that indicate the system is not healthy are reported. These alerts are normal behavior because the IBM FlashSystem node canisters go offline during this process; therefore, the system triggers these alerts.
While trying to upgrade an IBM FlashSystem, other messages might be issues, such as an error in verifying the signature of the update package.
This message does not mean that an issue exists in your system. At times, this issue occurs because not enough space exists on the system to copy the file, or the package is incomplete or contains errors. In this case, open a PMR with IBM Support and follow their instructions.
11.3.8 Managing physical capacity of over provisioned IBM FlashSystems
Drives and back-end controllers are available that include built-in hardware compression and other data reduction technologies that allow capacity to be provisioned above the available real physical capacity. Different data sets lead to different capacity savings and some data, such as encrypted data or compressed data, do not compress. When the physical capacity savings do not match the expected or provisioned capacity, the storage can run out of physical space, which leads to a write-protected drive or array.
To avoid running out of space on the system, the usable capacity must be carefully monitored on the GUI of the IBM FlashSystem. The IBM FlashSystem GUI is the only capacity dashboard that shows the physical capacity.
Monitoring is especially important when migrating substantial amounts of data onto the IBM FlashSystem. This migration typically occurs during the first part of the workload lifecycle because data is on-boarded or initially populated into the storage system.
IBM strongly encourages users to configure Call Home on the IBM FlashSystem. Call Home monitors the physical free space on the system and automatically opens a service call for systems that reach 99% of their usable capacity.
IBM Storage Insights also can monitor and report on any potential out of space conditions. The new Advisor function also warns users when the IBM FlashSystem is nearing full capacity.
When IBM FlashSystem reaches an out of space condition, the device drops into a read-only state. An assessment of the data compression ratio and the replanned capacity estimation must be done to determine how much outstanding storage demand might exist. This extra capacity must be prepared and presented to the host so that recovery can begin.
The approaches that can be taken to reclaim space on the IBM FlashSystem in this scenario vary by the capabilities of the system, any optional external back-end controllers, and the system configuration and pre-planned capacity overhead needs.
The following options are available:
•Add capacity to the IBM FlashSystem. Users must a plan that allows them to add capacity to the system when needed.
•Reserve a set of space in the IBM FlashSystem that makes it “seem” fuller than it really is, and that you can free up in an emergency situation. IBM FlashSystem can create a volume that is not compressed, de-duped, or thin provisioned (a fully allocated volume).
Create some of these volumes to reserve an amount of physical spaces. You likely want to name them; for example, “emergency buffer space”. If you are reaching the limits for physical capacity, delete one or more of these volumes for a temporary reprieve.
|
Important: Running out of space can be a serious situation. Recovery can be complicated and time-consuming. For this reason, it is imperative that proper planning and monitoring are done to avoid reaching this condition.
|
The following sections describe the process for recovering from an out of space condition.
Reclaiming and unlocking
After you assess and account for storage capacity, the first step is to contact IBM Support who can aid in unlocking the read-only mode and restoring operations. The reclamation task can take a long time to run, and larger flash arrays take longer to recover than smaller ones.
Freeing up space
The amount of used space can be reduced by using several methods after the IBM FlashSystem is unlocked by IBM Support.
To recover from out of space conditions on Standard Pools, the following methods are available:
•Add storage to the system, if possible.
•Migrate extents from the write protected array to other non-write protected MDisks with enough extents, which can be an external back-end storage array.
•Migrate volumes with extents on the write protected array to another pool. If possible, moving volumes from the IBM FlashSystem pool to another external pool can free up space in the IBM FlashSystem pool to allow for space reclamation. Because this volume moves into the new pool, its previously occupied flash extends are freed up (by way of SCSI unmap), which then goes to provide more free space to the IBM FlashSystem enclosure to be configured to a proper provisioning to support the compression ratio.
•Deleting dispensable volumes to free space. If possible, within the pool (managed disk group) on the IBM FlashSystem, delete any unnecessary volumes. The IBM FlashSystem supports SCSI unmap so deleting volumes realizes space reclamation benefits by using this method.
•Bring the volumes in the pool back online by using a Directed Maintenance Procedure.
For more information about types of recovery, see this IBM Support Technote.
11.4 Remote Support Assistance
Remote Support Assistance (RSA) enables IBM support to access the IBM FlashSystem device to perform troubleshooting and maintenance tasks. Support assistance can be configured to support personnel work on-site only, or to access the system both on-site and remotely. Both methods use secure connections to protect data in the communication between support center and system. Also, you can audit all actions that support personnel conduct on the system.
Figure 11-7 shows how to set up the remote support options in the GUI by selecting Settings → Support → Support Assistance → Reconfigure Settings.

Figure 11-7 Reconfigure settings
You can use only local support assistance if you have security restrictions that do not allow support to connect remotely to your systems. With Remote Support Assistance, support personnel can work on site and remotely through a secure connection from the support center. They can perform troubleshooting, upload support packages, and download software to the system with your permission. When you configure remote support assistance in the GUI, local support assistance also is enabled.
With the remote support assistance method, the following access types are available:
•At any time
Support center can start remote support sessions at any time.
•By permission only
Support center can start a remote support session only if permitted by an administrator. A time limit can be configured for the session.
|
Note: Systems that are purchased with a 3-year warranty and include Enterprise Class Support (ECS) are entitled to IBM support by using Remote Support Assistance to quickly connect and diagnose problems. However, IBM Support might choose to use this feature on non-ECS systems at their discretion; therefore, we recommend configuring and testing the connection on all systems.
|
To configure remote support assistance, the following prerequisites must be met:
•Call Home is configured with a valid email server.
•A valid service IP address is configured on each node on the system.
•A Remote Support Proxy server is configured if your system is behind a firewall or if you want to route traffic from multiple storage systems to the same place. Before you configure remote support assistance, the proxy server must be installed and configured separately. The IP address and the port number for the proxy server must be set up when remote support centers are enabled.
For more information about setting up the Remote Proxy Server, see this web page.
•If you do not have firewall restrictions and the storage nodes are directly connected to the Internet, request your network administrator to allow connections to 129.33.206.139 and 204.146.30.139 on port 22.
•Both uploading support packages and downloading software require direct connections to the Internet. A DNS server must be defined on your system for both of these functions to work. The Remote Proxy Server cannot be used to download files.
•To ensure that support packages are uploaded correctly, configure the firewall to allow connections to the following IP addresses on port 443: 129.42.56.189, 129.42.54.189, and 129.42.60.189.
•To ensure that software is downloaded correctly, configure the firewall to allow connections to the following IP addresses on port 22: 170.225.15.105,170.225.15.104, 170.225.15.107, 129.35.224.105, 129.35.224.104, and 129.35.224.107.
Remote support assistance can be configured by using GUI and CLI. For more information about configuring this assistance, see Implementing the IBM SAN Volume Controller with IBM Spectrum Virtualize V8.4, SG24-8467.
11.5 Call Home Connect Cloud and Health Checker feature
Formerly known as Call Home Web, the new Call Home Connect Cloud is a cloud-based version with improved feature to view Call Home information on the web.
Call Home is a function that is available in several IBM systems, including IBM FlashSystem, which allows them to automatically report problems and status to IBM.
Call Home Connect Cloud provides the following information about IBM systems:
•Automated tickets
•Warranty and contract status
•Health check alerts and recommendations
•System connectivity heartbeat
•Recommended software levels
•Inventory
•Security bulletins
To access the Call Home Connect Cloud, see the IBM Support home page.
In the IBM support website, Call Home Connect Cloud is available at My support → Call Home Web, as shown in Figure 11-8.

Figure 11-8 Call Home Connect Cloud (Call Home Web)
To allow Call Home Connect Cloud analyze data of IBM Spectrum Virtualize systems and provide useful information about them, the devices must be added to the tool. The machine type, model, and serial number are required to register the product in Call Home Connect Cloud. Also, it is required that IBM SAN Volume Controller have Call Home and inventory notification enabled and operating.
11.5.1 Health Checker
A new feature of Call Home Connect Cloud is the Health Checker, a tool that runs in the IBM Cloud.
It analyzes Call Home and inventory data of systems that are registered in Call Home Connect Cloud and validates their configuration. Then, it displays alerts and provides recommendations in the Call Home Connect Cloud tool.
|
Note: Call Home Connect Cloud is used because it provides useful information about your systems, and with the Health Checker feature, it helps you to monitor the system. It also operatively provides alerts and creates recommendations that are related to them.
|
Some of the functions of the IBM Call Home Connect Cloud and Health Checker were ported to IBM Storage Insights. For more information, see 11.6, “IBM Storage Insights” on page 524.
11.6 IBM Storage Insights
IBM Storage Insights is a part of the monitoring and ensuring continued availability of the IBM SAN Volume Controller.
Available at no charge, cloud-based IBM Storage Insights provides a single dashboard that gives you a clear view of all of your IBM block storage. You can make better decisions by seeing trends in performance and capacity. Storage health information enables you to focus on areas needing attention. In addition, when IBM support is needed, Storage Insights simplifies uploading logs, speeds resolution with online configuration data, and provides an overview of open tickets all in one place.
The following features are included:
•A unified view of IBM systems:
– Provides a single window to see all of your system’s characteristics.
– See all of your IBM storage inventory.
– Provides a live event feed so that you know, up to the second, what is going on with your storage and enables you to act fast.
•IBM Storage Insight collects telemetry data and Call Home data, and provides up-to-the-second system reporting of capacity and performance.
•Overall storage monitoring:
– The overall health of the system.
– Monitor the configuration to see whether it meets the best practices.
– System resource management: determine whether the system is being overly taxed and provide proactive recommendations to fix it.
•Storage Insights provides advanced customer service with an event filter that enables the following functions:
– The ability for you and support to view support tickets, open and close them, and track trends.
– Auto log collection capability to enable you to collect the logs and send them to IBM before support starts looking into the problem. This can save as much as 50% of the time to resolve the case.
In addition to the no-charge Storage Insights, there is also the option of Storage Insights Pro, which is a subscription service that provides longer historical views of data, offers more reporting and optimization options, and supports IBM file and block storage together with EMC VNX and VMAX.
Figure 11-9 shows the comparison of Storage Insights and Storage Insights Pro.

Figure 11-9 Storage Insights versus Storage Insights Pro comparison
Storage Insights provides a lightweight data collector that is deployed on a customer supplied server. This can be either a Linux, Windows, or AIX server, or a guest in a virtual machine (for example, a VMware guest).
The data collector streams performance, capacity, asset, and configuration metadata to your IBM Cloud instance.
The metadata flows in one direction: from your data center to IBM Cloud over HTTPS. In the IBM Cloud, your metadata is protected by physical, organizational, access, and security controls. IBM Storage Insights is ISO/IEC 27001 Information Security Management certified.
Collected metadata
The following metadata about the configuration and operations of storage resources is collected:
•Name, model, firmware, and type of storage system.
•Inventory and configuration metadata for the storage system’s resources, such as volumes, pools, disks, and ports.
•Capacity values, such as capacity, unassigned space, used space, and the compression ratio.
•Performance metrics, such as read and write data rates, I/O rates, and response times
•The application data that is stored on the storage systems cannot be accessed by the data collector.
Metadata access
Access to the metadata that is collected is restricted to the following users:
•The customer who owns the dashboard.
•The administrators who are authorized to access the dashboard, such as the customer’s operations team.
•The IBM Cloud team that is responsible for the day-to-day operation and maintenance of IBM Cloud instances.
•IBM Support for investigating and closing service tickets.
11.6.1 Storage Insights Customer Dashboard
Figure 11-10 shows a view of the Storage Insights (SI) main dashboard and the systems that it is monitoring.

Figure 11-10 Storage Insights main dashboard
11.6.2 Customized dashboards to monitor your storage
With the latest release of IBM Storage Insights, you can customize the dashboard to show only a subset of the systems that are monitored. This feature is useful for customers that might be Cloud Service Providers (CSP) and want only a specific user to see those machines for which they are paying.
For more information about setting up the customized dashboard, see this web page.
11.6.3 Creating support tickets
From the Dashboard GUI, IBM SI can create support tickets for one of the systems it reports about. Complete the following steps:
1. Go to the SI main dashboard and then, choose the system for which you want to raise the ticket. From this window, select Action → Create/Update Ticket.
Figure 11-11 shows how to create or update a support ticket from the SI dashboard.
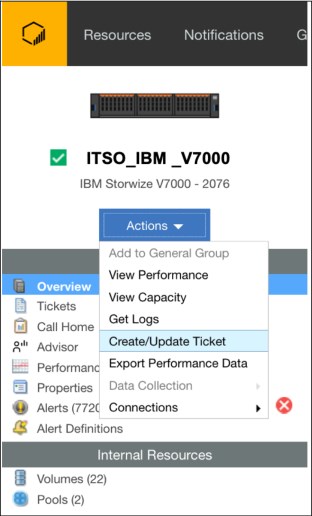
Figure 11-11 Creating or updating a support ticket
Figure 11-12 shows you the window where you can either create or update.

Figure 11-12 Create ticket
|
Note: The Permission given information box (see Figure 11-12) is an option that you must enable in the IBM Spectrum Virtualize GUI. For more information, see 11.4, “Remote Support Assistance” on page 521.
|
2. Select the Create Ticket option and you are presented with several windows with which you use to complete with the machine details, problem description, and the option to upload logs.
Figure 11-13 shows the ticket data collection that is done by the SI application.

Figure 11-13 Collecting information for ticket window
3. Add a problem description and attach other files, such as error logs or screen captures of error messages in the Add a note or attachment window (see Figure 11-14).
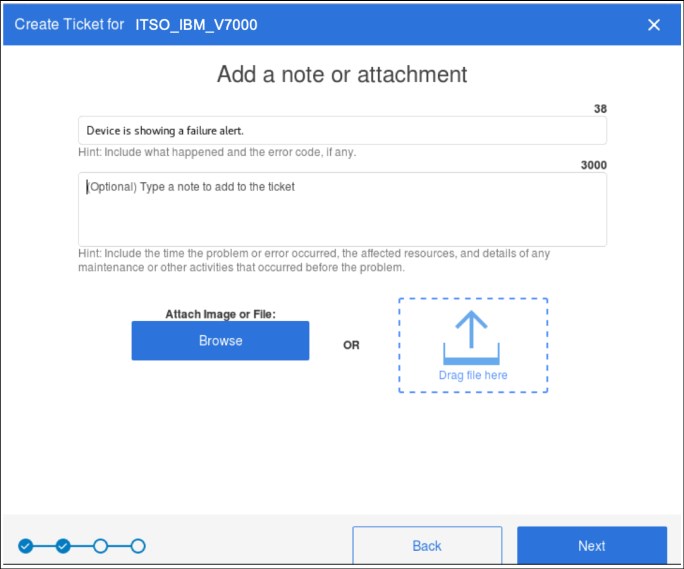
Figure 11-14 Adding problem description and any other information
4. Set a severity level for the ticket, ranging from a severity 1 for a system down or extreme business impact, to severity 4, which is for non-critical issues (see Figure 11-15).

Figure 11-15 Set severity level
A summary of the data that is used to create the ticket is shown in the Review the ticket window (see Figure 11-16).
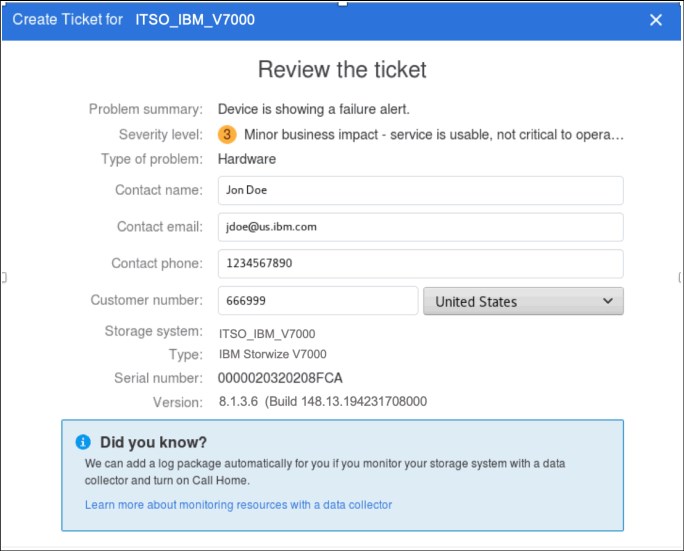
Figure 11-16 Review the ticket information
5. When completed, click the Create Ticket button to create the support ticket and send it to IBM (see Figure 11-17). The ticket number is created by the IBM Support system and sent back to your SI instance.
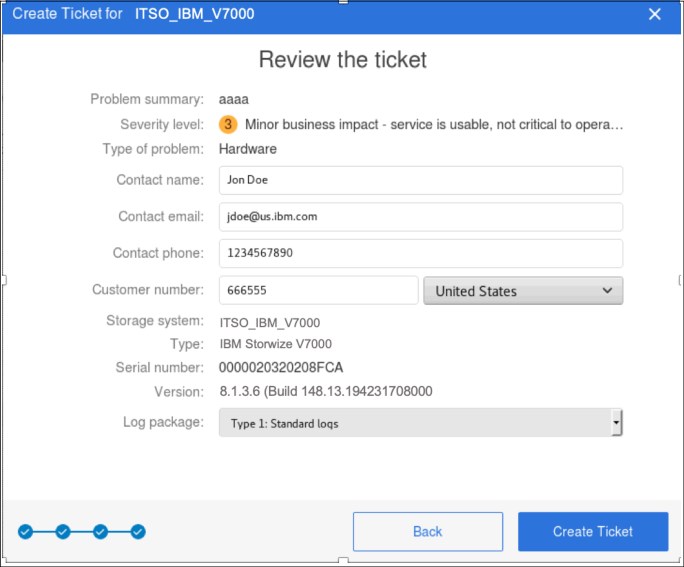
Figure 11-17 Final summary before ticket creation
6. Review the summary of the open and closed ticket numbers for the system that is selected by using the Action menu option (see Figure 11-18).

Figure 11-18 Ticket summary
11.6.4 Updating support tickets
IBM Storage Insights also can update support tickets from the Dashboard GUI for any of the systems it reports about.
Complete the following steps:
1. Go to the SI dashboard and then, choose the system for which you want to update the ticket. From this window, select Actions → Create/Update Ticket.

Figure 11-19 SI Update Ticket
3. Figure 11-20 shows the next window in which you must enter the PMR number and then, click Next. This PMR input uses the following format: TS00XXXXX.
This information was supplied when you created the ticket or by IBM Support if the PMR was created by a problem Call Home event (assuming that Call Home is enabled).
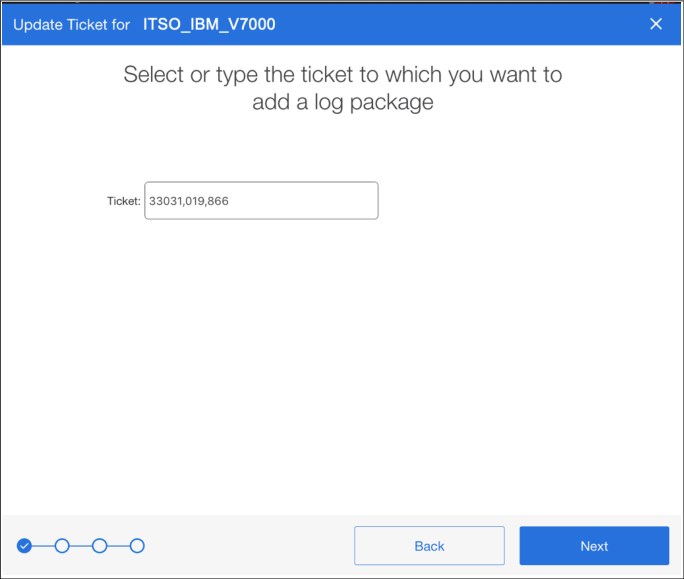
Figure 11-20 Entering the Salesforce/PMR ticket number
4. Click Next. A window opens in which you must choose the log type to upload. Figure 11-21 on page 537 shows the log selection window and the following available options:
– Type 1: Standard logs, which is used For general problems, including simple hardware and simple performance problems.
– Type 2: Standard logs and the most recent statesave log.
– Type 3: Standard logs and the most recent statesave log from each node. Used for 1195 and 1196 node errors and 2030 software restart errors.
– Type 4: Standard logs and new statesave logs. For complex performance problems, and problems with interoperability of hosts or storage systems, compressed volumes, and Remote Copy operations including 1920 errors.
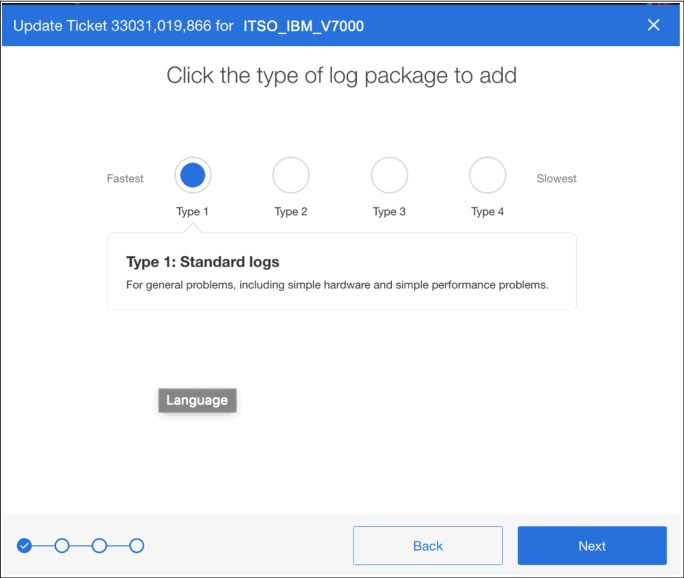
Figure 11-21 Log type selection
If you are unsure which log type to upload, ask IBM Support for guidance. The most common type to use is Type 1; therefore, this type is the default. The other types are more detailed logs and for issues in order of complexity.
5. After selecting the type of logs, click Next. The log collection and upload starts. When completed, the log completion window opens.
11.6.5 SI Advisor
IBM Storage Insights continually evolves and the latest addition is a new option from the action menu called Advisor.
IBM Storage Insights analyzes your device data to identify violations of best practice guidelines and other risks, and to provide recommendations about how to address these potential problems. Select the system from the dashboard and then, click the Advisor option to view these recommendations. To see more information about a recommendation or to acknowledge it, double-click the recommendation.
Figure 11-22 shows the initial SI advisor menu.

Figure 11-22 SI Advisor menu
Figure 11-23 shows an example of the detailed SI Advisor recommendations.
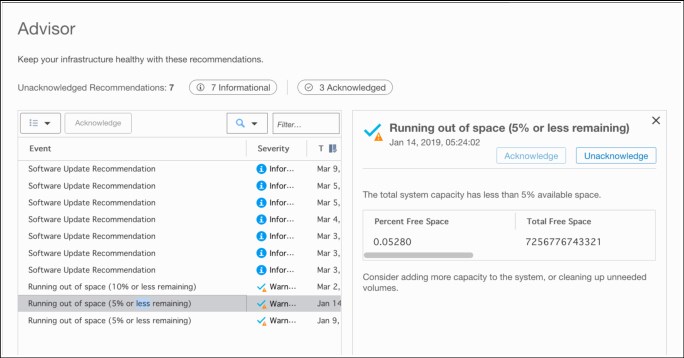
Figure 11-23 Advisor detailed summary of recommendations
The image shows the information about a “Running out of space” recommendation on the Advisor page. In this scenario, the user clicked the Warning tag to focus on only the recommendations that feature a “Warning” severity.
For more information about setting and configuring the Advisor options, see this web page.
..................Content has been hidden....................
You can't read the all page of ebook, please click here login for view all page.