7
Traffic Prediction Using Machine Learning and IoT
Daksh Pratap Singh and Dolly Sharma*
Department of Computer Science and Engineering, Amity School of Engineering and Technology, Amity University, Noida, India
Abstract
Real-time traffic information uses advanced APIs and IOT-based mobile phone sensors to send information required like speed, average road density and differentiation using colors and graphs from low, moderate, and high traffic with a traffic simulator for creating customized routes to predict certain traffic scenarios manually. Google maps was very able to predict the traffic but was dependent only on GPS sensors to predict the traffic whereas this application stands out to be more precise by using a vehicle’s speed to predict the traffic. The objective of this work is to develop an android application by targeting user’s need to see real-time traffic using IOT, Machine Learning and GPS-based advance APIs. APIs are collecting data using crowdsourcing and real-time user’s location accumulation on server by microservices. This application consists of industry-ready MVVM architecture, JSON parsing, real-time data rendering, data manipulation, and IOT-based cloud computing. The application predicts traffic with utmost precision and is capable of taking a vehicle’s speed into consideration to predict vehicular traffic and is also capable of simulating the traffic on one’s own terms.
Keywords: APIs, GPS, machine learning, IOT, simulation
7.1 Introduction
The application is constructed and divided into two parts. The first section is used for predicting traffic on two ideas accelerometer and Google APIs, the second section is based on rust programming to construct a traffic simulator.
7.1.1 Real Time Traffic
Android Application is based on Real-time traffic data engine using advanced cloud APIs, IOT, Machine learning, and cloud computing [1–5]. It includes crowdsourcing data concept also to collect the user’s location to enhance the information accuracy from time to time. In backend APIs we have used TensorFlow advance methods to train our model for giving results effectively.
It consists of all updated technology on android environment because this is really flexible for users.
7.1.2 Traffic Simulation
Traffic diversion or the reenactment of transportation structures is the logical showing of transportation systems (e.g., interstate convergences, vein courses, roundabouts, downtown grid structures, etc.) through the usage of program to all the more probable help plan, structure, and work transportation frameworks. Reproduction of transportation structures started indeed forty years prior, and is a critical locale of request in busy time gridlock building and transportation masterminding today. Distinctive national and close by transportation workplaces, insightful associations and directing firms use reenactment to help in their organization of transportation frameworks [5].
This chapter explains the android application project based on real-time traffic information engine. It is based on IoT, ML, MVVM, cloud computing, microservices, and JSON parsing. It will explain the whole workflow, architecture, and model of android application. Real life use cases and scenarios where it can help users to get the real time information and how they are contributing to make this better are also discussed thoroughly in this chapter.
The backend workflow of machine learning and how it will improve real-time data rendering engine from time to time is also explained briefly.
Here a combination of different new technologies is used to tackle the problem of real time traffic information. To understand the whole working model, one should first understand how traffic is being calculated.
7.2 Literature Review
In previously written research papers, it was very well discussed that, adaptability to bigger systems, steady information assortment at different areas all the while and guaranteeing the unwavering quality are issues which are tended to. Travel time information obtained from Google Distance Matrix API, which is a prepared data discharged dependent on publicly supported cell phone information, is utilized in this investigation to distinguish utilization of publicly support travel time information and transport arranging exercises [6]. In simple words, it is very well written that, The Distance Matrix API can be utilized to play out various errands, for example, mentioning the separation information for various travel modes, mentioning separation information in various units (for instance, in kilometers or miles), and assessing travel time in rush hour gridlock. The API is planned for designers who wish to figure travel separation and time between various focuses inside maps that are given by one of the Google Maps APIs. As discussed in various smart city models that, the objective is build up a coordinated administration framework that would combine forecasts for vehicular and other urban traffic streams, for example, person on foot or bicycle. This new age of brilliant city the board frameworks could uncover significant level relationships between vehicles, passerby and bicycle streams inside cities [6].
The most important job is to make it possible for vehicles to communicate with the internet and it was very well described by Zachary W. Lamb that, Vehicular ad-hoc Networks (VANETs) are a basic piece of Intelligent Transportation Systems (ITS) that encourage interchanges among vehicles and the web [7]. As discussed by Mr. Sun Ye that it is necessary to use public transportation to get rid of traffic congestion, he proposed a model called traffic congestion charge which says, traffic congestion charge will elevate resident to utilize open transportation. In this way it must take full advancement of open transportation as the reason. Right off the bat, the system of open transportation must have the option to fulfil individuals’ solicitation for transportation openness, accommodations and solace. Also, open transportation ought to be depended with some administration need, for example, liberated from blockage charging, foundation open transportation selective path, traveling some portion of charge reserve to open transportation put, etc. so as to draw in more individuals to take open transportation rather than vehicle excursion to diminish traffic clog. The base for the application remains strong because of tensor flow because it gives an assortment of work processes to create and prepare models utilizing Python, JavaScript, or Swift, and to effectively send in the cloud, on-prem, in the program, or on-gadget regardless of what language you use [7].
7.3 Methodology
This application is constructed with the help of various sensors present in a smartphone and also uses some various mapping features.
GPS—Global Positioning System—There is a set of twenty-four satellites to provide locations and other information. It supplies information of locations like what we are seeing on Google Maps but in case of traffic, the problem is there are not many satellites to track each vehicle that’s in this API. We are using Crowdsourcing in which we are taking real-time location from user’s phone and speed from phone sensors using IOT and ML and sending it to API to store in DB [8]. Like this all users are sending the data to API and accordingly with FLY-CROW algorithm we are calculating average traffic in different locations. It’s not accurate because we are getting data from different mobiles who have only installed the application that’s why we are using ML to make our model always learn.
FLY-CROW
INPUT ACC_INPUT, LONGITUDE, LATITUDE API_PLANK(ACC_INPUT, LONGITUDE, LATITUDE) INITIALIZE RES
SET RES = API_PLANK(ACC_INPUT, LONGITUDE, LATITUDE) RETURN RES
In API_PLANK POST request call we are sending all the required parameters and doing calculations in backend using cloud computing.
TensorFlow—TensorFlow plans to give world class on-contraption selection for any TensorFlow model. In any case, the TensorFlow mediator before long supports an obliged subset of TensorFlow managers that have been streamlined for on-contraceptive use. This induces two or three models to require extra strides to work with TensorFlow [9].
Location Manager—Before my application can start suffering region reestablishes, it is required to play out sensible walks around set up get to. In this activity, we’ll grasp what these procedures entail. The terminating advance of setting up zone update get to will be to verbalize real supports in the show. In case assents are feeling the loss of, the application will get a Security Exception at runtime.
Machine Learning—We have used cognitive learning APIs to make self-learning model. Machine learning is one the best technologies which we are using in our application to make it more accurate from time to time.
PC-based understanding (ML) is a depiction of figuring that draws in programming applications to wind up being dependably exact in anticipating results without being unequivocally adjusted. The key clarification for AI is to make tallies that can get input information and utilize quantifiable assessment to imagine a yield while fortifying yields as new information gets open.
Maps JavaScript API—The Maps JavaScript API enables us to show people in general travel system of a city on our guide utilizing the Transit Layer object. At the point when the Transit Layer is empowered, and the guide is focused on a city that supports travel data, the guide will show significant travel lines as thick, shaded lines. The shade of the line is set dependent on data from the travel line administrator [10]. Empowering the Transit Layer will modify the style of the base guide to all the more likely accentuate travel courses. Travel data is just accessible in select areas. To see a rundown of urban communities where open travel data is as of now accessible, if it’s not too much trouble counsel this rundown. In case we’re an open organization that directs open transportation for our city and might want our information to be incorporated, it would be ideal to visit the Google Transit Partner Program site to find out additional.
Data.Polygon—The Data.Polygon class handles polygon twisting for us. We can pass it a variety of at least one straight rings, characterized as scope/longitude organizes. The principal direct ring characterizes the external limit of the polygon. On the off chance that we pass more than one straight ring, the second and ensuing direct rings are utilized to characterize inward ways (gaps) in the polygon.
GeoJSON—GeoJSON is a typical standard for sharing geospatial information on the web. It is lightweight and effectively intelligible, making it perfect for sharing and teaming up. With the Data layer, we can add GeoJSON information to a Google map in only one line of code [10].
Layers—Layers are questions on the guide that comprise of at least one separate things, yet are controlled as a solitary unit. Layers for the most part reflect assortments of articles that we add over the guide to assign a typical affiliation. The Maps JavaScript API deals with the introduction of articles inside layers by rendering their constituent things into one item (commonly a tile overlay) and showing them as the guide’s viewport changes [10]. Layers may likewise adjust the introduction layer of the guide itself, somewhat changing the base tiles in a manner predictable with the layer. Note that most layers, by configuration, may not be acquired by means of their individual articles, however may just be controlled as a unit.
Distance Matrix—Getting to the Distance Matrix organization is nonconcurrent, since the Google Maps API needs to make a call to an outside server. Thusly, we need to pass a callback method to perpetual stock of the requesting, to process the results.
We get to the Distance Matrix organization inside your code through the google.maps. DistanceMatrixServiceconstructorobject [11]. This system begins a sale to the Distance Matrix organization, passing it a Distance Matrix Request object demanding containing the causes, objectives, and travel mode, similarly as a callback method to perpetual stockpile of the response.
Heatmap—A heatmap is a perception used to delineate the power of information at land focuses. At the point when the Heatmap Layer is empowered, a shaded overlay will show up over the guide. As a matter of course, territories of higher force will be shaded red, and zones of lower power will seem green [11]. It is a bit of the google.maps.visualization library, and isn’t stacked as per usual. The Visualization classes are a free library, separate from the essential Maps JavaScript API code. To use the value contained inside this library, we ought to at first stack it using the libraries parameter in the Maps JavaScript API bootstrap URL.
Point by point and Realistic Simulation—PTV Vissim is shown to be the world’s standard for traffic and transport masterminding and for a substantial avocation: It gives we a down to earth and point by point outline about the situation of the traffic stream and impacts, with the possible results to describe various think about how conceivable it is that circumstances [12]. With our associations and connectors thought in PTV Vissim, we can depict framework in detail and model different geometries—from a standard center to complex assemblies.
Speedy and Simple Set-Up—Our traffic diversion writing computer programs is definitely not hard to use, and certainly no scripting required. PTV Vissim is the most incredible programming for infinitesimal, mesoscopic, or even a blend of both in a crossbreed reenactment. If we are starting at now using transport mechanical assemblies, chances are we can rely upon PTV Vissim without acquiring new capacities.
Adaptable and Seamless Integration—As a significant part of the PTV Traffic Suite, we can perfectly interface the traffic multiplication programming to other PTV programming game plans. That, yet the nonexclusive COM interface licenses we to similarly help out external applications. PTV Vissim is a versatile programming that broadens our microscopic orchestrating entertainment into a consistent test condition paying little mind to how we choose to utilize the traffic generation programming [12].
Solid Network and Support—Within excess of 16,500 customers, PTV Vissim is an option that is other than a traffic and transport programming; it is a system that is reliably creating. PTV has over 40 years of contribution with the vehicle strategy and traffic game plans industry so we can misuse our sweeping documentation, wide getting ready projects, customer bundle get-togethers similarly as our master customer help and support gathering, all day every day.
TransModeler is an earth shattering and versatile traffic amusement pack proper to a wide bunch of traffic masterminding and showing assignments as shown in Figure 7.1. TransModeler can reenact a wide scope of road frameworks, from streets to downtown districts, and can stall wide zone multimodal arranges in amazing point of interest and with high unwaveringness. We can exhibit and picture the lead of complex traffic structures in a 2-dimensional or 3-dimensional GIS condition to depict and evaluate traffic stream components, traffic sign and ITS exercises, and for the most part organize execution [13].
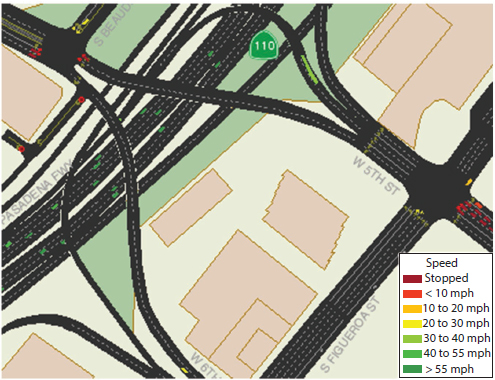
Figure 7.1 Transmodeler.
Endorsement—It is the strategy to choose if the reenactment model is an exact depiction of the structure under scrutiny. This sets up that the model direct exactly and constantly addresses this present reality system being reenacted, over the extent of conditions predicted and it incorporates the going with critical advances.
- Picking up and orchestrating genuine data.
- Setting up the endorsement criteria—Hypotheses, Statistical tests, etc.
- Test plan for endorsement including a grouping of circumstances.
- Perform endorsement study.
- Perceive the purposes behind dissatisfaction expecting any and fix the model in like way.
- Street transportation, that is, convincing progression of individuals and things through physical street and road systems is an enrapturing issue.
7.4 Architecture
The root of an application is basically the proper division of its modules that is constructing a prefect road map to the desired application and in this application division of workflow in APIs was most important.
7.4.1 API Architecture
We are using cloud computing and google traffic channeling API for getting data and using FLY-CROW to make more accurate with cognitive learning models as shown in Figure 7.2.
As per the architecture or request we are using SSL offloading to make it more secure and routing for service resources. We are using logger to log all the operations whatever is happening. It will help to debug the issue at the time of emergency.
Response caching helps to make application more fast at the time of giving response of same request data [14].
7.4.2 File Structure
It is important to divide basic file structure to access the correct file at appropriate executable time as shown in Figure 7.3.
GPS Enabled Architecture—As we all know crowdsourcing data process in which we are getting data from many users and tell results on the basis of the data but in traffic analysis case we are using data from user’s device and GPS satellites both. Here the accuracy depends on the number of active satellites on specific location.
We can understand this by taking one example:
Let’s say we are going from Location A to Location B with surrounding of n no. of users having GPS enabled in their device so the data what we will get as a traffic on our devices it depends on number of users, their vehicle speeds, and GPS data given by number of active satellites on specific location. One more important thing is required, the latitude and longitude of specific location because without this API can’t able to give specific outputs for different locations.
ML plays an important role in this process because with each operation it is getting smarter to provide more accurate output for users [14].
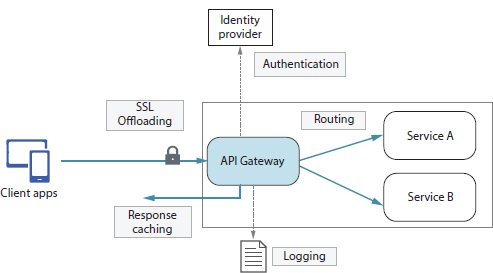
Figure 7.2 API Gateway. Image Source-https://docs.microsoft.com/en-us/azure/architecture/microservices/design/gateway.
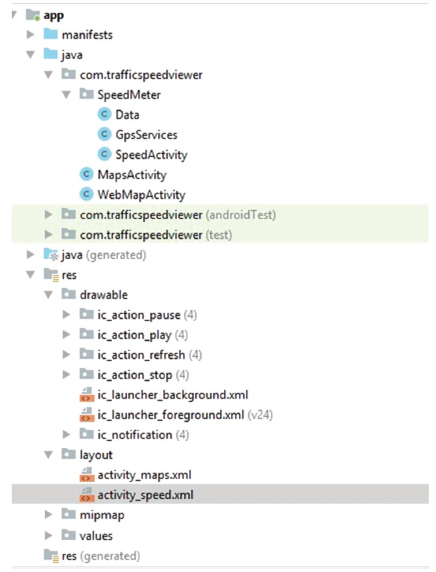
Figure 7.3 Application file structure.
Why AWS IoT—There are such a large number of administrations expansive and profound, multi-layered security, unrivaled AI incorporation, and demonstrated at scale. There are some different things which API has based on AWS IoT center, AWS IoT Device Defender, AWS IoT Device Management, AWS IoT Things Graph, AWS IoT Analytics, AWS IoT Events, and AWS IoT Sitewise [15].
7.4.3 Simulator Architecture
Parameterized Turning Speed—The speed at which turns are made ought to be tunable by the client or variable subject to turning range, number of ways, and so on. It is possible that the turning-speed model could influence computation of surrogate measures. SIMTRAFFIC claims a parameterized turning-speed model and VISSIM and Texas licenses going rate to be subject to vehicle type and turning range [16].
Response to Yellow—Appearing of a driver’s response to yellow is major to quantify issue zone execution. It could be colossal for computation of surrogate measures if the response model is variable by driver type, vehicle type, and so forth. Most models explored have response “by driver type.” Paramics records its showing limits “by driver.” This assembles a steady size of parameters, as opposed to a lot of fixed parameters (one for each sort) [16]. VISSIM has response models with unequivocal driver-type parameter settings for both sign groupings with and without blasting completions administrative work (for both European and North American signalization moves close).
Variable Driver Reaction Time—Mirrors the model’s capacity to address the concede experienced between the driver’s particular confirmation of a potential mishap and the utilization of control measures (slowing down, accelerating, or route change) to stay away from influence. When in doubt, drivers’ response times fluctuate by getting, age, and so on. HUTSIM is planning coordination of nanoscopic appearing of driver responses and Paramics models driver care.
Intersection point Box Movements- For assessment of surrogate flourishing measures, it is colossal for the reenactment to show headway of the vehicles in the convergence point with fundamental commitment. For instance, for left turns, Texas models get together progressions as blends of properly evaluated round parts from the purpose of intermingling of the starting route to the point of assembly of the getting way
Variable Acceleration (and Deceleration) Rate—Diversions should join displaying of various vehicle constrains by vehicle type. Unbelievable DRs (and most remarkable DR distributions) may deride the genuine encounters of surrogate measures. This is related with all models that were watched out for.
Sight-Distance Limits—Models that limit the “look-ahead” parcel of drivers when picking (or model the look-ahead separation by driver or driver type) can much more precisely model the shared trait with drivers in surrogate measure encounters. Additionally, sight-separation cutoff centers can mirror the displaying of roadway counteractions, for example, turns, tops, trees, structures, and so forth. This may also apply to appearing of in-vehicle sight imperatives, for example, those that happen when following a huge truck. A gigantic piece of the models outlined need refined sight-segment hindrance showing. VISSIM makes them model of both the measure of vehicles to look forward and a division ahead to consider before making moves (as do different models as recorded in the table), yet no block impacts are appeared [16]. CORSIM has a sight-division limit for vehicles at the stop bar to examine ahead for vehicles clashing with their improvement in the crossing point.
Moving Yield—Cautious displaying of posted notification and zones will be basic for precise gathering of surrogate measures. It is guessed that the SSAM will be utilized for flourishing assessments of yield assignments versus stop or signalized works out [16]. A “moving” yield displays that the yield development can happen with a moved back vehicle that doesn’t appear at a stop before returning the traffic stream.
Vehicles Interact With Pedestrians—Individual by strolling success is of over the top centrality to traffic engineers. Redirections that model vehicle correspondences with walkers may have the choice to review the person by strolling security impacts of different various decisions. VISSIM and Paramics expressly model walker enhancements in crosswalks during individual by strolling timings.
All around masterminded Merging—Suggests the marvel where certain driver types moderate or stop to permit vehicles to blend (more) securely, which happens when in doubt, instead of just demonstrating moving back or halting from a responsive perspective. Neighborly joining shows that the going with vehicle can make a hole for a joining vehicle. CORSIM and VISSIM join such lead and AIMSUN unites such direct for incline assemblies.
Appearing of Multilane Merging Behavior—In different locales, it is run of the mill for vehicles entering the mainline stream to cross the strategy for an advancing toward vehicle going a practically identical course as the masterminded bearing of advancement of the entering vehicle and begin charging in the circumscribing way. As of now, advancing toward vehicle can proceed at its current speed without breaking for the turning vehicle (the move is viewed as obliging conduct). Expansion models that consider such practices to happen will considerably more unequivocally address the debate direct of territories that experience high volumes of such practices with wide multilane arterials [17]. VISSIM can show such direct with upheld passages for unequivocal driver types, yet it isn’t reliant on the way that the pushing toward vehicle is in.
Appearing of Right-of-Way in Intersection—A fundamental issue for demonstrating trouble occasions is that some turning practices must make slowing down occasions by the traffic that has the decision to proceed (i.e., making a left turn before advancing toward traffic) to be viewed as risky occasions. On the off chance that an amusement model doesn’t address this direct, the surrogates can’t be sensibly evaluated [17]. For instance, AIMSUN registers the TTC around the start of a left-go move to pick whether an opening can be perceived with sensible slowing down by the choice to proceed with vehicle. Along these lines, some initial attestation moves will, by definition, produce strife occasions.
Representing/Recording of Maneuver Failures—Certification of an opening is one occasion that can cause struggle occasions. Then again, the “dismissal of hole” occasions may also have a surrogate security proposal. Models that can record the removal or “disappointment” of the initial assertion technique could pass on another surrogate degree of the dispersing and number of dismissed holes. Models that can trade hole insistence occasion subtleties could in like way reasonably pass on hole dissatisfaction occasion subtleties. For instance, Texas can trade a table of contention “check” (normally an ejection if not followed by a certification occasion) and confirmation occasions.
Halting Maneuvers—On-road ending (proportional and twofold stopping) makes struggle conditions, way changes, and so on when in doubt and has a basic success impact. Reenactments that model on-road ending moves are delighted in. CORSIM models leaving as “emotionally happening on-road scenes of variable term,” rather than unequivocally indicating genuine vehicles halting to stop and a brief timeframe later restarting their excursion later. The mean term of ending occasions must be under 100 s, and there must be in excess of 14 occasions for consistently.
Displaying of Turn Signaling—One essential bit of back fight occasions is the utilization of signs by drivers. How flags (i.e., nonattendance of hailing) sway the vehicle following and way changing strategies for thinking is fundamental to investigating the rehash and truth of back fight occasions. Turn hailing is strikingly a badly arranged indicating wonder. AIMSUN, for instance, models the “crisis” of a vehicle changing to another way ahead of schedule of a go to pick how solid the vehicle will be in cutting off decision to proceed with vehicles to make its turn, which could be viewed as a sort of evident appearing of turn hailing. VISSIM models signals for way changes (i.e., signals are constantly utilized and two or three drivers will open holes to permit hardening), in any case doesn’t show the nearness or nonappearance of a sign at an advantage or left turn at an intersection point. Also, the vicinity of a sign on a vehicle in a circumscribing way impacts driver lead.
U-Turns—U-turns some of the time cause fight conditions and a few regions experience sufficiently high volumes of U-turn traffic that their effect on success ought to be tended to (e.g., including U-goes to relationship at the mix corner or to locate a decent pace entrance.
Minute vehicle lead and correspondence with the close to vehicles pick generally speaking traffic direct at the typically indisputable level subject to the going with segments: most unmistakable accelerating/deceleration and driver practices, for example, upheld headway and reaction time, hole confirmation edge for way changing, and shrewdness advance timespan or parcel for way creating [17]. Those parameters genuinely sway thickness and postponements in the engendering, and subsequently the general traffic structure. Underneath, we talk about the two elective models and feature the rule highlights.
State Route (SR) 99 northbound was picked for model change. This zone of interstate scopes from the Elk Grove Blvd. trade to the US-50 interstate exchange south of downtown Sacramento, CA. There are 9 exchanges with near to vein boulevards; 4 divided cloverleaf trades, 3 full cloverleaf exchanges, and 2 important stone exchanges with the region arterials. The entrance ramp hardening and weaving districts orchestrated at the Sheldon Rd. exchange, the Florin Rd. trade, likewise as the exit ramp at the US-50 road exchange, add to the morning top unpredictable postpone saw right now. This summit period usually starts at 6:30 AM and finishes around 10:00 AM, and the morning blockage arrangement shows the normal top time allotment when there is notoriety for suburb to downtown excursions during the morning hours [17].
As shown in Figure 7.4 is the carpool way information was amassed with those of the broadly significant routes considering the way that the carpool way is nearly plugged up and shows directly around a relative blockage design (bottleneck an area and length) as the for the most part accommodating ways. It may be seen that taking everything into account, the reproduced streams fulfilled the alteration measures. In any case, the AIMSUN model can’t actually reenact the development of the downstream weaving bottleneck at US-50, under the GEH, MAPE, and RMSE measures. This could be credited to the restriction that model’s way changing defense doesn’t mirror the curiously solid and visit way change direct. Indicating such zone may require better cleared a path changing opening certification standards that unequivocally fit such an exit ramp bottleneck [17].
Traffic reenactment models can give a financially savvy and adaptable choice to assess the different roadway plans and traffic the executive’s choices. To do as such, we first need to guarantee that the models are suitably aligned to mirror the current conditions. The utilization of unmanned elevated vehicle (UAV) has increased specific consideration in the transportation framework industry. On an across the country scale, there has been a pattern to join UAV in rush hour gridlock tasks, for example, traffic observing and framework the board exercises which incorporate extension and roadway assessments. The objective of this examination is to assess the viability of using UAV to approve traffic recreation model yields. Keeping that in mind, two reproduction models of a convergence in Auburn.
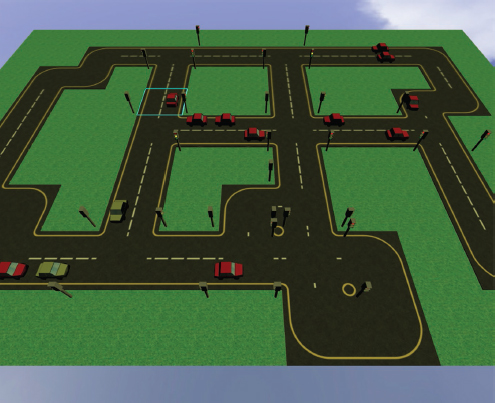
Figure 7.4 Road transplant simulation board with extra road patch.
7.4.4 Workflow in Application
The activity diagram as shown in Figure 7.5 depicts the workflow in the application, when a user installs the application, GPS is enabled and then traffic data from Google server is requested map API is invoked and that particular response is received by the device and after rendering the data is received by the application.
7.4.5 Workflow of Google APIs in the Application
The pictorial representation of the workflow of APIs in the application and only depiction of the relation between the Google APIs in the application as shown in Figure 7.6.
7.5 Results
The application displays three features i.e. it shows traffic scenarios, it shows vehicle moving speed and it also shows the traffic scenario simulator.
7.5.1 Traffic Scenario
The traffic scenario is presented in the conventional traffic display methods i.e. using heatmaps.
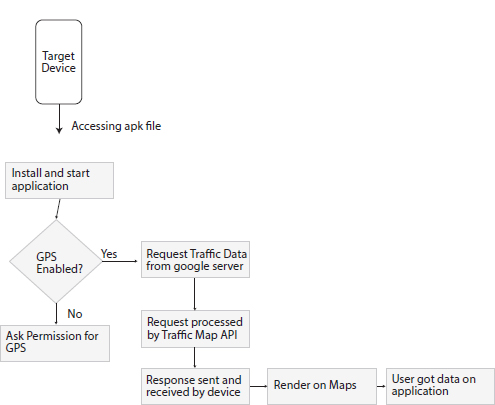
Figure 7.5 Workflow in application.

Figure 7.6 Workflow of Google API in the application.
7.5.1.1 Low Traffic
As shown in Figure 7.7 this is the main screen for traffic status of your current location by which users can get to know how much traffic he or she can face during the driving.
As shown in Figure 7.7, the green color on the route predicts lowest traffic.
The heatmap is responsible for showing colors on the basis of traffic. For example—The green color on the image shows low traffic. The Google maps feature provide a very well visualized and accurate display that is why this is used in this application.
7.5.1.2 Moderate Traffic
The moderate traffic scenario is the yellow color of the route predicts that there is moderate traffic on that route as shown in Figure 7.8.
Layers provides a good number of layering factors on the map structure to differentiate between the roads, highways and other concrete structures. The best thing the color effects are precise and are sequentially connecting themselves. The moderate traffic is always considered as the most less accurate traffic scenario but in this application usage of accelerometer makes it much more precise.
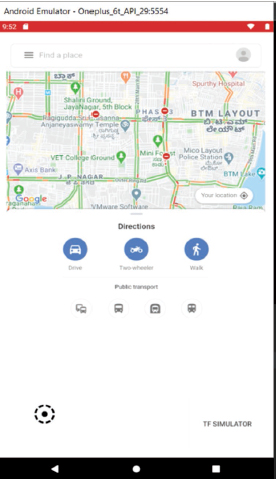
Figure 7.7 Low traffic.
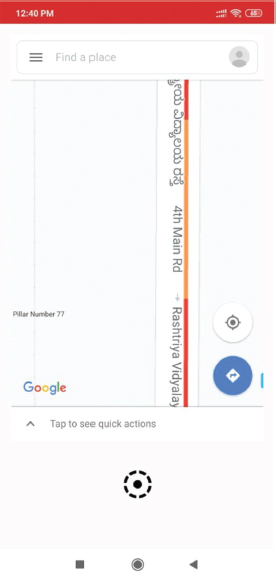
Figure 7.8 Moderate traffic.
7.5.1.3 High Traffic
As shown in Figure 7.9 there is only red color on the route, this predicts that there is high traffic on that particular route. The main reason for choosing Google Maps API was to display the map in a much more attractive manner rather than just displaying text for traffic scenario. Lesser the vehicles speed lesser the average of the speeds and larger the vehicular traffic hence technically the average of speed of vehicles is indirectly proportional to the traffic scenario.
7.5.2 Speed Viewer
As shown in Figure 7.10 it shows speed screen with max speed, average speed, distance, time, and accuracy. The use of chronometer provides much more accurate speed detection and hence provide concrete data for traffic prediction. The speed is also considered as a proof for showing the applications accuracy for finding the speed and using it at the back end for finding the traffic scenarios.
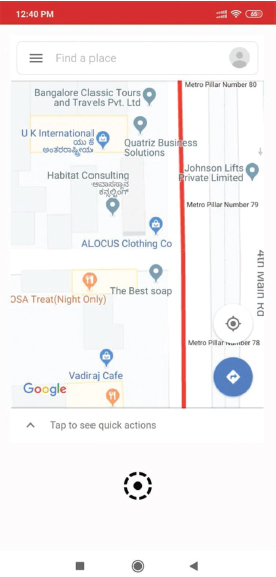
Figure 7.9 High traffic.
7.5.3 Traffic Simulator
The simulator provided the flexibility to construct own passages and add/delete vehicles.
7.5.3.1 1st View
The simulator shows the traffic into 3 structural views, as shown in Figure 7.11 it shows the 1st view with edit mode turned on to add or remove cars. This could help the administration with various traffic scenarios.
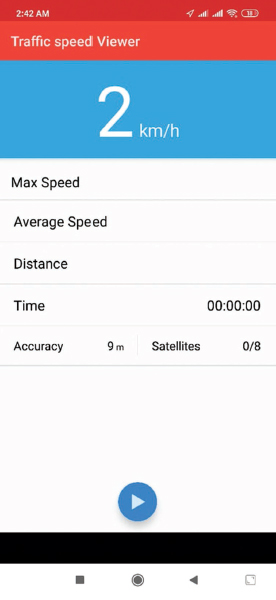
Figure 7.10 Speed status screen.
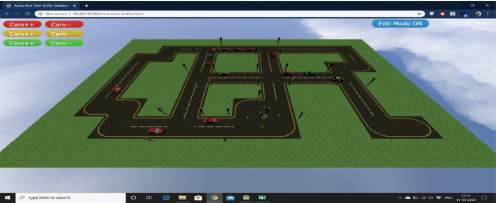
Figure 7.11 Traffic simulator 1st view.

Figure 7.12 Traffic simulator 2nd view.

Figure 7.13 Traffic simulator 3rd view.
7.5.3.2 2nd View
As shown in Figure 7.12 the simulator shows the traffic into 3 structural views, this image shows the 2nd view. The image shows the cars on road with traffic lights working hence predicting the proper movement.
7.5.3.3 3rd View
As shown in Figure 7.13 the simulator shows the traffic into 3 structural views. Road can be edited using the “edit option” hence creating our own routes and scenarios to help and create the necesarry environment.
7.6 Conclusion and Future Scope
We will enhance the model what we are using to calculate traffic in different locations and make required updates in FLY-CROW. In our case we are totally dependent on mobile phone sensors to implement IoT and cloud computing operations for better results. In the future we will include information like under construction, road break-down and other required features for user’s accessibility.
For example—There are certain scenarios when we select a particular path to travel and even the map shows no traffic on that route because there are no vehicles on that road but a blocked road maybe because of construction could sometimes become misleading while planning to reach our destination through that specific road. So as to know the road blockages due to construction, accidents or any other emergency need to be displayed on the map as well. This feature needs human involvement because when a certain amount of user reports on the application about the emergency then only this thing gets published on the internet hence making it authentic and trustworthy.
Recently due to the spread of covid-19, borders of states are sealed and a few people unknowingly were trying to pass through them so this feature could help in such cases letting people know that the route you are trying to travel through is blocked due to certain condition.
So, the app with user feedback may help in achieving the feature but needs manpower and a big database support.
References
1. Sharma, D., Singh, S., and Mittal, M., Models in Grid Computing: A Review. Recent Pat. Eng., 13, 2, 94–100, 2019.
2. Sharma, D., Singh, S., Mudgil, S., An Approach to find Trustworthiness among Different Domains in a Grid Environment. Int. J. Adv. Res. Comput. Sci., 1, 4, 474–482, 2010.
3. Mudgil, S., Singh, S., Sharma, D., An Access Control Framework for Grid Environment. Indian J. Comput. Sci. Eng. (IJCSE), 2, 6, 937–948, 2010.
4. Garg, R., Mittal, M., Son, L.H., Reliability and Energy Efficient Workflow Scheduling in Cloud Environment. Cluster Comput., 22, 1283–1297, 2019.
5. https://cloud.google.com/docs/tutorials.
6. Kumarage, S., Use of Crowdsourced Travel Time Data in Traffic Engineering Applications, University of Moratuwa, Sri Lanka, 2018. 10.13140/RG.2.2.16856.75521
7. https://www.sciencedirect.com/science/article/pii/S187538921200274X.
8. https://www.researchgate.net/figure/Collecting-traffic-data-from-Google-Maps_fig2_327644181.
9. https://www.tensorflow.org/learn.
10. Nagy, A.M. and Simon, V., Survey on traffic prediction in smart cities. Pervasive Mob. Comput., 50, pp. 148–163, 2018.
11. Lamb, Z.W. and Agrawal, D.P., Analysis of Mobile Edge Computing for Vehicular Networks. Sensors, 19, 6, 1303, 2019. https://doi.org/10.3390/s19061303
12. https://www.ptvgroup.com/en/solutions/products/ptv-vissim/.
13. https://www.caliper.com/transmodeler/default.htm.
14. https://developer.rackspace.com/blog/introduction-to-the-google-distance-matrix-api/.
15. https://www.javatpoint.com/aws-tutorial.
16. https://en.wikipedia.org/wiki/Aimsun_Live.
17. https://www.w3schools.com/graphics/google_maps_intro.asp.
- *Corresponding author: [email protected]