
C. Quick-Start: Android Device Monitor
The Android Device Monitor is a debugging tool provided with the Android SDK. Developers use Device Monitor to provide a window into the emulator or the actual device for debugging purposes as well as for file and process management. It’s a blend of several tools: a task manager, a profiler, a file explorer, an emulator console, and a logging console. This Quick-Start is not a complete documentation of Device Monitor functionality. Instead, it is designed to get you up and running with common tasks. See the Device Monitor documentation provided with the Android SDK for a complete list of features.
Using Device Monitor with Android Studio and as a Stand-Alone Application
If you use Android Studio, the Device Monitor tool is integrated with your development environment. You are able to launch Device Monitor by clicking the Android icon (![]() ) found on the toolbar. By using
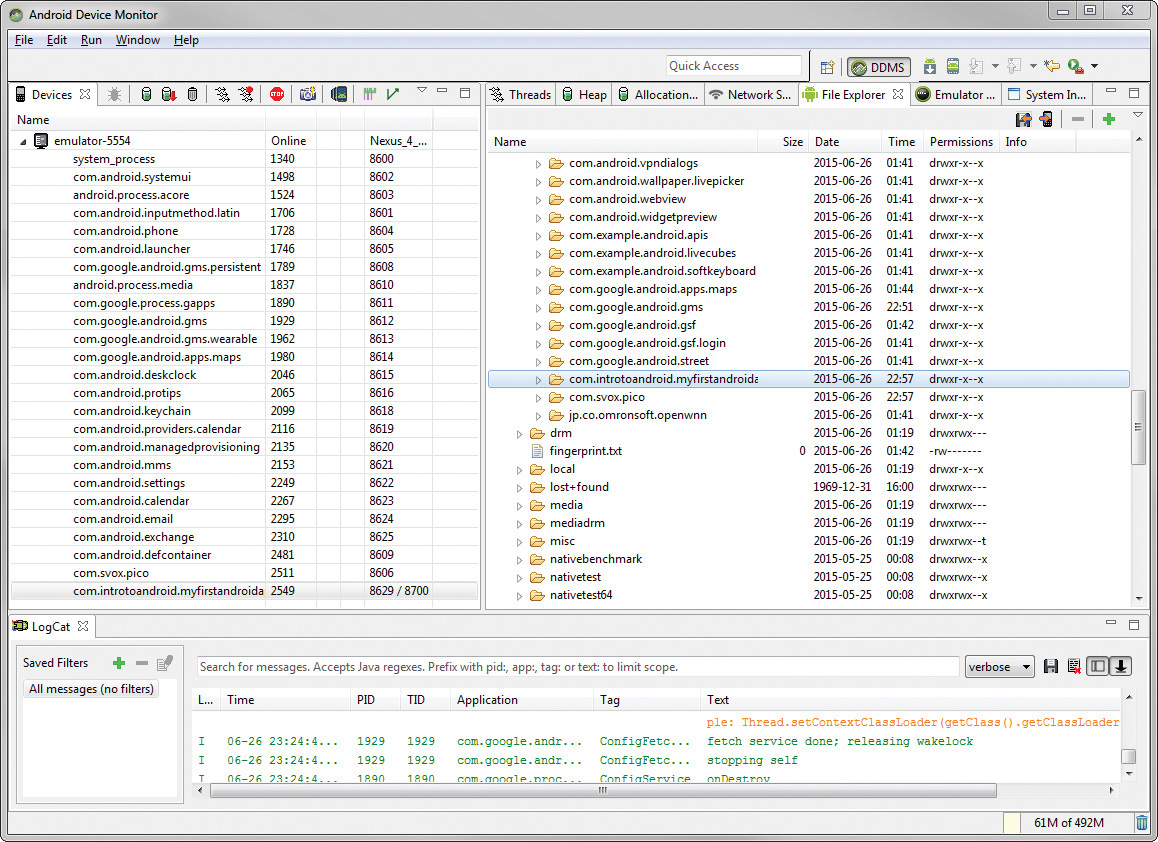
) found on the toolbar. By using Device Monitor integrated with Android Studio (shown in Figure C.1, using the File Explorer to browse files on the emulator instance), you can explore any emulator instances running on the development machine and any Android devices connected via USB.
If you’re not using Android Studio, the Device Monitor tool is also available within the tools/ directory of the Android SDK, and you can launch it as a separate application by running the monitor command, in which case it runs in its own process.
![]() Tip
Tip
There should be only one instance of Device Monitor running at a given time. Other Device Monitor launches are ignored; if you have Device Monitor running from Android Studio and try to launch Device Monitor from the command-line, you might see question marks instead of process names, and you will see debug output stating that the instance of Device Monitor is being ignored.
Not all Device Monitor features are available for both emulators and devices. Certain features, such as the Emulator Control features, are available only for emulators. Most devices are more secure than the emulator. Thus, the File Explorer may be limited to just public areas of the device, unlike on the emulator.
Getting Up to Speed Using Key Features of Device Monitor
Whether you use Device Monitor from Android Studio or as a stand-alone tool, be aware of a few key features:
![]() The
The Devices pane displays running emulators and connected devices in the top-left corner.
![]() The set of
The set of Threads, Heap, Allocation Tracker, Network Statistics, File Explorer, and System Information tabs on the right side are populated with data when a specific process on an emulator or device is highlighted in the Devices pane.
![]() The
The Emulator Control pane provides features such as the ability to send GPS information and to simulate incoming calls and SMS messages to emulators.
![]() The
The LogCat window enables you to monitor the output of the Android logging console for a given device or emulator. This is where calls to Log.i(), Log.e(), and other log messages display.
Now let’s look at how to use each of these Device Monitor features in more detail.
![]() Tip
Tip
Device Monitor has another viewing perspective that provides direct access to the Hierarchy Viewer tool, which can be used for debugging and performance-tuning your application’s user interface. You can open this perspective by choosing Window, Open Perspective.... See Appendix D, “Mastery: Android SDK Tools,” for more details about this tool.
Working with Processes, Threads, and the Heap
One of the most useful features of Device Monitor is the ability to interact with processes. Each Android application runs in its own VM with its own user ID on the operating system. Using the Devices pane of Device Monitor, you can browse all instances of the VM running on a device, each identified by its package name. For example, you can perform the following tasks:
![]() Attach and debug applications
Attach and debug applications
![]() Monitor threads
Monitor threads
![]() Monitor the heap
Monitor the heap
![]() Stop processes
Stop processes
![]() Force garbage collection (GC)
Force garbage collection (GC)
Attaching a Debugger to an Android Application
Although you’ll use Android Studio debug configurations to launch and debug your applications most of the time, you can also use Device Monitor to choose which application to debug and attach directly. To attach a debugger to a process, you need to have the package source code open in your Android Studio workspace. Now perform the following steps to debug:
1. On the emulator or device, verify that the application you want to debug is running.
2. In Device Monitor, find that application’s package name in the Devices pane and highlight it.
3. Click the little green bug button (![]() ) to debug that application.
) to debug that application.
4. Switch to the Debug perspective of the Android Studio as necessary; debug as you would normally.
Stopping a Process
You can use Device Monitor to kill an Android application by following these steps:
1. On the emulator or device, verify that the application you want to stop is running.
2. In Device Monitor, find that application’s package name in the Devices pane and highlight it.
3. Click the red stop sign button (![]() ) to stop that process.
) to stop that process.
Monitoring Thread Activity of an Android Application
You can use Device Monitor to monitor thread activity of an individual Android application by following these steps:
1. On the emulator or device, verify that the application you want to monitor is running.
2. In Device Monitor, find that application’s package name in the Devices pane and highlight it.
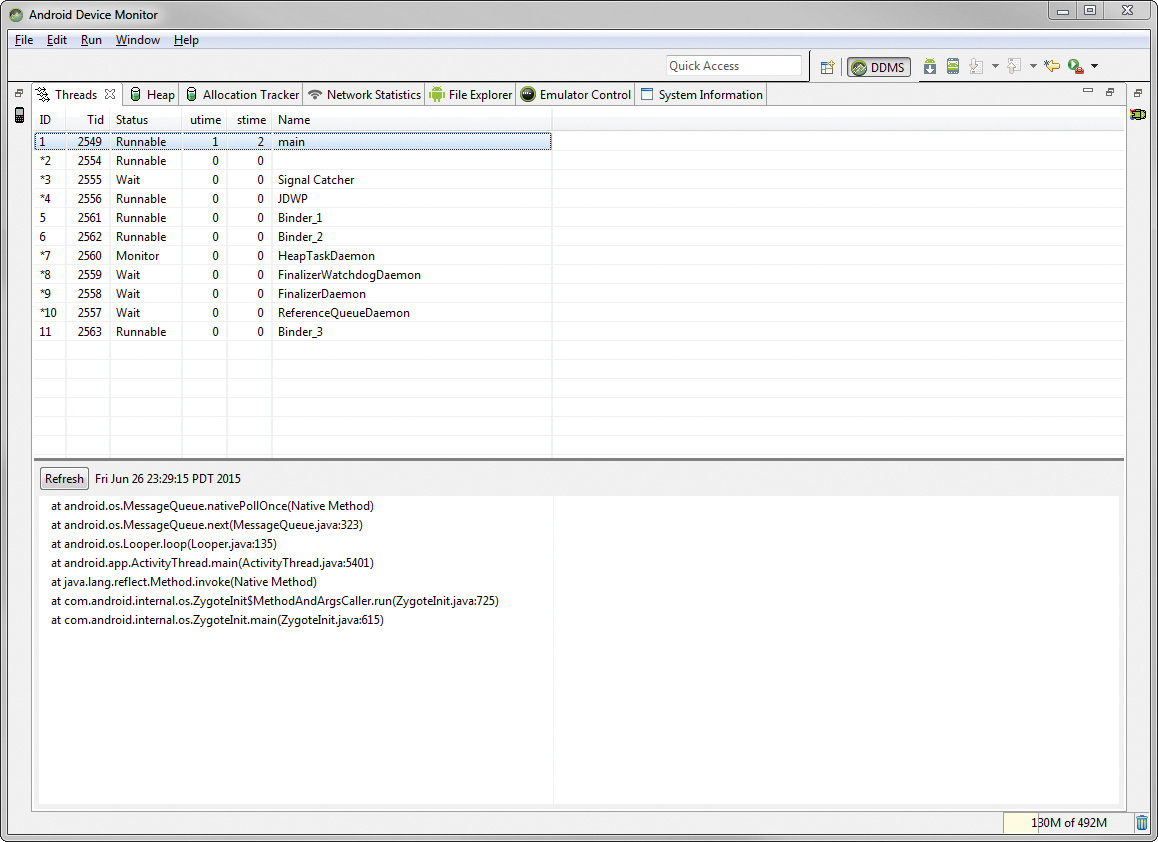
3. Click the button with three black arrows (![]() ) to display the threads of that application. They appear in the right portion of the
) to display the threads of that application. They appear in the right portion of the Threads pane.
4. On the Threads pane, you can choose a specific thread and click the Refresh button to drill down within that thread. The resulting classes in use display below.
![]() Note
Note
You can also start thread profiling using the button with three black arrows and a red dot (![]() ).
).
For example, in Figure C.2, we see the Threads pane contents for the package named com.introtoandroid.myfirstandroidapp running on the emulator.
Monitoring Heap Activity
You can use Device Monitor to monitor the heap statistics of an individual Android application. The heap statistics are updated after every garbage collection (GC) via these steps:
1. On the emulator or device, verify that the application you want to monitor is running.
2. In Device Monitor, find that application’s package name in the Devices pane and highlight it.
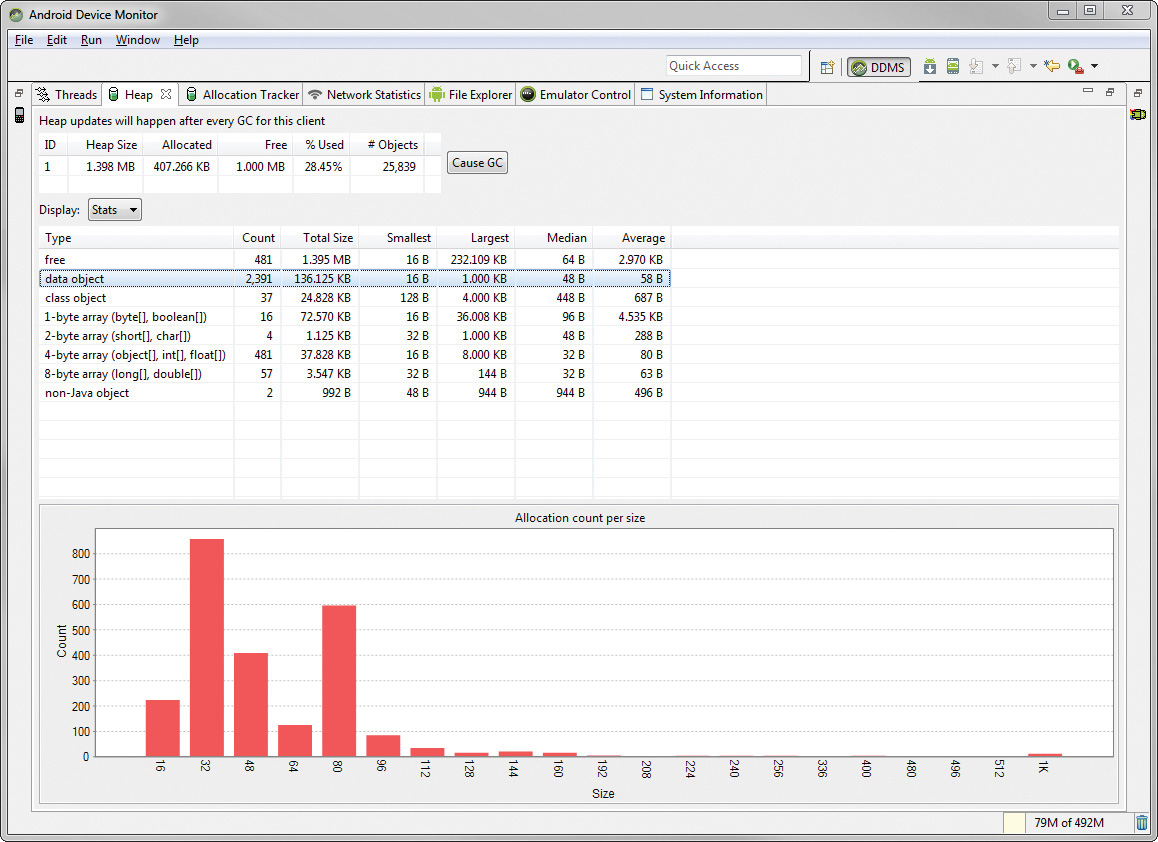
3. Click the green cylinder button (![]() ) to display the heap information for that application. The statistics appear in the
) to display the heap information for that application. The statistics appear in the Heap pane. This data updates after every GC. You can also cause GC operations from the Heap pane using the button Cause GC.
4. On the Heap pane, you can choose a specific type of object. The resulting graph in use displays at the bottom of the Heap pane, as shown in Figure C.3.
![]() Tip
Tip
When using the Allocation Tracker and Heap monitor, keep in mind that not all the memory your app uses will be accounted for in this view. This tool shows the allocations within the Dalvik VM. Some calls allocate memory on the native heap. For example, many image manipulation calls in the SDK will result in memory allocated natively and will not show up in this view.
Prompting Garbage Collection
You can use Device Monitor to force GC to run by following these steps:
1. On the emulator or device, verify that the application you want to run GC for is running.
2. In Device Monitor, find that application’s package name in the Devices pane and highlight it.
3. Click the garbage can button (![]() ) to cause GC to run for the application. The results can be viewed in the
) to cause GC to run for the application. The results can be viewed in the Heap pane.
Creating and Using an HPROF File
HPROF files can be used to inspect the heap and for profiling and performance purposes. You can use Device Monitor to create an HPROF file for your application by following these steps:
1. On the emulator or device, verify that the application you want the HPROF data for is running.
2. In Device Monitor, find that application’s package name in the Devices pane and highlight it.
3. Click the HPROF button (![]() ) to create an
) to create an HPROF dump to be generated for the application. The files will be generated in the captures/ directory, which is located inside the root directory of your application.
Once you have Android-generated HPROF data, you can convert it to a standard HPROF file format using the Android SDK tool called hprof-conv. You can use whichever profiling tool you prefer to examine the information.
For example, in Figure C.4, you can see the converted HPROF dump response in the stand-alone tool called Memory Analyzer (mat).
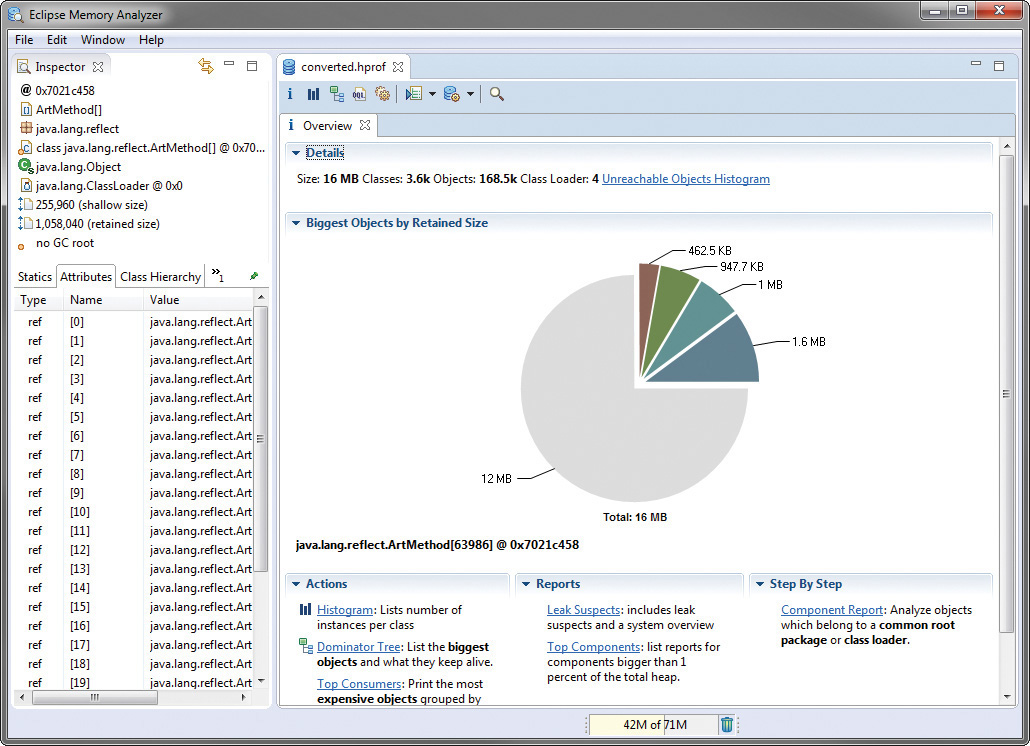
Figure C.4 Using the Memory Analyzer stand-alone tool to inspect converted HPROF profiling information.
![]() Note
Note
You can generate HPROF files in Android using several other methods. For example, you can do it programmatically using the Debug class. The monkey tool also has options for generating HPROF files as it runs. You can also generate HPROF files using Android Studio.
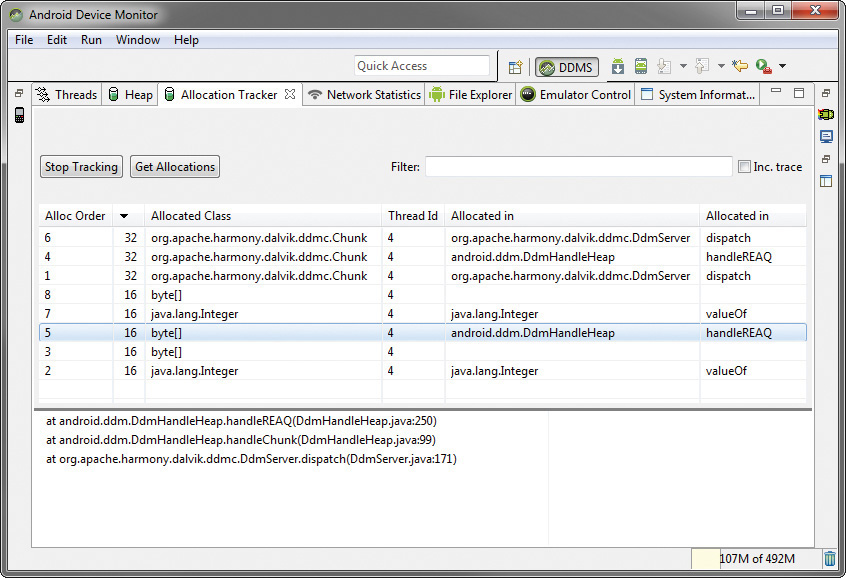
Using the Allocation Tracker
You can use Device Monitor to monitor memory allocated by a specific Android application. The memory allocation statistics are updated on demand by the developer. Follow these steps to track memory allocations:
1. On the emulator or device, verify that the application you want to monitor is running.
2. In Device Monitor, find that application’s package name in the Devices pane and highlight it.
3. Switch to the Allocation Tracker pane on the right pane.
4. Click the Start Tracking button to start tracking memory allocations and the Get Allocations button to get the allocations at a given time.
5. To stop tracking allocations, click the Stop Tracking button.
For example, in Figure C.5, we see the Allocation Tracker pane contents for an application running on the emulator.
The Android documentation has a brief tutorial on how to capture a heap dump with Device Monitor, including instructions on how to view the heap dump using the Memory Analyzer tool here: http://d.android.com/tools/debugging/debugging-memory.html#HeapDump. In addition, the Android developer website has a write-up on memory analysis at http://android-developers.blogspot.com/2011/03/memory-analysis-for-android.html.
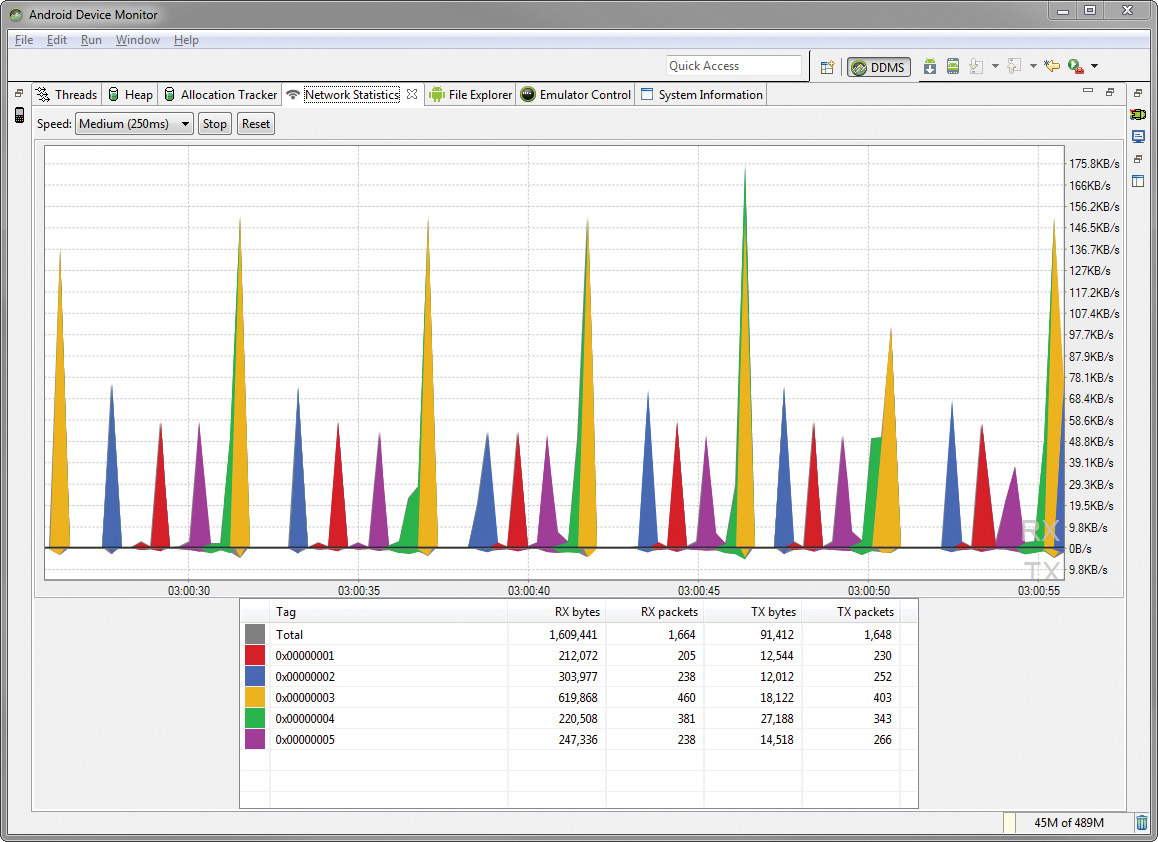
Viewing Network Statistics
You can use Device Monitor to analyze the network usage of your applications. This tool is useful for providing information about when your application performs network data transfers. The Android class TrafficStats is used to add network statistics analysis code to your application. To distinguish among different types of data transfers in your application, you simply apply a TrafficStats tag in your code before executing the transfer. Knowing network statistics should help you make better decisions about how to optimize your network data transfer code. In Figure C.6, we see the Network Statistics pane contents for a hardware device.
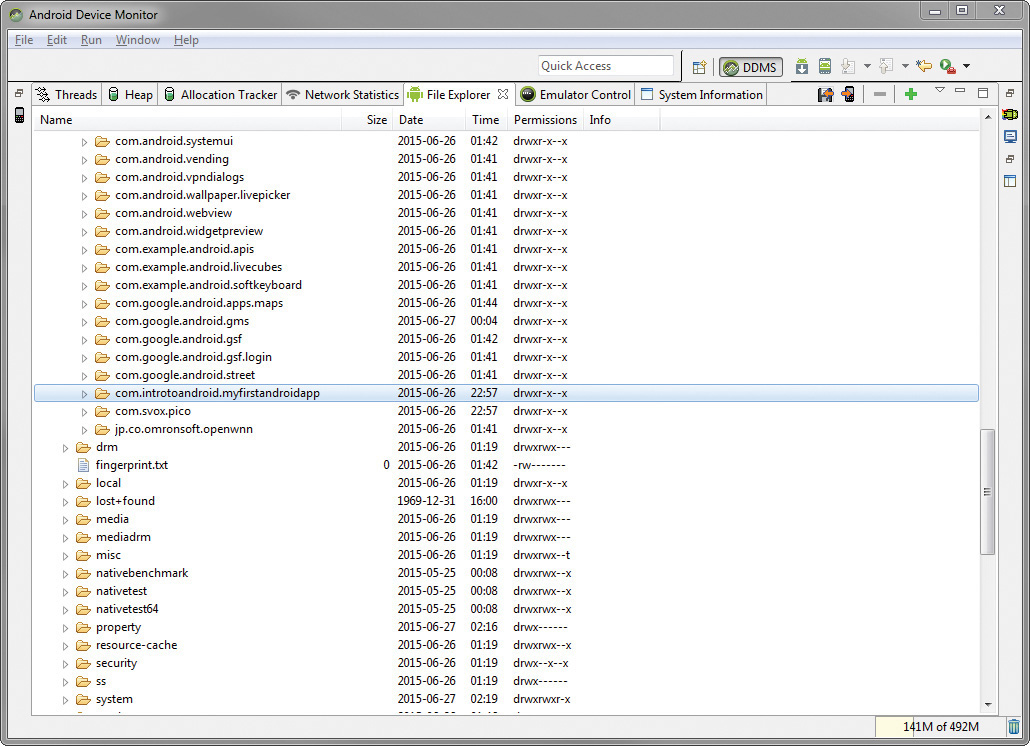
Working with the File Explorer
You can use Device Monitor to browse and interact with the Android file system on an emulator or device (although it’s somewhat limited on devices without root access). You can access application files, directories, and databases, as well as pull and push files to the Android system, provided you have the appropriate permissions.
For example, in Figure C.7, we see the File Explorer pane contents for the emulator.
Browsing the File System of an Emulator or Device
To browse the Android file system, follow these steps:
1. In Device Monitor, choose the emulator or device you want to browse in the Devices pane.
2. Switch to the File Explorer pane. You see a directory hierarchy.
3. Browse to a directory or file location.
Table C.1 shows some important areas of the Android file system. Although the exact directories may vary from device to device, the directories listed are the most common.
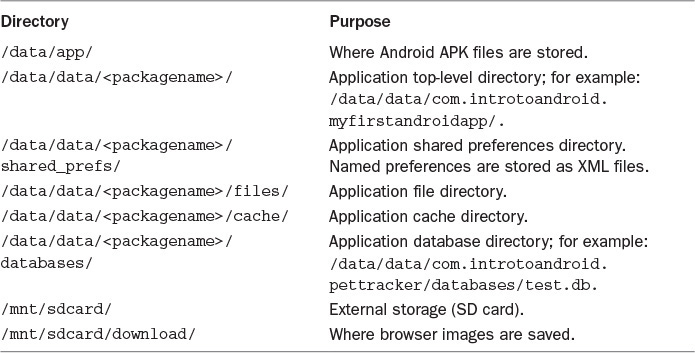
Keep in mind that directory listings in the File Explorer might take a moment to update when contents change.
![]() Note
Note
Some device directories, such as the /data directory, might not be accessible from the Device Monitor File Explorer.
Copying Files from the Emulator or Device
You can use the File Explorer to copy files or directories from an emulator or a device file system to your computer by following these steps:
1. Using the File Explorer, browse to the file or directory to copy and highlight it.
2. From the top-right corner of the File Explorer, click the disk button with the arrow (![]() ) to pull the file from the device. Alternatively, you can pull down the drop-down menu next to the buttons and choose
) to pull the file from the device. Alternatively, you can pull down the drop-down menu next to the buttons and choose Pull File.
3. Type in the path where you want to save the file or directory on your computer and click Save.
Copying Files to the Emulator or Device
You can use the File Explorer to copy files to an emulator or a device file system from your computer by following these steps:
1. Using the File Explorer, browse to the file or directory to copy and highlight it.
2. From the top-right corner of the File Explorer, click the phone button with the arrow (![]() ) to push a file to the device. Alternatively, you can pull down the drop-down menu next to the buttons and choose
) to push a file to the device. Alternatively, you can pull down the drop-down menu next to the buttons and choose Push File.
3. Select the file or directory on your computer and click Open.
![]() Tip
Tip
The File Explorer also supports some drag-and-drop operations. This is the only way to push directories to the Android file system; however, copying directories to the Android file system is not recommended because there’s no delete option for them. You need to delete directories programmatically if you have the permissions to do so. Alternatively, the adb shell can be used with rmdir, but you still need permissions. That said, you can drag a file or directory from your computer to the File Explorer and drop it in the location you want.
Deleting Files on the Emulator or Device
You can use the File Explorer to delete files (one at a time, and not directories) on the emulator or device file system. Follow these steps:
1. Using the File Explorer, browse to the file you want to delete and highlight it.
2. In the top-right corner of the File Explorer, click the red minus button (![]() ) to delete the file.
) to delete the file.
Be careful. There is no confirmation. The file is deleted immediately and is not recoverable.
Working with the Emulator Control
You can use Device Monitor to interact with instances of the emulator using the Emulator Control pane. You must select the emulator you want to interact with for the Emulator Control pane to work. You can use the Emulator Control pane to do the following:
![]() Change telephony status
Change telephony status
![]() Simulate incoming voice calls
Simulate incoming voice calls
![]() Simulate incoming SMS messages
Simulate incoming SMS messages
![]() Send a location fix (GPS coordinates)
Send a location fix (GPS coordinates)
Changing Telephony Status
To simulate changing the telephony status using the Emulator Control pane (shown in Figure C.8), use the following steps:
1. In Device Monitor, choose the emulator whose telephony status you want to change.
2. Switch to the Emulator Control pane. You work with the Telephony Status.
3. Select the desired options from Voice, Speed, Data, and Latency.
4. For example, when changing the Data option from Home to Roaming, you should see a notification in the status bar that the device is now in roaming mode.
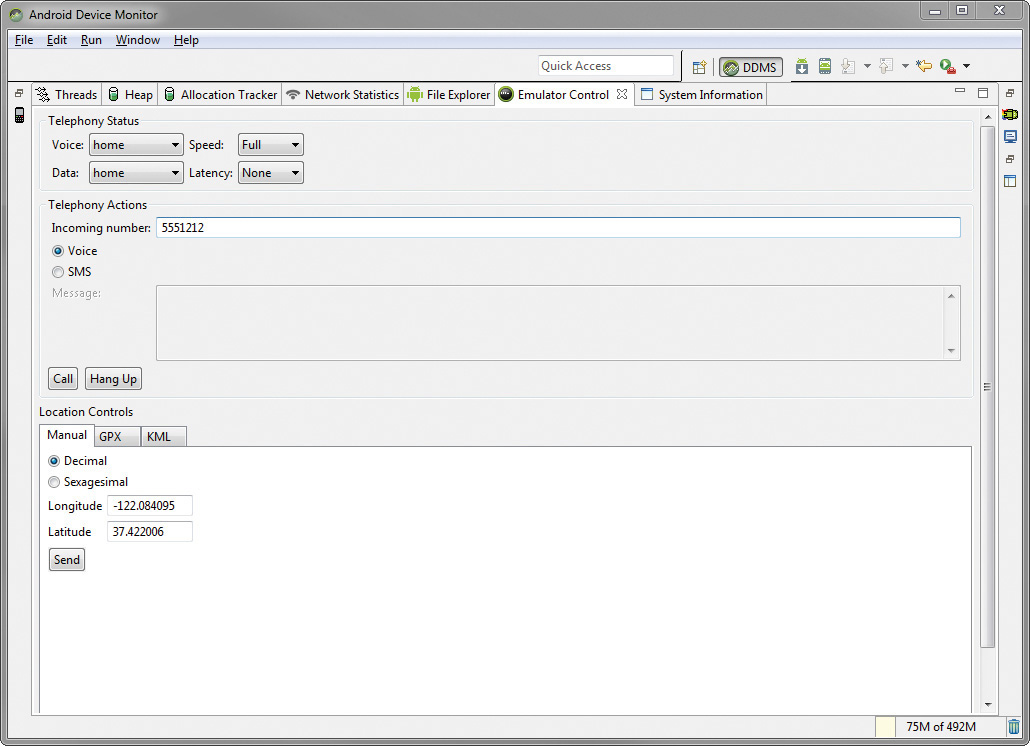
Simulating Incoming Voice Calls
To simulate an incoming voice call using the Emulator Control pane (shown in Figure C.8), use the following steps:
1. In Device Monitor, choose the emulator you want to call in the Devices pane.
2. Switch to the Emulator Control pane. You work with the Telephony Actions.
3. Input the incoming phone number. This can include only numbers, +, and #.
4. Select the Voice radio button.
5. Click the Send button.
6. In the emulator, your phone is ringing. Answer the call.
7. The emulator can end the call as normal, or you can end the call in Device Monitor using the Hang Up button.
Simulating Incoming SMS Messages
Device Monitor provides the most stable method for sending incoming SMS messages to the emulator. You send an SMS much as you initiated the voice call. To simulate an incoming SMS message using the Emulator Control pane (shown in Figure C.8, top), use the following steps:
1. In Device Monitor, choose the emulator you want to send a message to in the Devices pane.
2. Switch to the Emulator Control pane. You work with the Telephony Actions.
3. Input the incoming phone number. This may include only numbers, +, and #.
4. Select the SMS radio button.
5. Type in your SMS message.
6. Click the Send button.
7. Over in the emulator, you receive an SMS notification.
Sending a Location Fix
The steps for sending GPS coordinates to the emulator are covered in Appendix B, “Quick-Start: Android Emulator.” Simply input the GPS information into the Emulator Control pane (shown in Figure C.8, bottom), click Send, and use the Maps application on the emulator to get the current position.
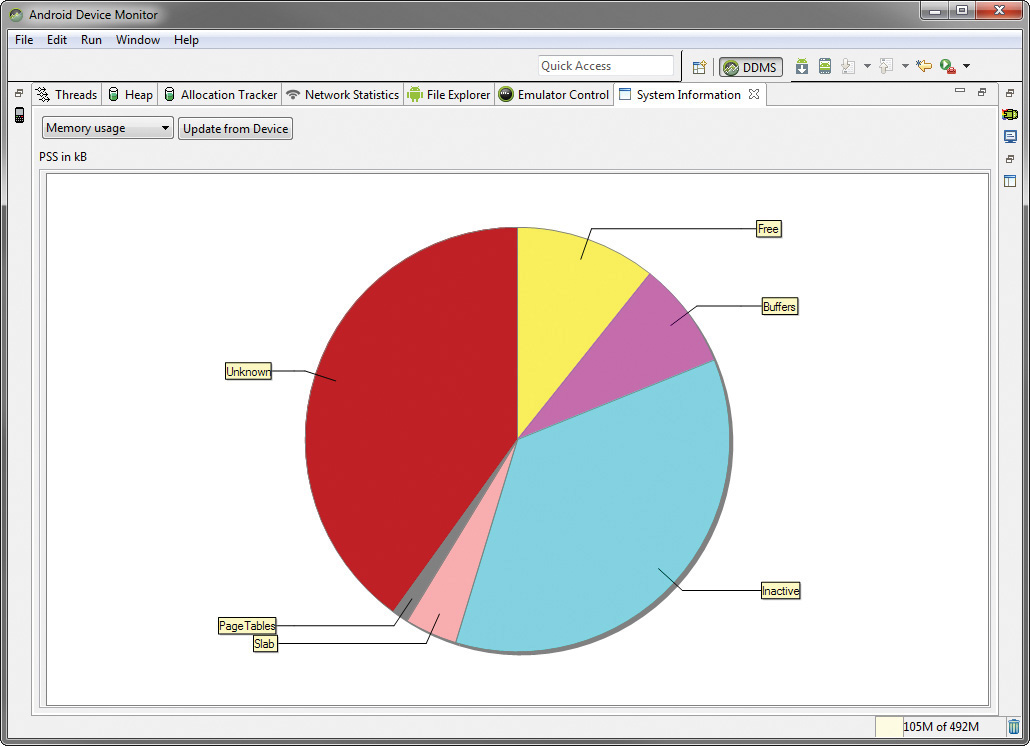
Working with the System Information Pane
You can use Device Monitor to analyze the system information of instances of the emulator using the System Information pane. You must select the emulator you want to analyze for the System Information pane to work. You can use the System Information pane as shown here:
1. In Device Monitor, choose the emulator or device you want to analyze.
2. Switch to the System Information pane.
3. Select from the drop-down the type of System Information you are interested in analyzing.
4. If the screen is blank, you may need to click the Update from Device button.
5. You should now see a chart displaying the System Information, as shown in Figure C.9.
Taking Screen Captures of the Emulator and Device Screens
You can take screen captures of the emulator and the device from Device Monitor. The device captures are most useful for debugging, and this makes the Device Monitor tool appropriate for quality assurance personnel and developers. To capture a screenshot, take the following steps:
1. In Device Monitor, choose the emulator or device you want to capture in the Devices pane.
2. On the device or emulator, make sure you have the screen you want to capture.
3. Click the multicolored square picture button (![]() ) to take a screen capture. A capture window launches, as shown in Figure C.10.
) to take a screen capture. A capture window launches, as shown in Figure C.10.
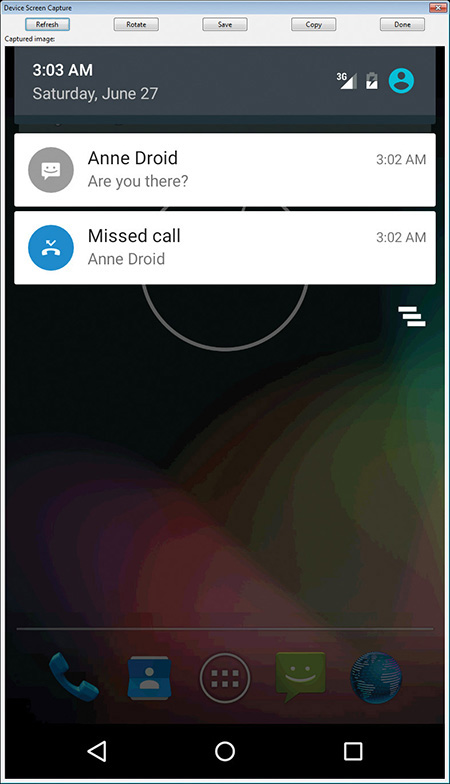
4. Within the capture window, click the Save button to save the screen capture. Similarly, the Copy button stores the screenshot in your clipboard, the Refresh button updates the screenshot if the underlying device or emulator screen has changed since you launched the capture window, and the Rotate button rotates the screenshot 90 degrees.
Working with Application Logging
The LogCat tool is integrated into Device Monitor. It is provided as a pane along the bottom of the Device Monitor user interface. You can control how much information displays by choosing an option from the log type filter drop-down. The default option is verbose (show everything). The other options correspond to debug, info, warn, error, and assert. When selected, only log entries for that level of severity and worse will display. You can filter the LogCat results to show just search results by using the search entry field, which fully supports regular expressions. Search terms can be limited in scope with prefixes, such as text:, to limit the following term to just the log message text.
You can also create saved filters to display only the LogCat information associated with particular attributes. You can use the plus (+) button to add a saved filter and show only log entries matching a tag, message, process ID, name, or log level. The strings for each attribute filter can also be Java-style regular expressions.
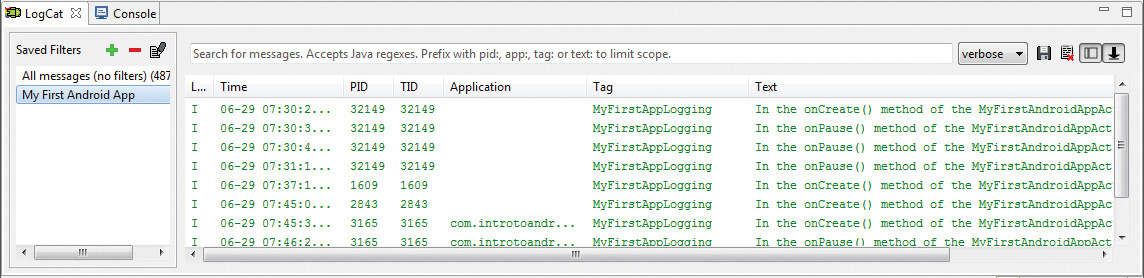
For example, suppose your application does this:
public static final String DEBUG_TAG = "MyFirstAppLogging";
Log.i(DEBUG_TAG,
"In the onCreate() method of the MyFirstAndroidAppActivity Class.");
You can create a LogCat filter using the plus button (![]() ). Name the filter and set the log tag to the string matching your debug tag:
). Name the filter and set the log tag to the string matching your debug tag:
MyFirstAppLogging
The LogCat pane with the resulting filters is shown in Figure C.11.
Summary
In this appendix, you have learned many valuable features that Device Monitor provides. Device Monitor can be launched from within Android Studio or from the command-line. You learned that Device Monitor provides tools for monitoring your application’s performance while running on an emulator or a device. You also learned that Device Monitor allows you to interact directly with the file system of an emulator or a device. You should also feel comfortable interacting with an emulator or device, performing actions such as phone calls, SMS, taking screenshots, or even logging application data.
Quiz Questions
1. What is the name of the Android SDK directory where the command-line monitor application resides?
2. True or false: The Device Monitor tab for sending GPS coordinates to a device or emulator is called the Emulator Control tab.
3. Name some of the tasks that you can perform with the Threads and Heap tabs.
4. What is the name of the class used for adding network statistics analysis code to your application?
5. True or false: The LogCat tool is not part of Device Monitor.
Exercises
1. Launch a sample application, on either an emulator or a device, and practice analyzing the application using the various Device Monitor tabs.
2. Practice interacting with an emulator or device by sending calls, SMS messages, and GPS coordinates, and then take screen captures of each interaction using Device Monitor.
3. Practice adding log statements to a sample application, and then use LogCat to view the logging information.
References and More Information
Android Tools: “Device Monitor”:
http://d.android.com/tools/help/monitor.html
Android Tools: “HPROF Converter”:
http://d.android.com/tools/help/hprof-conv.html
Android Reference: “TrafficStats”:
http://d.android.com/reference/android/net/TrafficStats.html
Android Tools: “Reading and Writing Logs”:
http://d.android.com/tools/debugging/debugging-log.html
Android Reference: “Log”: