
Chapter Four
Transportation Infrastructure
Chapter Outline
Learning Objectives
After reading this chapter, you should be able to:
- List the main sectors and subsectors of the transportation infrastructure.
- Explain the function of each transportation sector.
- Identify transportation infrastructure components.
- Explain the function of transportation components.
- List some of the most important design parameters for transportation components.
- Describe some of the fundamental relationships between transportation and other infrastructure sectors, subsectors, and components.
Introduction
Transportation systems and components allow the movement of people and goods. Nearly 12billion tons of goods are transported domestically while an additional 2billion tons are traded to and from the United States annually. Designing, building, and maintaining transportation systems have a significant effect on the economic activity of the United States. Clearly, a strong economy is reliant on efficient and effective transportation systems.
Relationship Between Transportation Spending and Economic Stability
An Ohio Department of Transportation sign reflects the importance of transportation systems to the economy.
Roads (ASCE 2009 Grade: D-)
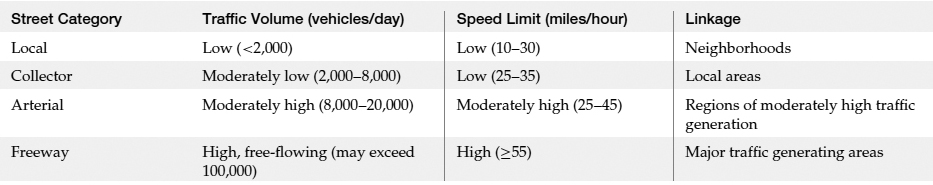
The road subsector includes streets, alleys, and service roads. Streets may be further subdivided into four categories as summarized in Table 4.1.
The planning and design of streets takes into account the following design parameters (Kutz, 2003):
- Traffic volume—Higher traffic volume (i.e., number of vehicles per hour) requires more lanes in order to provide a higher level of service.
Level of service, or LOS, is a qualitative measure of the roadway's operating conditions and the perception of those conditions by motorists and/or passengers. It will be discussed in further detail in Chapter 20.
- Range of driver types—Drivers vary in their ability to see, hear, read, comprehend, and react to stimulus (e.g., consider designing a road for a retirement community).
- Vehicle type—Vehicles vary in terms of size (height, width, length, and weight) and ability to accelerate, brake, turn, and climb hills.
- Design speed—Designers must select a design speed based on intended use, desired traffic volume, adjacent land use, and other factors. For example, the design speed for freeways is 70 miles per hour (mph). Selection of the design speed has a significant impact on safety and comfort.
Design speed is the maximum safe speed that an automobile can operate on a roadway in perfect conditions.
- Sight distance—Road designers must consider the stopping sight distance, such that drivers operating vehicles at the design speed are able to stop the vehicle in a controlled manner if an obstacle is blocking the lane of travel. Road designers should also consider passing sight distance, whereby drivers are able to see far enough into the distance to safely pass.
Sight distance is the length of road in front of the vehicle that is visible to the driver.
- Topography—Topography affects many aspects of street design, including the geometry and design speed as well as sight distances.
- Land use characteristics—The type of land use (e.g., commercial, residential) will determine the number of vehicles using the roadway.
- Critical need of use—local streets might be allowed to periodically flood, whereas freeways are not; local streets are lowest priority for snow removal.
The design of streets includes the cross-section design, profile design, and plan design.
Cross-section refers to a vertical slice taken of a street, perpendicular to the line of travel.
Table 4.1 Street Categories Based on Traffic Volume, Speed Limit and Linkage
The cross-section details the width and side slopes of the street. Streets are often crowned; that is, they are constructed with a side slope, typically 2 percent (2inches per 100inches), to prevent the accumulation of water and ice. A cross-section includes driving lanes as well as shoulders, curbs, medians, and ditches.
- Shoulders allow drivers to regain control once leaving the pavement, provide a space for emergency parking, and provide structural support for the edge of the pavement.
- Curbs, often formed of concrete, keep vehicles off lawns, and in conjunction with a gutter, provide a conveyance channel for stormwater.
- Medians provide separation between opposing lanes of traffic, thereby reducing the probability of deadly head-on collisions. Also, in cold climates, medians provide space for snow storage.
- Ditches convey stormwater, and unlike impervious curbs and gutters, allow for some infiltration and treatment of stormwater.
A sample cross-section for a freeway with center median is provided in Figure 4.1. Elevation is plotted on the vertical axis, while the horizontal axis provides distances to the left or right (in feet) from the centerline of the cross-section. The existing ground is drawn with a dashed line, and you can readily see how the proposed cross-section will require excavation. For this example cross-section, construction of the roadway will require that soil is removed, or cut, from the right side and an embankment will need to be graded such that the road side slope matches in with the existing ground. During the design phase, cross-sections such as these are created at every 100-foot station (i.e., at stations 0+00, 1+00, 2+00, and so on) and at every change in cross-section design (e.g., entrance/exit ramps or a change in the number of traffic lanes).
Stationing
Stationing is a system of measurement used for road layout and construction. An arbitrary starting point is designated at the start of the roadway project, and all distances along the roadway centerline are measured from that point. Stations are expressed in the form “a+b,” where “a” represents the number of 100-foot stations you are from the beginning station and “b” represents the number of feet beyond station “a.” For example, station 31+66 is 3,166 feet from the beginning station. In conjunction with offsets, which are distances measured perpendicular to the centerline, precise locations can be described.
Roadway designers also need to consider the materials to be used in the pavement structure. The pavement is typically concrete or asphalt. Concrete pavements are termed rigid pavements while asphalt pavements are termed flexible pavements. Pavements are supported by a granular material base that transfers traffic loads to the native material (termed subgrade) and provides water drainage.
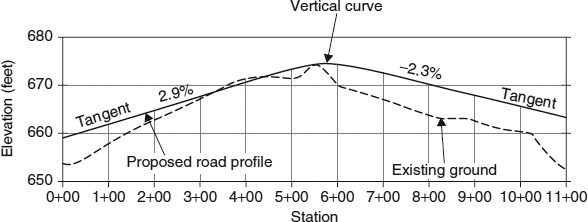
The vertical alignment, or profile view, is a “side view” of the roadway along a planar vertical surface running along the roadway centerline. The term “profile” is similarly used in the design of other infrastructure components (e.g., storm sewers, water mains, retaining walls). When designing the vertical alignment, designers define the grades (uphill or downhill slopes) of the roadway, in essence setting the steepness (or “gentleness”) of the roadway. Moreover, the vertical alignment must provide transitions between grades using vertical curves. The proposed road profile in Figure 4.2 consists of two approaching grades, or tangents, and a vertical curve that transitions between the two tangents. Note that for this section of roadway, a large amount of fill material will be needed as nearly the entire proposed roadway is above the existing ground, by nearly 10 feet at station 11+00 (1,100 feet from the beginning of the profile). A small amount of excavation (cut) will be required where the existing land surface is above the design elevation in the vicinity of station 4+00.

Figure 4.1 Roadway Cross-Section with Offsets.
Figure 4.2 Profile View of the Vertical Alignment of a Roadway.
The horizontal alignment, or plan view, is the “bird's-eye” view of the roadway. The term “plan view” is also applied to virtually all infrastructure component designs. The horizontal alignment, like the vertical alignment, is a two-dimensional view of the roadway. At its simplest, a horizontal alignment consists of a series of straight lines (also called tangents), with horizontal curves providing the transition between the tangents. Two tangents and two horizontal curves are depicted in Figure 4.3. Note that the use of stationing allows you to compare the plan and profile view, as stationing is consistent between Figure 4.2 and Figure 4.3. This figure also denotes the right of way.
The right of way is the limits of the land which the public owner of the road may use for locating utilities.
Figure 4.3 Plan View of the Horizontal Alignment of a Roadway Curve.
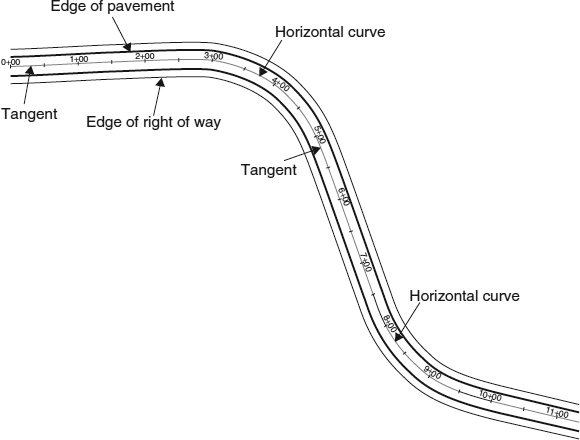
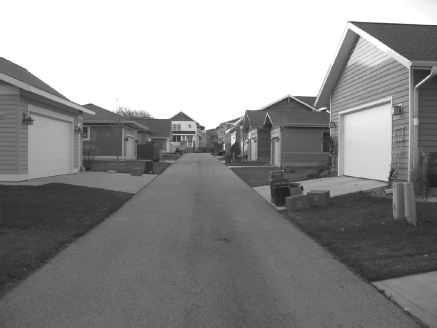
Figure 4.4 Modern Alley. This alley services the garages that are in the back yards of residences and allows for trash and recycling pickup to occur at the back of the homes.
Source: Courtesy of K. Neundorf.
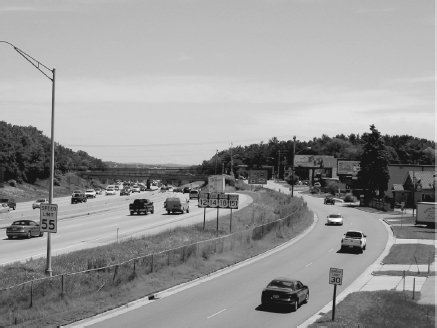
Figure 4.5 A Service (Frontage) Road Serving Businesses Adjacent to a Six-Lane Highway (Left). Note the lower traffic volume on the service road.
Source: M. Penn.
Design of the horizontal curves must hold driver safety paramount. As horizontal curves become longer (i.e., as they have a larger radius), vehicles may traverse the curve at higher speeds; however, the tradeoff is the additional land required.
Design Speeds and Speed Limits
You may be interested to know that the posted speed limit is not necessarily the design speed of the roadway. Rather, the speed limit may be set 5 to 10 mph below the design speed. Doing so builds in an additional safety factor into the roadway's design. Alternatively, speed limits may be set based on speeds measured after a road is built and is in use. In such instances, speed studies are conducted on vehicles, and the speed limit is set equal to the 85th percentile speed (the speed which 15 percent of the cars are exceeding).
Alleys are low volume, single-lane roads for access behind commercial buildings or residences (Figure 4.4). They were commonly used in urban land development during the early to mid-1900s, and allowed residents a private and low-volume drive with which to access their garages while providing a place to leave garbage for collection. With larger lots and higher reliance on the automobiles, these fell out of favor but are being used in some subdivision designs today.
Service roads, or frontage roads, run parallel to major limited-access arterials or highways (especially in commercial districts) to isolate local traffic from through traffic on the higher traffic volume roadway, and to limit the number of intersections (Figure 4.5).
INTERSECTIONS AND INTERCHANGES
Intersections are nodes in a transportation system and occur when two or more road alignments intersect. Figure 4.6 is an aerial photograph in which a variety of intersections can be seen, including a highway interchange, T-intersections, four-way intersections, and even a five-way intersection. The design of intersections considers the type of vehicles using the intersection and the throughput needed (volume of traffic and the speed limit).
Figure 4.6 An Aerial View of Several Types of Intersections.
Source: U.S. Geological Survey.

Design of intersections takes into account conflict points. A typical intersection where two roads cross has 32 conflict points (see Figure 4.7 for an example of a conflict point diagram). Rear-end and sideswipe collisions are possible at the “merging and diverging” conflict points, while angle collisions can occur for “crossing” conflict points. The geometry of the intersection will affect the number of conflict points. By designing an intersection with adequate sight distances and incorporating effective traffic signals and/or signs, the severity and frequency of accidents can be minimized.
A conflict point is the point where the paths of two through or turning vehicles diverge, merge, or cross.
Figure 4.7 A Conflict Point Diagram for a Conventional Four-Way Intersection.
Source: U.S. Federal Highway Administration, 2004.

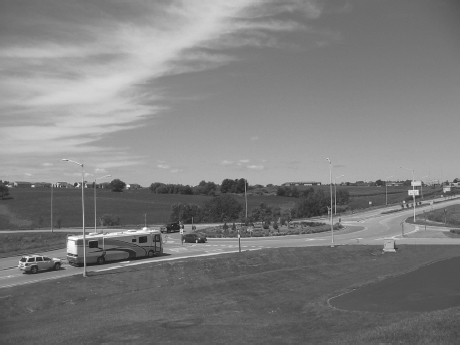
Figure 4.8 A Roundabout, an Increasingly Popular Alternative to a Traditional Four-Way Intersection.
Source: M. Penn.
Roundabouts (Figure 4.8) are increasingly popular in some parts of the country, and have only eight conflict points. Depending on the type of vehicles that will be using the roundabout and the desired travel speeds, diameters are on the order of 200 to 300 feet. As such, they can require a large parcel of land. Because of driver unfamiliarity with roundabouts, many transportation managers provide information to educate drivers and ensure successful implementation.
 Roundabout Educational Material
Intersections for freeways are termed interchanges, and you can view an interchange at the bottom of Figure 4.6. A properly designed interchange will allow for the free and safe flow of traffic. Many of the design considerations associated with non-freeway intersections also apply to freeway interchanges. An additional consideration is the length of entrance and exit ramps necessary for acceleration and deceleration.
PARKING
Parking is a major consideration in urban planning and suburban development. The location and size of parking facilities has direct impact on the convenience of users. Parking demand is reduced by mass-transit use, carpooling, and non-motorized modes of travel. Large surface lots require large land areas (approximately 20 acres for the five parking lots in Figure 4.9) and when land value is sufficiently high, it must be weighed against the design, construction, operating, and maintenance expenses of parking structures. Such structures can be free standing (Figure 4.10) or integrated into the design of a building (Figure 4.11).
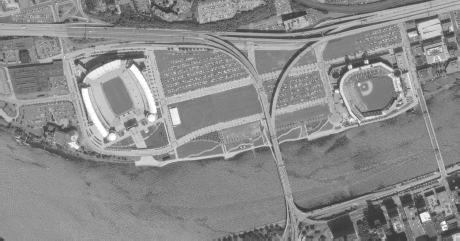
Figure 4.9 Stadiums and Adjacent Parking Lots for the Pittsburgh Steelers and Pirates Professional Sports Teams.
Source: GeoEye Satellite Image.

Creative Parking Solutions
While engineers are often stereotyped as being noncreative, this stereotype is certainly untrue of all, if not most, engineers. For example, automated parking structures are being developed around the world in a variety of configurations. One of the most famous is actually a new car “warehouse” at a Volkswagen factory and visitor's center (the Autostadt) in Germany. Two 200-feet tall glass “silos” are used to store vehicles. An automated central mechanism places and retrieves cars. Also in Germany, a luxury condominium is being developed with automated parking on the exterior of the building on balconies adjacent to the condos, dubbed the “car loft.”

Autostadt Car Towers Website
While more common in Europe and Asia, some automated parking does exist in the United States. The use of automated lifts allows for a smaller structural footprint because no traffic lanes are needed. In very high-density urban settings where land value is excessive, it is possible for such seemingly extravagant designs to be cost-competitive. Also, it is important to consider that some owners will be willing to pay added expense for the “glamour” associated with these innovative designs.
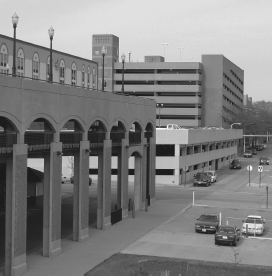
Figure 4.10 Three Adjacent Parking Structures and an Adjacent Surface Lot.
Source: M. Penn.
To design a parking lot or structure, an estimate of the number of users is needed. Like many other infrastructure projects, parking lots are often designed for peak demands. For example, parking lots serving large retail centers are often sized to hold the “Black Friday” (the Friday after Thanksgiving) crowds. This means that for much of the year, the lots are grossly oversized. Other design decisions include the type of parking stalls (angled or perpendicular), the size of those stalls (length and width), and means for the safe and efficient circulation of vehicles around the lot. In areas of high snowfall, additional space is required for the accumulation of plowed snow.
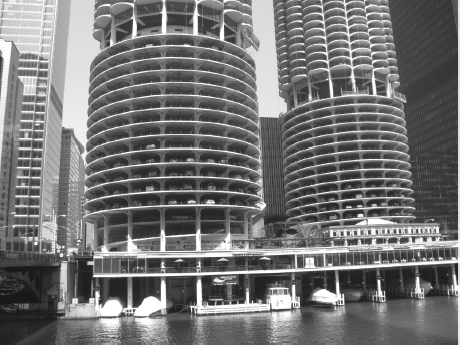
Figure 4.11 Multi-Level Parking for Cars Below Twin Residential High-Rise Towers in Chicago, Illinois. Each tower has 13 levels of parking below 40 levels of apartments. Note also the boat “parking” in the marina along the Chicago River.
Source: P. Parker.


Figure 4.12 The Dan Ryan Expressway in Chicago to the right of US Cellular Field, home of the Chicago White Sox.
Source: U.S. Geological Survey.
TRAFFIC CONGESTION RELIEF
Traffic planners can use many tools to help relieve traffic congestion. For example, bus lanes ensure uncongested bus travel, which in turn helps maintain route schedules and thereby encourages ridership.
Slugging
The benefits associated with HOV lanes has led to the development of a unique solution, known as casual carpooling or slugging, (also known as “dynamic ridesharing'') in Washington, DC and other metropolitan areas, whereby if professionals hitchhike. Car commuters will “pick up” slugs (hitchhikers), often total strangers, in order to meet the two or three passenger minimum requirement to drive in the HOV lanes and substantially decrease commuting times. Slugging has evolved over the last few decades into a highly organized, citizen-run activity with its own rules of etiquette.

HOV lanes (also referred to as carpool lanes) are used in many metropolitan areas to promote carpooling (thus reducing congestion). Driving in a carpool lane in a single occupied vehicle is a traffic offense subject to fines of several hundred dollars.
Automated tolls are rapidly replacing traditional toll booths; traditional toll booths require all vehicles to stop and pay tolls. In contrast, pre-paid accounts and signal transponders placed on front windshields or dashboards allow vehicles to proceed (often at highway speeds) through automatic toll zones, significantly reducing congestion. Drivers that are not subscribed to the local automatic toll service quickly realize the benefits when waiting in long lines of stopped vehicles in adjacent manual pay lanes.
Express lanes are used on freeways to limit congestion from entrance and exit traffic. For example, the Dan Ryan Expressway (Interstate 90/94, Figure 4.12) in Chicago has seven lanes in each direction. Four center lanes are “express” with limited interchanges to the local lanes. Three outer lanes are “local” with frequent entrance and exit ramps to arterials.
Mass Transit (ASCE 2009 Grade: D)
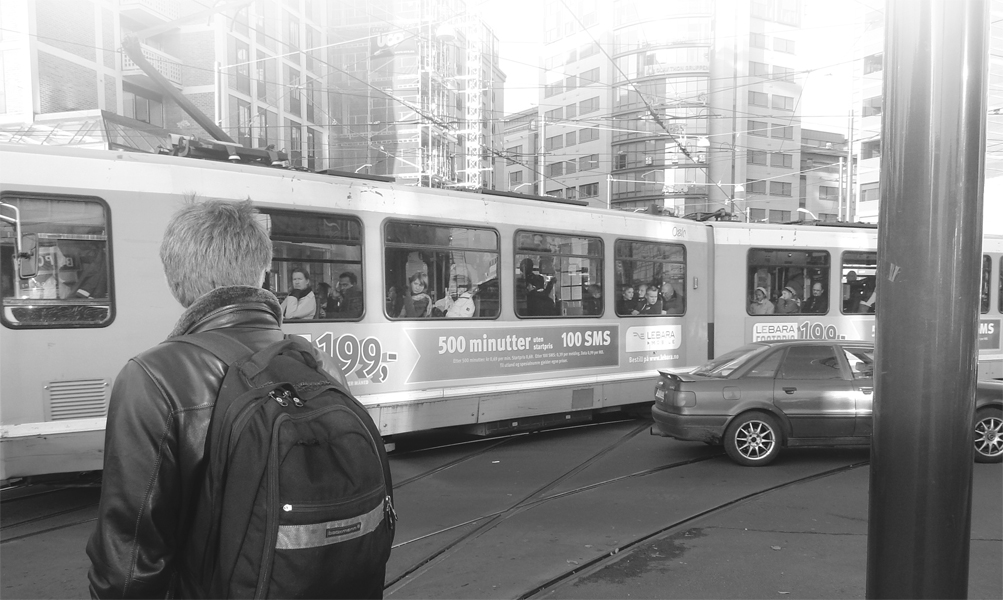
Approximately 5 percent of Americans use mass transit (public transportation) to get to work (Figure 4.13), a percentage much lower than that of most other industrialized nations. Mass transit includes buses, trolleys, and rail.
Buses (Figure 4.14) are the most prevalent form of mass transit, with over 160,000 miles of routes in the United States. However, many communities struggle to manage bus systems, and as ridership decreases, so does revenue, creating further problems for sustaining or expanding the systems.
Ferries are used to transport passengers or vehicles over water. They are a minor mode of transport in the United States, but are critical local components in some regions. For example, consider Puget Sound in Washington (see Figure 4.15), where large population, commercial, and industrial centers exist on opposite sides of a large body of water.
Figure 4.13 Modes of Travel to Work in the United States.
Source: U.S. Department of Transportation, 2009.
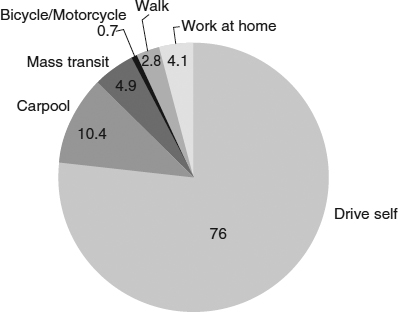
Figure 4.14 The Famous “Double-Decker” Buses (circled) of London.
Source: Courtesy of M. Gay.

Mass transit rail is typically divided into three categories:
- light rail—low-speed streetcars and trams with right-of-ways that can be crossed by vehicles and pedestrians (Figure 4.16);
- heavy rail—higher speed, higher volume rail with dedicated right-of-ways that are not crossed by vehicles or pedestrians, for example, subways; and
- commuter (regional) rail—high-speed, high-volume rail between adjacent cities, or between city centers and suburbs.
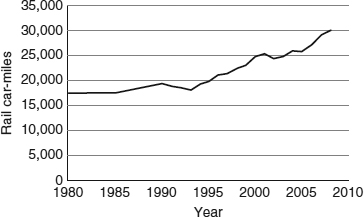
Many cities throughout the world have extensive rail systems, either underground (e.g., the “Tube” in London, the “Subway” in New York City) or elevated (the “El,” or “L,” in Chicago (Figure 4.17); the “People Mover” in Detroit), or a combination of below-ground, above-ground, and at-grade. The trend in the use of mass transit rail in the United States is shown in Figure 4.18. Note the steady increase since the mid-1990s.
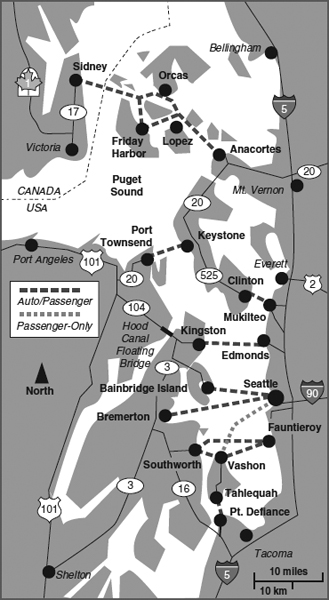
Figure 4.15 Seattle-Area Ferry Routes. Many ferry routes are utilized to link population and business centers on both sides of the Puget Sound.

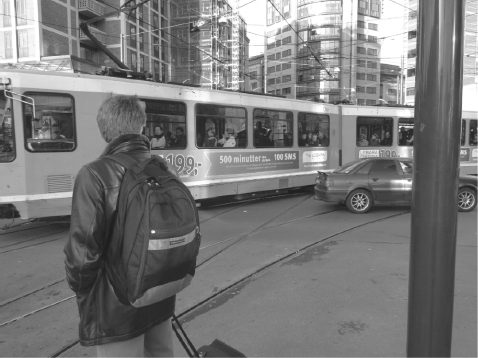
Figure 4.16 A Jointed, Multi-Car Tram in Olso, Norway. Note the interactions between tram, car, and pedestrian.
Source: M. Penn.
Figure 4.17 The “El” (Elevated Heavy Rail Above Street Level) in Chicago. Note parked cars (left) on street approximately 20 feet below rails.
Source: P. Parker.

Figure 4.18 Sum of Rail Car-Miles for Light Rail, Heavy Rail and Commuter Train in the United States. Rail car-miles is the product of miles travelled and number of rail cars.
Source: U.S. Department of Transportation, 2009.
Denver Mass Transit
Dramatic population growth in some areas often necessitates mass transit. For example, Denver, Colorado was the fastest-growing region in the United States during the 1990s, and has seen its population double since 1970 (Figure 4.19). A multi-billion dollar rail system was recently completed for southern suburbs and is expanding over the next ten years in all directions (Figure 4.20). “Our rail investments have been more successful than we ever imagined, and the public's ability to embrace a vision for more in the future has exceeded any of our expectations,” states Clarence Marsala, General Manager Denver Regional Transportation District. He continues, “We have billions of dollars in development happening along our rail corridors, especially in the vicinity of our stations.” Home values are also increasing, as demand is high for residences close to the stations.
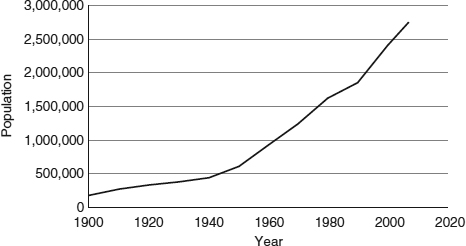
Figure 4.19 Population of the Denver, Colorado Metropolitan Area.
Data source: Metro Denver Economic Development Corporation.

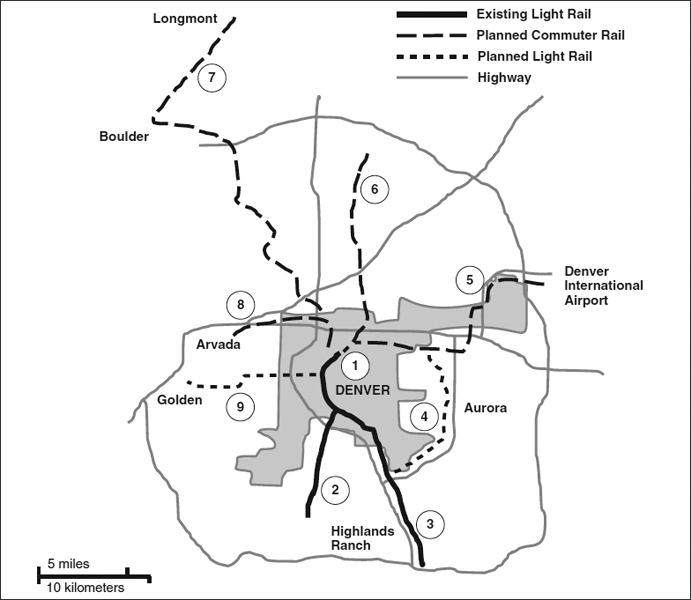
Figure 4.20 Planned Expansion of the Public Rail System in the Denver Region. Over 100 miles of rail lines will be added. Denver city limits shown as shaded region. Numbers refer to rail lines. Existing: (1) Central Corridor, (2) Southwest Corridor, (3) Southeast Corridor. Planned: (4) I-225 Corridor, (5) East Corridor, (6) Northwest Metro Corridor, (7) Northwest Rail Corridor, (8) Gold Line, (9) West Corridor.
Source: Redrawn from Denver Regional Transportation District.
Non-Motorized Transportation
Walking and biking are becoming increasing popular means of commuting and recreation in some parts of the United States. Effectively planned and designed pedestrian/bike routes can provide healthy and pleasant alternatives to mass-transit or automobiles. More pragmatically, every person that commutes by bicycle potentially equates to one less automobile on the road during times of peak congestion, thus making a contribution toward decreasing travel times for all roadway users and decreasing air pollution.
When seeking funding to expand cycling infrastructure, advocates often find themselves in a vicious cycle (pun intended) due to low demand. Funding is often based on demand, so money is not invested in cycling infrastructure. As a result, roads continue to be bike unfriendly, which makes them even less attractive to riding. The number of users remains low, which appears to planners as a lack of demand for bicycling infrastructure, and thus the pattern continues.
Figure 4.21 Example of a Bike Lane.
Shown are the bike lane, bus lane (right), and standard lanes (left). The far left lane is closed for construction. Note the “jaywalker” opting against use of the pedestrian bridge only a few yards away (background).
Source: M. Penn.
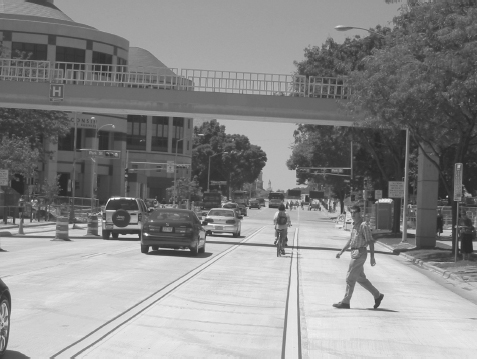
Bicycle infrastructure includes off-road trails and bicycle lanes within roadways (Figure 4.21). Signage and pavement markings are key design considerations to increase the safety of bike lanes. Many of the planning and design considerations for off-road bike trails are analogous to those for roads (e.g., route selection, grade, width, turning radius, intersection geometry). Interfaces between pedestrian/bike routes and roadways are of particular concern from a safety perspective, especially in highly developed areas where pedestrian/bike routes did not pre-exist. In such areas, education and signage are very important to alert automobile drivers.
Aviation (ASCE 2009 Grade: D)
Airports are fundamental components of population centers for business and personal travel, as well as for package and freight transport. Air traffic has steadily increased, doubling since 1980. Airports range in scale from local to regional to international.
“Flying Blind” (PBS Video on the U.S. Air Transportation System)
Airport design must consider many aspects. The runway length is largely dependent on the type of aircraft the airport intends to serve. An analysis of wind patterns and speeds must be performed, along with an analysis of the available airspace and existing flight patterns. Also, the airport must have appropriate links to other transportation and infrastructure systems. A viable site for an airport or airport expansion must consider the existing topography; a flat site will minimize earthwork. However, many areas with level topography include wetlands (because precipitation collects in depressions), which complicate regulatory requirements for construction. The location of a major airport will also have profound impacts on road traffic, surrounding land use (commercial and industrial development, long-term airport parking, required buffer zones), and property values. Like all infrastructure components, growth will create increased demand and the need for expansion. As with all infrastructure projects, effective design must be preceded by effective planning (discussed in more detail in Chapter 11, Planning Considerations). Without proper planning, the expansion of an airport can lead to great controversy as surrounding areas of development (businesses or residential) will need to be purchased and demolished or moved.
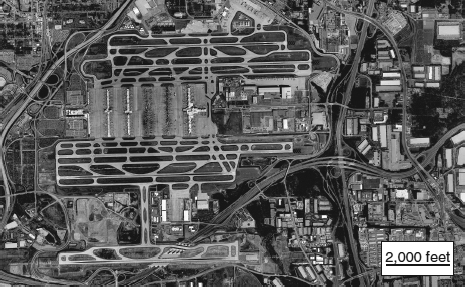
Figure 4.22 Atlanta Hartsfield International Airport.
Source: U.S. Geological Survey.
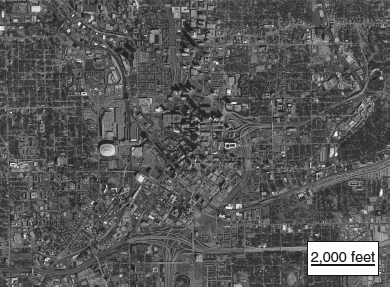
Figure 4.23 Downtown Atlanta. Note the scale is the same as in Figure 4.22.
Source: U.S. Geological Survey.
Design elements include a plan design of the runways, taxiways, terminal, parking, and other features. Runways are typically laid out such that the prevailing wind directions do not act as crosswinds for as much of the year as possible. A pavement design must be created that will withstand the landing and taxiing of planes. An additional design element is a stormwater management plan. The large amounts of impervious surfaces (runways, roads, roofs) create stormwater management challenges. These challenges are compounded in colder climates, where chemicals used to de-ice planes end up in the stormwater runoff.
![]() Remember that full-sized versions of textbook photos can be viewed in color at www.wiley.com/college/penn.
Remember that full-sized versions of textbook photos can be viewed in color at www.wiley.com/college/penn.
Four U.S. airports rank in the top 10 in the world in terms of passenger arrivals and departures. The world's busiest airport, Atlanta's Hartsfield-Jackson International Airport, has a footprint of approximately 6 square miles (approximately equal to 4,000 soccer fields, or the size of a city of 20,000 residents). It is larger than Atlanta's central business district as shown by comparing Figure 4.22 and Figure 4.23. Moreover, it has tremendous infrastructure demands; for example, it is the third largest water user in the state of Georgia. Its combined terminal and concourse space is nearly 6 million square feet.

Waterways (ASCE 2009 Grade: D-)
Cities often originated in coastal areas and along major rivers because historically ships were a primary means of transportation. While roads and railways are the major modes of transportation today, waterways remain a significant mode of transportation for goods. Approximately 12 percent of domestic goods and 80 percent of international goods transport occurs via waterways.
Rivers such as the Mississippi, the Missouri, and the Ohio are often called “working rivers” because they are as much a means of transportation as they are aspects of the natural landscape. There are approximately 30,000 miles of navigable waterways in the United States. Managing these rivers for transportation requires controlling flows and dredging bottom sediment to keep navigation channels open at necessary water depths. These engineered activities are often at odds with environmental requirements, some of which will be discussed later in this book.
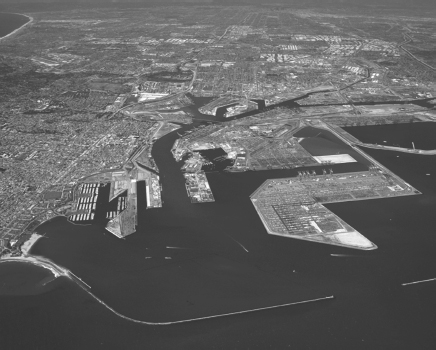
Figure 4.24 The Port of Los Angeles. The port encompasses 7,500 acres with over 40 miles of waterfront and 27 cargo terminals. For scale, the opening in the seawall (foreground) for ship passage is approximately one-half mile wide. It is estimated that the port creates 900,000 regional jobs and generates $40 billion in annual wages and tax revenues.
Source: Port of Los Angeles.

Ports
Ports are integral in the transportation of goods. Ports allow for the intermodal transfer of goods, between water (ships) and land (trains and trucks). Design, construction, and maintenance of ports is typically carried out by “specialty” firms. This is because there are approximately 150 ports in the United States, a number dwarfed by the number of other infrastructure components such as roads, bridges, parks, and water and wastewater facilities. Thus, the vast majority of civil and environmental engineers are not involved in work on ports. Nonetheless, there is great potential for interested engineers in this line of work.
PBS Video on Ports
A Commentary on Ports
Seven of the world's 20 busiest ports (and three of the top five) are located in China; this is perhaps not surprising given the tremendous quantity of exports from the country. Three U.S. ports rank in the top 20 (rankings in parentheses): Los Angeles (10, seen in Figure 4.24), Long Beach (12), and New York/New Jersey (18). As noted previously with respect to airports, shipping ports have dramatic impacts on surrounding land use and must be appropriately linked to other infrastructure systems, especially major freight modes such as trucking and rail. For intermodal freight transport, standardized containers are used commonly with ships, rail, or trucks to significantly increase transfer efficiency between modes of transport via crane (Figure 4.25 and Figure 4.26). The containers come in several standardized sizes with the most common being approximately 8 feet wide by 10 feet tall by 50 feet long.
Infrastructure Needed to Support a Port
You are encouraged to use an Internet mapping service with satellite imagery such as maps.bing.com or maps.google.com to scan the array of infrastructure associated with the Port of Los Angeles and the adjacent Port of Long Beach.
As with roadways, ship traffic volume is an important design consideration for ports. Other design considerations include: the size of the vessels (width, length, and draft); the type of cargo (for handling and storage needs); types of vessels (e.g., passenger, commercial, or recreational); breakwater design (to dissipate wave energy); and the structural design of piers and wharfs.
Draft is the depth of a ship's bottom below the water surface.
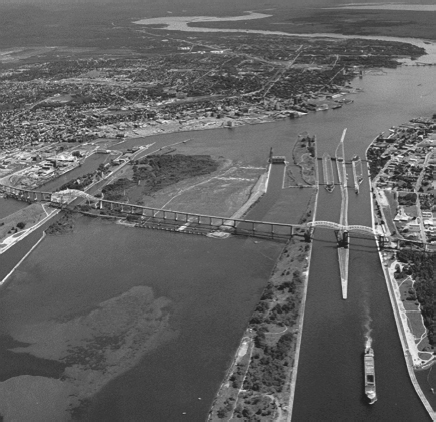
Locks
There are approximately 250 locks in the United States, 29 of which are on the Mississippi River. Locks are utilized to permit ship travel around a dam (Figure 4.27) or through a shallow stretch of water (Figure 4.28). Locks function by opening or closing gates to allow water to flow in to raise a ship, or to flow out to lower a ship. Their design depends on the type of vessel (barges on the upper Mississippi versus oceangoing vessels in the St. Lawrence Seaway), the water surface elevations upstream and downstream of the locks, and the speed at which locks are desired to fill and empty.
Inner Harbor Navigation Canal Lock Replacement Project Video
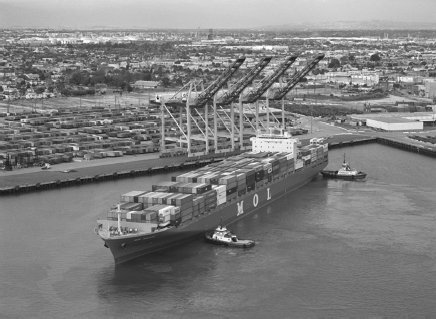
Figure 4.25 A Cargo Ship Carrying More than 500 Intermodal Containers About to Be Unloaded. Note the crane and container storage area in the background. Several million containers are handled annually at the Port of Los Angeles.
Source: Port of Los Angeles.
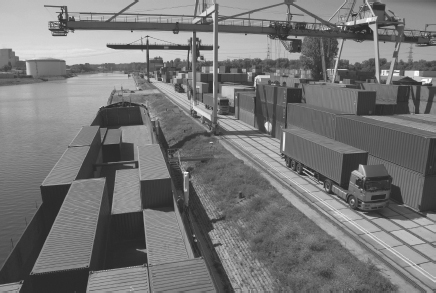
Figure 4.26 Standardized Intermodal Containers Being Loaded Onto Trucks from a Ship on the Rhine River in Germany.
Source: Copyright © Joerg Reimann/iStockphoto.
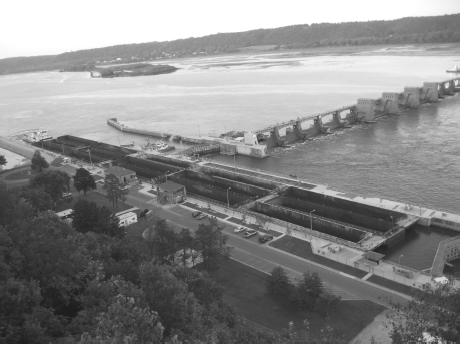
Figure 4.27 A Lock for Passage of Ships, and Dam on the Mississippi River in Dubuque, Iowa. The drop in water surface elevation across this lock is approximately 15 feet.
Source: P. Parker.
Tunnels
Tunnels are a costly but potentially very effective means of “shortcutting” transportation routes for rail or roadways (e.g., routing through a mountain, rather than around it). In urban areas, tunnels also provide a means of moving surface traffic underground when space is not available aboveground. In addition to transportation uses, tunnels are also used for water supply conveyance, hydroelectric power (connecting low elevation turbines to high elevation water reservoirs), utilities, and stormwater/wastewater storage. Large diameter tunneling machines, while expensive, dramatically reduce construction times for tunnels.
Article on “How Tunnels Work''
Figure 4.28 The “Soo Locks” at Sault Ste. Marie, Connecting Lake Superior and Lake Hurony. Notice the shallow water (light color) to the left of the locks.
Source: U.S. Army Corps of Engineers.

The Channel Tunnel (or “Chunnel”), between Britain and France, is a multi-billion dollar project completed in 1994. It was declared one of the Seven Wonders of the Modern World by the American Society of Civil Engineers (ASCE). It consists of three borings (two 25-foot diameter rail tunnels and one 16-foot diameter service tunnel) over 30 miles long, which at the lowest point are 250 feet below sea level. In Shanghai, China, twin tunnels were constructed under the Yangtze River, each to hold three lanes of traffic and one lane of rail. The world's largest tunnel boring machines (50 feet in diameter) were used to create the tunnels (Figure 4.29). The most complex tunneling project in U.S. history, the “Big Dig” in Boston, will be discussed in later chapters of this book.
The World's Longest Transportation Tunnel
In October 2010, rock boring of a 35-mile long tunnel through the Swiss Alps was completed. The $10 billion rail tunnel is expected to open in 2017.
The most important design consideration for tunnels is the geologic formation through which the tunnel is being built. The design of a tunnel must specify its diameter, length, and longitudinal profile. If the geologic formation is not self-supporting, the type of tunnel lining (e.g., concrete as shown in Figure 4.30) must also be specified. The design will vary depending on whether it is to be used for rail or auto. Ventilation must be provided in longer tunnels to prevent the accumulation of explosive or asphyxiating gases. The type of boring method will depend on the construction timelines, the cost that the owner is willing to bear, and the type of material through which the boring occurs.
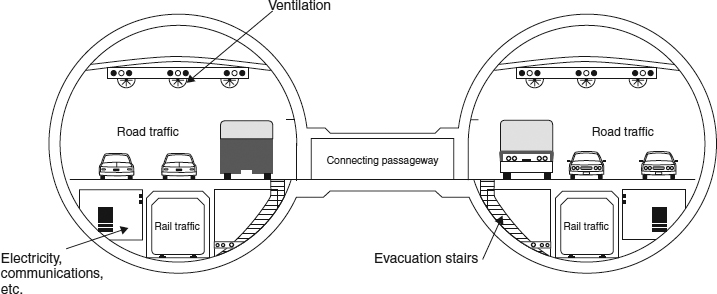
Figure 4.29 A Cross-Section of the Twin Tunnels in Shanghai, China, Under the Yangtze River.
Source: Redrawn from Wang et al., 2008.
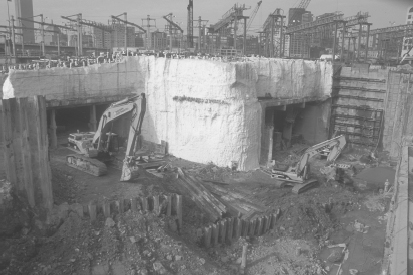
Figure 4.30 Tunnel Construction as Part of the “Big Dig” in Boston. Six lanes of interstate highway traffic needed to be routed under existing railroad tracks, requiring innovative construction methods. The tunnel was built in concrete “box” sections, and the sections were hydraulically rammed (or “jacked”) through the soil. In order to stabilize the overlying soil it was frozen by circulating cold brine through a piping system (note the white PVC pipes protruding from the soil surface). The exposed soil surface of the cuts was covered with sprayed-on insulation (seen above and adjacent to the tunnel sections) to keep the soil frozen and prevent collapse into the excavation.
Source: Courtesy of the Massachusetts Department of Transportation.

Ground Freezing for Soil Stabilization Case Study
Other Uses for Tunnels
Border patrol personnel continue to find tunnels, some complete with rail and ventilation systems, used for smuggling drugs from Mexico into the United States. In the Middle East, smugglers transport weapons in tunnels between Egypt and the Gaza Strip, below Israeli controlled areas.
Rail (ASCE 2009 Grade: C-)
While the mileage of freight rail operated in the United States has decreased substantially to approximately one-half the railway miles present in 1960, rail remains the largest mode of domestic goods transport (Figure 4.31) when measured in ton-miles (tons of freight multiplied by the miles transported). Rail has also experienced the greatest percent change in ton-miles since 1990 of all transportation modes (74 percent increase, compared to 53 percent for trucking).

Figure 4.31 Modes of Domestic Freight in the United States as a Percentage of Total Ton-Miles. A ton-mile is equal to one ton of freight transported one mile.
Data source: U.S. Department of Transportation, 2009.

There are many components of rail systems. One component is the rails themselves, designed to guide the flanged wheels of rail cars. These rails are attached to cross ties (“railroad ties”) that transfer the load from the train to the substructure. Ties are most often made of timber in North America, but concrete is also used. The rail system substructure consists of ballast material, composed of inch-sized stone. Its purpose is to hold the rails in place, provide drainage, and transfer the loads from the cross ties to the underlying native soil.
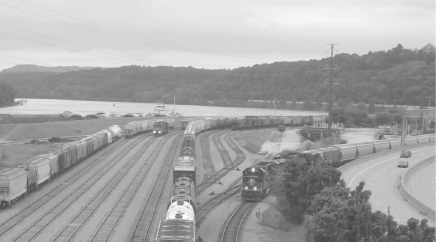
Rail systems include rail yards (see Figure 4.32), where locomotives or rail cars can be separated for maintenance or repair; incoming cars can be separated (or classified) and regrouped for final destination; or locomotives can be refueled with diesel. Switches are devices that allow track changes and are found in rail yards as well as at other points in the system where routing is required. Multiple simple switches are seen in Figure 4.32.
High-speed rail is quite popular for passenger travel in Europe and Asia, and several new projects are being pursued in the United States. The only system currently operating in the United States is the Acela Express from Washington, DC to New York. In 2008, California voters approved a $10 billion bond to begin work on a high-speed rail system from San Diego to San Francisco. The final, expanded project is estimated to cost nearly $50 billion. Capable of travelling at over 100 mph, these systems can dramatically reduce travel times. In 2010, the Obama administration announced $8 billion in new funding to support the development of high-speed rail.
Figure 4.32 A Railway Classification Yard.
Source: M. Penn.
Rails-to-Trails
Thousands of miles of railway are abandoned each year. Since the 1970s, over 10,000 miles of rail corridor have been converted to hiking and biking trails due to the efforts of state agencies, the Rails-to-Trails Conservancy, and other organizations. Because of the low-grade (i.e., flat) nature of railways, the trails are ideal for recreation for a wide variety of users, including the young, elderly, and disabled. There are also many rail corridors that have provided trails in the right-of-way adjacent to operating rail lines, termed rails-with-trails.
The Elroy-Sparta Trail in Wisconsin, one the nation's first rails-to-trails projects, includes three unique tunnels constructed in the late 1800s that are over one-fourth mile in length each and are unlit (Figure 4.33). The trail has been an “economic engine” for the small, rural towns along its 30-mile route. Over $1 million per year in trail-related tourism is brought to the area.
Rails-To-trails Conservancy
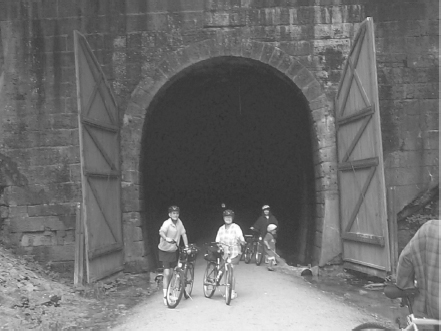
Figure 4.33 A Tunnel on the Elroy-Sparta Rail Trail in Wisconsin. The original rail tunnel was completed in 1873 and is 1,700 feet in length. If you look closely, you can see “the light at the end of the tunnel” above the middle biker's head.
Source: Courtesy of C. Kennedy.

Outro
Transportation is perhaps the most visible aspect of our infrastructure, and it “connects” various infrastructure components. After reading this chapter, it should be clear that the transportation infrastructure consists of far more than highways. As populations increase and become more dense, transportation needs and challenges become more complex. Transportation also creates significant environmental impacts, which will be discussed in the following chapter.
chapter Four Homework Problems
4.1 Using an online aerial photography service such as maps.google.com or maps.bing.com, view the Port of Los Angeles, which was mentioned in this chapter. Print out a copy of this aerial photograph and compute the land area devoted to the port. Your answers will vary depending on how you choose to delineate the port's boundaries; therefore, it is very important that you show your work.
4.2 What types of conflict points exist for the roundabout in Figure 4.8 (i.e., merging, diverging, or crossing)? How would the type of accidents that occur for a roundabout differ for those that would occur in the intersection of Figure 4.7?
4.3 Between which stations in Figure 4.2 will material be removed (cut) in order to build the new road profile? Between which stations will fill be required?
4.4 Imagine a community for which its first roundabout is being built. As the Director of Public Works for the community, how might you educate the members of the community? Which members of the community might be most critical to target with your educational program? What are the most important points about roundabouts to “teach” community members?
4.5 Would you consider being a “slug” if you lived in a large metropolitan area? Why or why not?
4.6 There are many arguments for and against the federal government subsidizing high-speed rail. One such argument against such funding states that by subsidizing high-speed rail with general tax dollars, some people are forced to help pay for a system (through their taxes) that they may never use, perhaps because they live too far away from the rail system. Do you think this is a valid argument? Why or why not?
4.7 How does your university encourage bicycle use? What additional measures could be taken to further encourage bicycle use? What are the benefits to a university encouraging bicycle use? What are some disadvantages to increasing bicycle use?
Note: For Homework Problems 4.8 through 4.13, the ASCE Report Card for America's Infrastructure is available at www.wiley.com/college/penn.
4.8 Read the ASCE Report Card for America's Infrastructure chapter on roads. Based on this chapter, state the most challenging problems facing the roads sector.
4.9 Read the ASCE Report Card for America's Infrastructure chapter on inland waterways. Based on this chapter, explain why inland waterways are important. Characterize their present condition.
4.10 According to the ASCE Report Card for America's Infrastructure chapter on aviation, how resilient is the U.S. aviation system?
4.11 List the five most important points (in your opinion) made by the ASCE Report Card for America's Infrastructure chapter on aviation.
4.12 Read the ASCE Report Card for America's Infrastructure chapter on transit, and list the components that make up a transit system.
4.13 Read the ASCE Report Card for America's Infrastructure chapter on transit. Use information from this chapter to write a letter to the editor of the local newspaper, arguing either that the community should invest more (or less) in mass transit.
4.14 Research the National Transportation Statistics website (a link to which is available at www.wiley.com/college/penn). Select data from this site that you find most interesting and create three different graphs using a spreadsheet program. For each graph, write one paragraph that explains the graph and its significance.
4.15 Evaluate the parking on your campus. Is it sufficient? Why or why not? If not, what are some possible solutions?
Key Terms
- alleys
- automated tolls
- classified
- conflict points
- cross-section
- crowned
- cut
- design speed
- draft
- express lanes
- ferries
- fill
- flexible pavements
- frontage roads
- grades
- high-speed rail
- horizontal alignment
- horizontal curves
- interchanges
- intermodal
- intersections
- level of service
- locks
- offsets
- parking structures
- plan view
- profile view
- rail yards
- right of way
- rigid pavements
- roundabouts
- service roads
- sight distance
- slugging
- station
- subgrade
- switches
- tangents
- vertical alignment
- vertical curves
References
Kutz, M. Handbook of Transportation Engineering. New York: McGraw-Hill Professional, 2003.
U.S. Department of Transportation. 2009. National Transportation Statistics. http://www.bts.gov/publications/national_transportation_statistics/, accessed August 8, 2011.
U.S. Federal Highway Administration. 2004. Signalized Intersections: Informational Guide. FHWA-HRT-04-091.
Wang, X., Z. Q. Guo, and J. Meng. “Design of hazard prevention system for Shanghai Yangtze River Tunnel.” The Shanghai Yangtze River Tunnel—Theory, Design and Construction. London: Taylor & Francis Group, 2008.