
Chapter Five
Environmental and Energy Infrastructure
Chapter Outline
- Introduction
- Energy (ASCE 2009 Grade: D+)
- Drinking Water (ASCE 2009 Grade: D-)
- Wastewater (ASCE 2009 Grade: D-)
- Stormwater
- Parks and Recreation (ASCE 2009 Grade: C-)
- Solid Waste (ASCE 2009 Grade: C+)
- Hazardous Waste (ASCE 2009 Grade: D)
- Outro
Learning Objectives
After reading this chapter, you should be able to:
- List the main subsectors and components of the environmental and energy infrastructure.
- Explain the function of each infrastructure sector.
- Identify components related to environmental and energy infrastructure.
- Explain the function of components related to environmental and energy infrastructure.
- List some of the important design parameters for components related to environmental and energy infrastructure.
- Describe some of the fundamental relationships between environmental and energy infrastructure and other infrastructure sectors, subsectors, and components.
Introduction
The environmental infrastructure exists to protect the environment from the impacts of other infrastructure components and to provide clean drinking water and recreational areas. It is linked to the energy infrastructure in many ways; for example, the extraction and use of energy creates many environmental impacts. Moreover, the accumulation of greenhouse gases is inextricably linked to the energy use.
Energy (ASCE 2009 Grade: D+)
ENERGY SOURCES
From a civil infrastructure perspective, “energy” is typically either electricity, fuel for heating and cooling buildings, or vehicle fuel. This section will focus on electrical energy and the “power grid.” Electricity is generated from both renewable and non-renewable sources. Major renewable sources include hydropower, wind, solar, geothermal, and biomass and account for approximately 10 percent of electrical generation in the United States. Nonrenewable (finite) sources include fossil fuels (oil, coal, natural gas) and nuclear material, which account for approximately 90 percent of electrical generation in the United States (Figure 5.1). Energy sources and their environmental impacts are discussed in greater detail in Chapter 12, Energy Considerations.
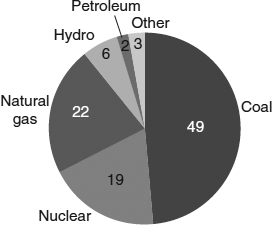
Figure 5.1 Energy Sources for Electrical Generation in the United States, 2008.
Source: U.S. Energy Information Administration.
ENERGY TRANSPORT
The transport of solid (e.g., coal, nuclear material) energy sources is often by rail. Natural gas and petroleum are transported long distances via pipelines (Figure 5.2). Note in Figure 5.3 the dramatic increase in natural gas pipeline length as new gas fields have been tapped.
ENERGY GENERATION
In most cases, energy generation results from an energy source being utilized to turn a turbine that rotates wires within a magnetic field to produce electricity. Conventional “power plants” (e.g., coal or nuclear power generating facilities) use heat from combustion or nuclear reactions to produce steam to turn the turbines. A hydroelectric plant utilizes the potential energy (elevation) of an accumulated water body to turn turbines (Figure 5.4).
Electrical generating facilities require integration with not only the power grid, but also the transportation “grid.” A coal-fired power plant requires the delivery and storage of tremendous amounts of fuel (Figure 5.5), as much as 10,000 tons (100 rail cars) per day. Additionally, large amounts of water are needed for cooling the steam; thus, these facilities are typically located beside large rivers or lakes.
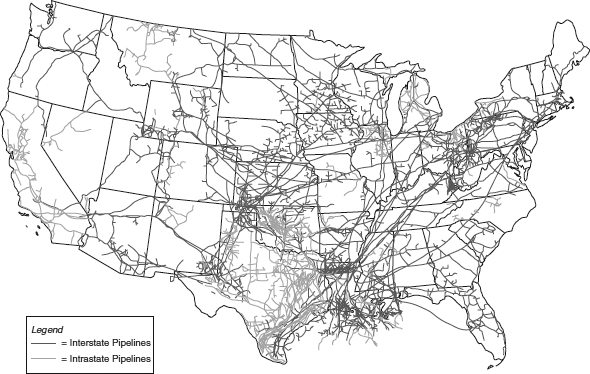
Figure 5.2 Natural Gas Pipelines in the United States. A similar, but less extensive, network exists for petroleum.
Source: U.S. Energy Information Administration, Gas Transportation Information System.
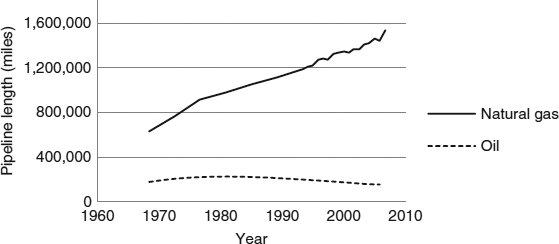
Figure 5.3 Pipeline Length in United States for Natural Gas and Oil.
Data source: U.S. Department of Transportation, 2010.
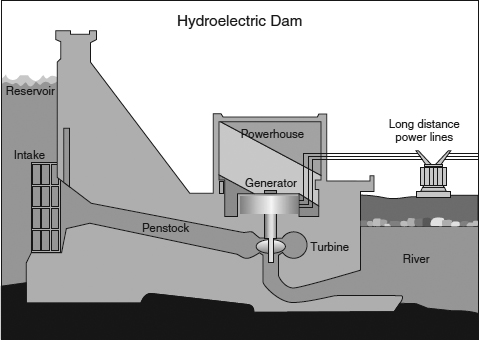
Figure 5.4 A Generalized Cross-Section of a Hydroelectric Dam.
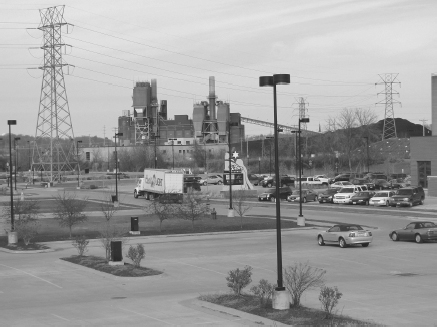
Figure 5.5 A “Small” Coal-Fired Power Plant. The power plant (80 megawatts) serves approximately 50,000 homes. Notice the large coal stockpile to the right of the plant. This several decades-old facility was once surrounded by industries, but today is in the midst of urban redevelopment (offices, hotels, restaurants) as evidenced by the landscaped parking lots in the foreground.
Source: M. Penn.
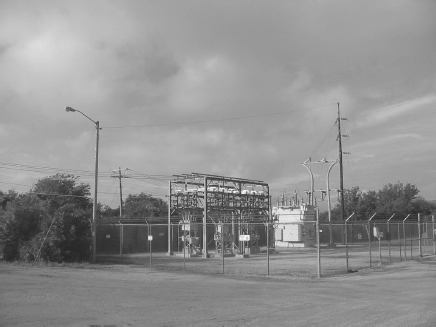
Figure 5.6 An Electrical Substation. High voltage lines are coming into the substation from the right and lower voltage lines are leaving the substation to the left.
Source: M. Penn.
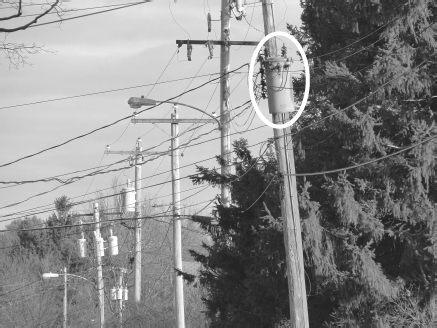
Figure 5.7 Distribution Transformers (Circled in Foreground) to Lower Voltage to 240 Volts for Residences.
Source: M. Penn.
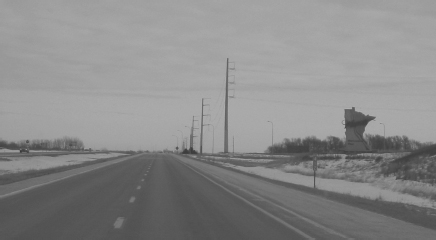
Figure 5.8 Transmission Lines Crossing the South Dakota/Minnesota Border. This picture is taken on Interstate 90 at the state line (note the “Welcome to Minnesota” sign in the shape of the outline of the state).
Source: M. Penn.

DISTRIBUTION
The electricity that is generated must be distributed to the end users via electric wires. To minimize energy losses during long-distance transmission, high voltages, on the order of several hundred thousand volts, are used. This voltage is “stepped down” at regional substations (Figure 5.6), typically to 7,200 volts for local distribution in the power lines that are commonly seen above streets. An additional reduction to 240 volts occurs at distribution transformers for most end users (e.g., businesses and residences; Figure 5.7).
The national power grid allows for redundancy, whereby power is supplied from many sources into regional networks. If there is a reduction in production at any one generating facility, electricity is available from other facilities. Most states receive power from neighboring states in addition to their own generation (Figure 5.8).
Drinking Water (ASCE 2009 Grade: D-)
Public water supplies must meet the demands of residential, commercial, institutional, and industrial users. Water must be delivered to homes such that residents always have safe drinking water at an appropriate pressure. The same system that treats and distributes the drinking water to homes must also meet the pressure and quality needs of the non-residential users. Perhaps most importantly, this system must be able to supply large quantities of water for firefighting purposes.
Typically, the entire water supply distribution system carries water that has been treated to drinking water standards, even though less than 1 percent of the water is used for drinking. As drinking water standards become more stringent, the cost for treatment escalates. Some communities have implemented, or are considering the implementation of, separate water systems, whereby some users (e.g., industry and landscape irrigation) are supplied with water that is not treated to drinking water standards. The cost of savings from lack of (or less thorough) treatment must be weighed against the capital, operation, and maintenance costs of the additional infrastructure (i.e., a “second” water distribution system).
SOURCES AND DEMAND
The residential per capita water demand for the United States averages about 60 gal/capita/day. When taking into account all water needed to meet residential, industrial, commercial, and municipal irrigation demands, the average per capita demand doubles to 120 gal/capita/day. Given that landscape irrigation, commercial use, and industrial use varies widely from region to region, so too does the total per capita water demand of any system. Water sources include groundwater (from either shallow or deep wells), lakes, rivers (either directly, or from reservoirs created by constructed dams) and oceans. Another source, albeit one that is highly contentious and unsavory in the public 's opinion, is treated domestic wastewater.
The total water use (demand) of a community (or several communities served by one system) divided by the population is the per capita water demand.
Groundwater is used for individual rural residential use as well as for public water systems and industrial users. As discussed in Chapter 2, The Natural Environment, there is a direct relationship between groundwater and surface water. Therefore, large withdrawals of groundwater must consider environmental impacts such as lowering river flows or lake levels. Many communities are facing challenges as their withdrawal of groundwater far exceeds the rate of aquifer recharge; consequently, water levels in their wells are decreasing, often at rates of more than several feet per year. In coastal communities, the withdrawal of groundwater can draw ocean water inward to the previously freshwater wells (termed saltwater intrusion), which creates the need for costly additional treatment to remove salts (desalinization).
Water Reuse
In 2009, Orange County (including Los Angeles), California started reusing wastewater, indirectly, as a drinking water source. After treating the wastewater beyond drinking water standards, it is injected underground to recharge aquifers supplying drinking water to over 2 million people. An added benefit to the injection of the treated wastewater underground is that it prevents saltwater intrusion.
Many communities indirectly reuse treated wastewater as a drinking water supply. A downstream community that uses a river as a water supply will be utilizing the treated and diluted wastewater of upstream communities.

STORAGE
The need for water storage can be understood by considering that the water demand of a community fluctuates over a 24-hour period, termed diurnal variation (Figure 5.9). The average residential demand of 60 gal/person/day is approximately equivalent to 3 gal/person/hour; however, at 3 a.m. when most people are sleeping, the average use for a community may be much less than 1 gal/person/hour. On the other hand, at 7 a.m., when most people are showering and using toilets, the demand may be as high as 30 gal/person/hour. Rather than inefficiently trying to supply a water system to meet varying demands over the course of a day, the system pumps can deliver water at the average rate, and excess water is stored during periods of low demand.
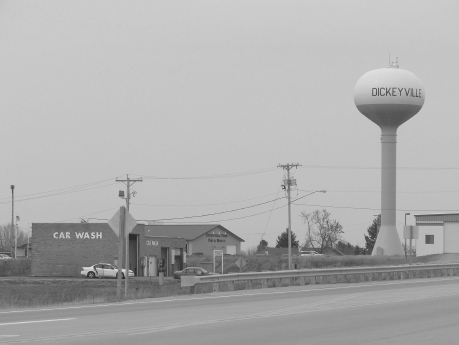
Storage may be aboveground (Figure 5.10), below ground, or at ground level. Elevated storage tanks are filled during times of lower demand and emptied at times of peak demand. Elevated storage tanks also provide necessary pressure in the system (typically between 50 to 70 pounds per square inch, or psi) and allow for less variation in pressure throughout the day. Also, storage tanks provide a volume of water that can be used for firefighting or for emergency use (e.g., in the event of the failure of a well pump).
Water demand can also fluctuate seasonally, for example in tourist areas and in arid regions where landscape irrigation needs are great. Systems must be designed to account for these seasonal changes. Additionally, long-term variations in climate can affect water availability. Communities depending on surface water reservoirs (dammed rivers) will face potentially severe water shortages if the reservoir was not designed or managed to have sufficient storage during drought periods.
Figure 5.9 Diurnal Variation in Water Demand for Various Customer Types. These types include: (a) industry, (b) residential, and (c) commercial. The overall community water demand (d) is a combination (the sum) of all individual user demands. The quantity and timing of industrial water demand in communities is highly variable depending upon the types of industries present.
Source: Reprinted, with permission, from Mihelcic and Zimmerman, 2010.
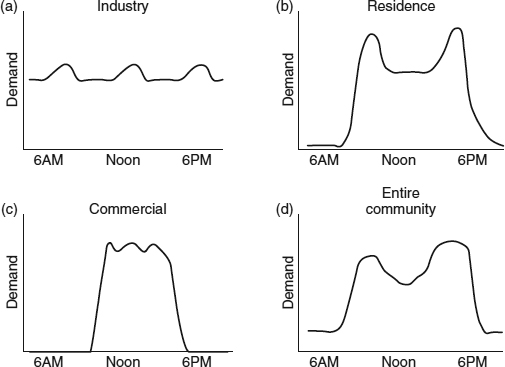
Figure 5.10 An Elevated Water Tank with Two Nearby “Users.” The users” are the car wash in the foreground and fire station behind the car wash. This single 110-foot-tall tank has a capacity of 250,000 gallons and serves a community of 1,000 residents. Larger communities may have many tanks with capacities up to several million gallons.
Source: M. Penn.
CONVEYANCE
Groundwater wells are often located in close proximity to water users. Surface water reservoirs may, in extreme cases, be 100 or more miles away from end users. New York City has a network of concrete lined tunnels (up to 24 feet in diameter) to bring water to the city for treatment. Southern California uses large concrete lined channels that carry water hundreds of miles from water supplies in northern California and from the Colorado River.
TREATMENT
The treatment of drinking water has two goals: to produce safe (potable, pronounced p![]() -t
-t![]() -b
-b![]() l) drinking water and to provide aesthetically pleasing water. The safety of drinking water is carefully regulated, ensuring that toxic chemicals and pathogens (disease-causing microorganisms) are removed to appropriate levels. Providing aesthetically pleasing water is typically not regulated nor required, but is driven by public opinion. Examples of aesthetics as they relate to drinking water include tastes and odors, iron/manganese (which stain bathtubs and laundry), and hardness (lime scale in and on plumbing components).
l) drinking water and to provide aesthetically pleasing water. The safety of drinking water is carefully regulated, ensuring that toxic chemicals and pathogens (disease-causing microorganisms) are removed to appropriate levels. Providing aesthetically pleasing water is typically not regulated nor required, but is driven by public opinion. Examples of aesthetics as they relate to drinking water include tastes and odors, iron/manganese (which stain bathtubs and laundry), and hardness (lime scale in and on plumbing components).
Treatment facilities vary widely depending on the composition of the source water, the volume of water treated, the types of treatment processes utilized, and the extent to which aesthetics are to be addressed. Many groundwater supplies have low contaminant concentrations and require minimal treatment. Surface waters, especially major rivers, contain not only high amounts of particulates (suspended sediment) but are also often contaminated with microbial and chemical pollutants. There are many different feasible design solutions that may be used for a given scenario (just as there are many different types of bridges that could be designed to cross a certain span.) Processes to treat water include contaminant removal by physical methods (e.g., settling of particles, screening/filtering of particles, UV radiation to kill pathogens) and chemical methods.
DISTRIBUTION
Drinking water is distributed in pressurized pipes, or water mains (often PVC or ductile iron), to users. Older systems used cast iron and wooden mains (Figure 5.11). The minimum diameter for new pipes is 6 inches, but older systems include 4-inch pipes and smaller.
Water distribution networks are designed to include redundancy, so that water can usually be supplied to a user from multiple routes in case of water main breaks, maintenance work, or reconstruction. Valves are located throughout the system to isolate certain sections of the system (e.g., valves on each side of a main break can stop the loss of water and allow maintenance workers to repair the main). Fire hydrants are an integral part of the distribution system, and are used for fighting fires and the flushing and testing of mains (Figure 5.12).

Figure 5.11 A Portion of a Wooden Water Main Wrapped with Wire.
Source: Courtesy of S. Anderson.
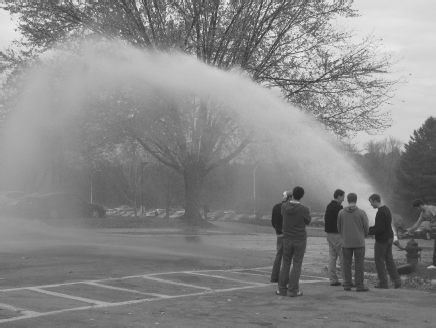
Figure 5.12 Students Test a Hydrant to Determine Flow and Pressure Characteristics of the Water System.
Source: Courtesy of D. Rambo.
Hydrants are cast with a date on them corresponding to the year of manufacture, and thus they may be used to estimate the age of the water main to which they are connected. Installation dates typically closely correspond to the casting date, and hydrants are typically replaced when the water mains to which they are connected are replaced.
Security is a major concern in public water supply and will be discussed in detail in Chapter 18, Security Considerations.
Water Main Breaks
A break in a water main can have wide-ranging impacts. For example, in May 2010, a break in a 10-foot-diameter water supply pipe in Weston, Massachusetts resulted in an emergency declaration for 2 million Boston-area residents to boil drinking water as a precaution against potential water supply contamination. Large water main breaks can cause extensive damage. The pressurized water erodes the adjacent soil and can result in road damage.

A typical repair requires isolating the ruptured water main by closing adjacent valves; removing the overlying roadway; excavating to the water main; replacing a section of the main; filling and compacting the excavation; and repairing the roadway. Such repairs are disruptive to traffic and businesses, inconvenient to customers, and costly. For a small system, two or three breaks per year are common, whereas at the other extreme, the city of Los Angeles repairs approximately 200 water main breaks per year.
An Internet search for “water main break” will provide you with many images.
You Never Know What You'll Find Inside a Water Main
While extreme precautions are taken to ensure that water mains are properly installed, surprises do occur (e.g., Figure 5.13). In 2005, pieces of flesh were found in the water supply system of Carroll, Iowa, presumably from an animal that was hiding in a pipe during installation. At the extreme, even treated wastewater may be found in water systems if pipes are improperly installed. In 2007, cross-connections between the water supply and the treated wastewater irrigation supply were found at two residences in Cary, North Carolina.

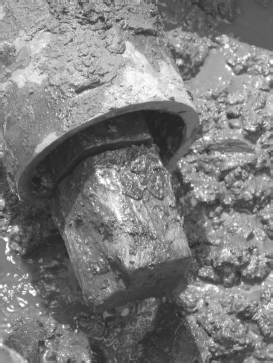
Figure 5.13 A 4 × 4-Inch Timber Found in a 6-Inch Water Main, Many Years After Installation.
Source: Courtesy of J. Malkowski.
Wastewater (ASCE 2009 Grade: D-)
Wastewater (sewage) is generated by the use of water for residential (shower/bath, toilets, laundry), commercial (car washes, laundromats, restaurants, sinks/toilets from any workplace), institutional (universities, schools, government offices, prisons) and industrial purposes. Prior to discharge to the environment after use (typically to rivers, lakes, estuaries or oceans, and sometimes to groundwater), it must be treated. Treatment removes debris, pathogens, toxic chemicals, organic material (that when degraded can rob a receiving stream of oxygen needed to sustain aquatic life), and unsightly materials such as fats, oils, and grease. Inadequate or non-existing wastewater treatment is a major public health threat in developing countries.
SOURCES
Given the diversity of sources, wastewater may include “clean” water (e.g., a leaky faucet in a home), human waste, cleaning chemicals, illegally disposed material (e.g., used motor oil), and industrial solvents and other byproducts. Wastewater is conveyed by underground pipes, termed sanitary sewers, to wastewater treatment facilities. However, hundreds of older cities in the United States have combined sewers for wastewater and stormwater (storm runoff from streets, roofs, etc.).
In combined sewers, wastewater and stormwater travel together in pipes rather than in separate systems.
Sewer systems leak, especially pipes and manholes that are several decades old (Figure 5.14 and Figure 5.15), and sometimes other pipes (storm drains, basement sumps, etc.) connect into the system. These unplanned sources are called inflow and infiltration (I and I, or I/I), and collectively they may contribute more flow to sewers than the sum of planned sources (residential, commercial, and industrial). Inflow and infiltration (I/I) decreases the capacity of sewers for conveying sewage and adds to treatment costs. As such, considerable efforts are made to identify and minimize these sources.
Infiltration is water that enters the sewer system below ground, typically through cracks or bad joints in pipes.
CONVEYANCE
Sanitary sewers are typically made of PVC or reinforced concrete pipe, and must be sized to handle current and expected future flows. Sewer systems are networks in which smaller pipes (laterals from homes) feed into larger pipes (collectors) and ultimately into even larger pipes (interceptors). This is analogous to street systems discussed in Chapter 4. Manholes are used to allow access to the sewers for cleaning, inspecting, and other maintenance activities. Sewers are designed to flow with a velocity greater than 2 ft/s in order to ensure that solids do not accumulate in the pipes. If topography (land slope) and geology (soil depth) allow, gravity sewers are preferred because there is no need for pumping. A typical section of gravity sewer is illustrated in Figure 5.16.
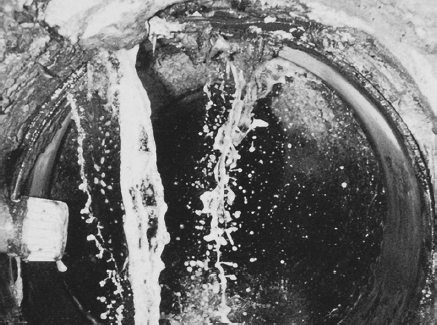
Figure 5.14 Infiltrating Water Seen from the Televising of a Sewer.
Source: Courtesy of Carylon Corp.
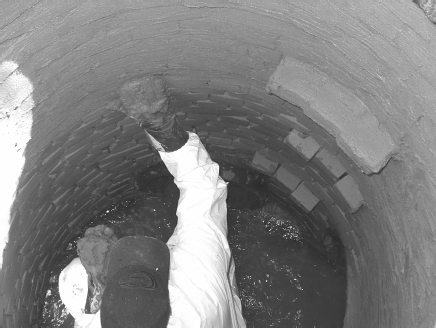
Figure 5.15 A Coating Being Applied to Seal a Leaky Brick Manhole.
Source: Courtesy of Carylon Corp.
Figure 5.16 A Gravity Flow Sewer with Gravity (Lateral) Connections from Homes.
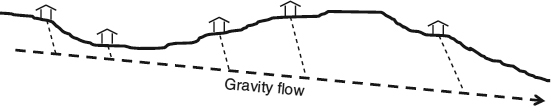
Figure 5.17 A Combined Gravity and Pressurized Sewer System with a Lift Station to Minimize Excavation.

Sewers must slope downward in order to convey the sewage by gravity. If the topography is relatively flat, the sewer becomes progressively deeper over long distances. If the depths of excavation become too great, or if shallow bedrock is encountered, excavation may become cost-prohibitive. Deep excavation also occurs when sewage must be conveyed across a ridge. In such situations, the sewage must typically be pumped (Figure 5.17). Pumping the sewage results in pressurized flow, and the pressurized sewage is carried in pipes termed force mains. Pumps add energy to overcome energy lost to friction and to overcome elevation changes. Pumps are located in structures known as lift stations.
 Milwaukee's Deep Tunnel System Website
In cities with combined sewers, the conveyance system is often overwhelmed by stormwater during large rain events. These systems have outfalls to release the excess water (Figure 5.18). The release of the untreated sewage and runoff is termed a combined sewer overflow. To reduce the public health threat from pathogens, combined sewer systems are being replaced with separate sewers, or large underground storage reservoirs are constructed to store the excess water for later treatment. Sanitary sewer systems with substantial sources of I/I can also be undersized during extreme precipitation events, potentially leading to sewage back-ups in basements and sanitary sewer overflows.
Figure 5.18 A Combined Sewer Outfall. The hinged cover will open when the gravity sewers fill and become pressurized, releasing untreated combined sewage into the river (foreground).
Source: M. Penn.

A sanitary sewer overflow occurs when the system becomes pressurized and manhole covers are “blown” off their bases, thereby releasing untreated sewage into streets and ultimately to nearby surface waters via storm sewers.
TREATMENT
Wastewater treatment facilities (WWTFs; also referred to as wastewater treatment plants [WWTPs] or sewage treatment plants [STPs]) may be publicly owned by a community, regionally owned by a utility, or privately owned by a large wastewater company. Many industries (e.g., a brewery or cannery) have wastewater treatment facilities that pre-treat their waste before discharging to the sanitary sewers. Treatment systems consist of several processes, each with a specific objective, that rely on chemical, physical, or biological means of contaminant removal. Each process is a component within the system; as such, it must be compatible with subsequent processes to ensure that the system operates efficiently and effectively.
- Preliminary treatment processes, such as screens and settling tanks, are often included at the beginning (headworks) of the facility to remove items (e.g., sand and other grit, rags, condoms) that will potentially damage or shorten the operating life of treatment processes or pumping equipment.
- Primary (physical) treatment (Figure 5.19) removes floating fats, oils, greases, and settleable inorganic and organic material.
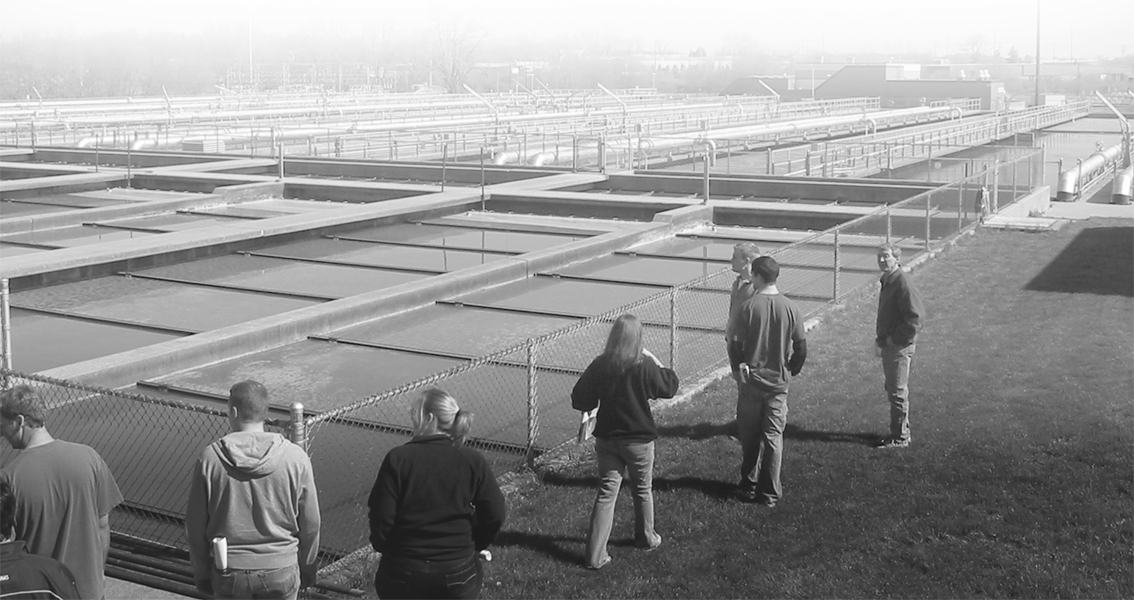
- Secondary (biological) treatment utilizes microorganisms, either on attached surfaces such as corrugated plastic or in a suspended slurry termed activated sludge (Figure 5.19). The purpose is to transform organic material into carbon dioxide in a controlled setting, rather than in the natural environment where it will rob the receiving water of oxygen.
- Tertiary (chemical or biological) treatment is used for nutrient (phosphorus or nitrogen) removal.
- Throughout the treatment system, clarifiers (settling tanks) are used to settle solids.
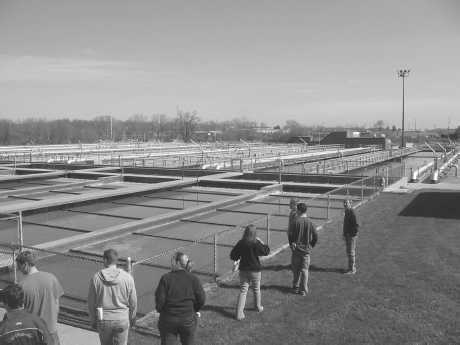
Figure 5.19 Students Tour a WWTF that Treats 40 Million Gallons of Sewage Per Day. This amount of sewage is produced by approximately 400,000 people. Primary clarifiers are in foreground. Activated sludge is in the background. The large pipes running parallel to the activated sludge tanks are carrying pressurized air to the tanks for aeration.
Source: M. Penn.
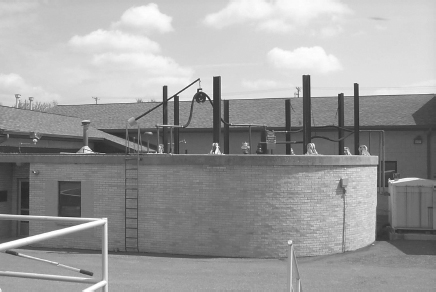
Figure 5.20 An Anaerobic (Absence of Oxygen) Digester. The rollers and steel columns protruding from the top are support for the “floating” cover under which methane produced during digestion accumulates.
Source: M. Penn.
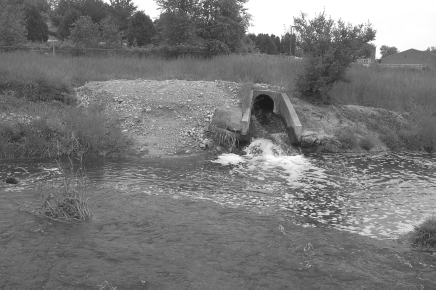
Figure 5.21 Effluent from a WWTF (Background) Discharged into a Stream. Newly placed gravel (left of the outfall) was placed after scour of the bank during a flooding event.
Source: M. Penn.
- Disinfection is used to reduce pathogens to safe levels for discharge to the environment.
- Sludge (accumulated solids, also termed biosolids) from clarifiers is collected and treated for disposal, often using digesters (Figure 5.20) to reduce pathogens and decompose the organic material. Prior to disposal or land application, in order to reduce volume for reduced hauling expenses, water is removed from the sludge via dewatering or drying.
Anything You Can Imagine Can be Found In a Sewer
Wastewater system operations and maintenance personnel are accustomed to finding just about anything in sanitary sewers and at the headworks of treatment facilities. Inadvertent cross-connections between storm sewers and sanitary sewers are common. Large rocks, basketballs, and even human corpses have been found.
DISCHARGE
Effluent (treated water exiting the wastewater treatment facility) is typically discharged to rivers, streams (Figure 5.21), lakes, estuaries, or oceans. The level of treatment required is based on the desired water quality of the receiving water body with which the effluent mixes. In some cases, effluent is discharged to groundwater through large seepage cells on the land surface.
Stormwater
Stormwater is the runoff that occurs during rain events, or from melting snow and ice. Runoff occurs primarily from impervious surfaces such as paved roads, driveways, parking lots, sidewalks, and roofs. Runoff, to a lesser degree, is also generated by pervious surfaces such as lawns, parks, and agricultural land. It should be noted that when properly engineered, the stormwater runoff from developed sites (e.g., a residential subdivision) may be less than the pre-development runoff (e.g., an overgrazed pasture with compacted soils and minimal vegetative cover).
COLLECTION AND CONVEYANCE
Stormwater travels across lawns and roadways until it is channelized in gutters, ditches, channels, or streams. Roadway curb and gutter is an integral part of the stormwater collection system. Due to the crowning of the roadway, rainwater that lands on the road surface travels to the edge of the road where it is conveyed in gutters. The stormwater then travels in the gutters until it is intercepted by an inlet (Figure 5.22). Inlets are spaced such that stormwater does not accumulate and spread too far into the travel lanes and thereby create a safety hazard (Figure 5.23). They are also placed at intersections, before bridges, and in other locations to prevent crossflow of stormwater across pavement. Inlets come in several shapes and sizes depending on the flowrate and velocity of water to be intercepted.
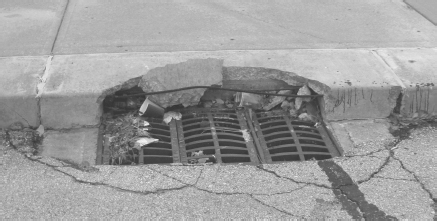
Figure 5.22 A Stormwater Inlet Inset into the Curb and Gutter of a Street with Debris Accumulated from a Storm. If inlets are not periodically cleaned of debris they will clog, preventing stormwater removal from the street surface. This picture also graphically illustrates the term “crumbling infrastructure ” note the broken concrete over the inlet and the cracked pavement.
Source: P. Parker.
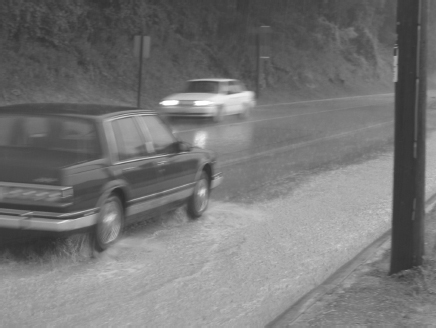
Figure 5.23 Spread of Stormwater into the Driving Lane During an Intense Rainstorm. Note that the car in the foreground is forced to cross into the oncoming traffic lane.
Source: M. Penn.
Photo of Eroded Outfall
Once intercepted by an inlet, stormwater is conveyed in conduits called storm drains or storm sewers. Most often, stormwater systems flow by gravity, although in some cases pumping stations are necessary. Unlike a sanitary sewer system that conveys all wastewater to a single WWTF, stormwater conveyance systems include many points of discharge (outfalls). Outfalls may discharge directly into surface waters (e.g., rivers and lakes) or onto land for conveyance by overland flow (in which case the outfall should be armored with a rip-rap apron to minimize erosion, Figure 5.24).
Although storm sewers are effective in the sense that they convey water away quickly from the point of generation, this benefit is also a drawback. Such rapid conveyance increases the peak flowrates in streams that receive the stormwater that may result in flooding. In addition, the channelization of stormwater into concrete, plastic, or steel pipes does not allow the stormwater to infiltrate into the groundwater as it may have done before development. Moreover, traveling in natural grassed waterways also removes some contaminants from the stormwater, which does not occur in pipes.
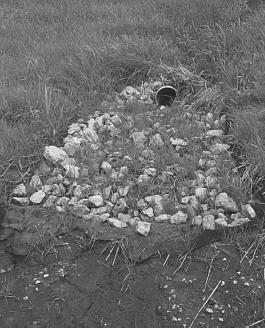
Figure 5.24 A Storm Sewer Outfall During Dry Conditions with an Inadequate Erosion Control Apron. Note the erosion (exposed soil) in foreground beyond the rip-rap.
Source: M. Penn.
CULVERTS
Culverts are used to transport channelized runoff under roads or structures (Figure 5.25). They may be the equivalent of short sections of storm sewer, or may be concrete structures called box culverts (Figure 5.26).
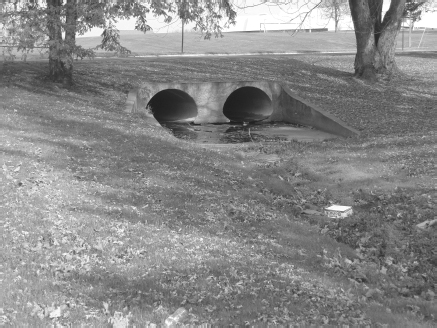
Figure 5.25 Two Corrugated Metal Culverts. These twin culverts (encased in concrete at entrance and exit ends) allow stormwater to pass under a street. Note the elliptical shape that allows more flow than a circular pipe of the same height.
Source: M. Penn.
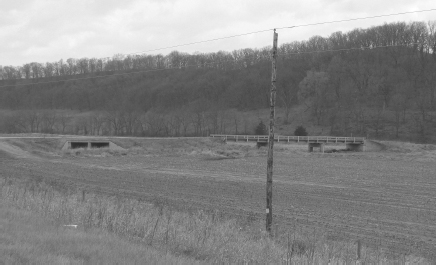
Figure 5.26 A Dual Box Culvert (Left) Adjacent to a Bridge That Spans a River. The box culverts are located in the floodplain, and provide additional passage of water under the road during flood events.
Source: M. Penn.
STORAGE
The excess runoff that often accompanies land development needs to be temporarily stored. The necessity for storage is illustrated by Figure 5.27, which shows three hydrographs. Each hydrograph demonstrates that in response to a storm, the flowrate increases and then tapers off after the end of the rain event. The “pre-development” curve represents the flow of stormwater before development (e.g., before converting agricultural land into a commercial area). As a result of development, the peak flowrate has increased, due to the increased runoff from the newly added impervious area ( “post-development” curve). Note also that the time of occurrence of the postdevelopment peak flowrate is sooner than the pre-development peak flowrate because the runoff travels faster across impervious surfaces as compared to pervious surfaces. As shown by the third hydrograph, if some storage, in the form of a detention pond, is used to capture the stormwater before releasing it to the stream, the peak flowrate can be reduced to match the peak flowrate that occurred before development.
A hydrograph is a graph of flowrate(the volume of flow passing a certain point in a given amount of time, expressed in gal/min or ft3/s) as a function of time.
Figure 5.27 Hydrographs Demonstrating the Effect of Stormwater Detention on Runoff.
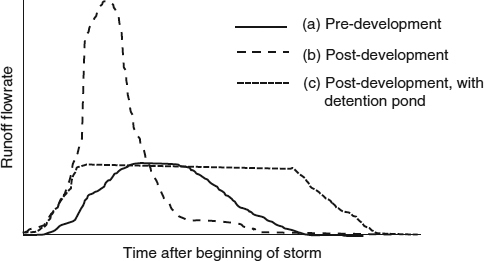
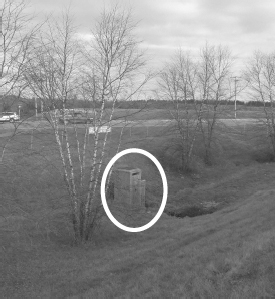
Figure 5.28 A Stormwater Detention Pond. Such ponds store and slowly release stormwater runoff. The concrete structure (circled in photo center) is the outlet structure. Openings in the concrete are sized to release the pre-development flowrate.
Source: M. Penn.
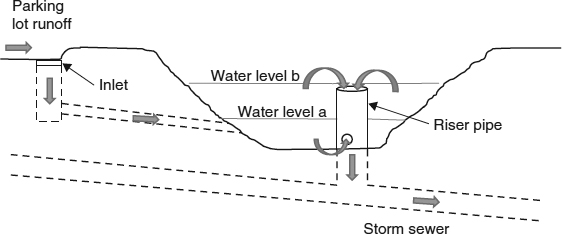
Figure 5.29 Profile of a Detention Pond and Typical Outlet Structure (Riser Pipe) for a Parking Lot. Stormwater is captured by an inlet and flows into the detention pond as shown. For small storms, the level of the water in the pond corresponds to “water level a,” and the stormwater exits the pond to the storm sewer through the small circular opening at the bottom of the riser pipe. For larger storms, the level of stormwater in the pond corresponds to “water level b,” and stormwater exits the pond through the top of the riser pipe as well as the small circular opening at the bottom. Note that without any detention pond, stormwater from the parking lot would go directly to the storm sewer at higher flowrates.
The area under a hydrograph represents the volume (e.g., cubic feet, gallons, cubic meters) of stormwater runoff. Examining Figure 5.27 reveals that, in addition to increasing peak flowrates, land development also increases the volume of runoff. Also note that the area under the “post-development” curve is the same as the area under the “post-development, with detention pond” curve. This implies that the detention pond does not lessen the volume of runoff leaving the site (other than minor losses through evaporation and perhaps some infiltration) as compared to not having a detention pond. This is consistent with the concept of a hydrologic budget discussed in Chapter 2, The Natural Environment. The detention pond is designed to decrease the peak flowrate to that of pre-development conditions. The area under the “pre-development” curve (i.e., the pre-development runoff volume) is less than that of both “post-development” curves because of significant pre-development infiltration through pervious surfaces.
Reducing the peak flow is beneficial because high peak flowrates may cause flooding, increase stream bank erosion, and lead to loss of habitat. Constructed detention ponds (Figure 5.28, Figure 5.29) are the most common method of stormwater storage. However, these require significant land area. In highly urbanized areas, underground tunnels or tanks (Figure 5.30) or “cube storage” (Figure 5.31) may be used to temporarily store stormwater.
TREATMENT
Stormwater runoff is a potential source of surface water pollution as it carries litter, debris, soil, nutrients, oil, grease, antifreeze, metals, etc. (Table 5.1). State and local codes are becoming increasingly stringent with regard to treating stormwater before it can be released to lakes, rivers, estuaries, or oceans. Still today, in many communities, little or no treatment of stormwater occurs; thus, a cigarette butt or hamburger wrapper tossed by a litterer out a car window or the used motor oil illegally dumped down a storm inlet will be carried by runoff directly to the receiving body of water.
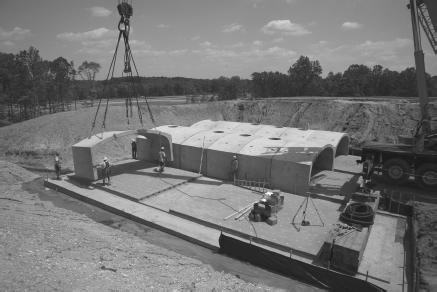
Figure 5.30 Underground Stormwater Storage
Source: Courtesy of Contech Construction Products, Inc.
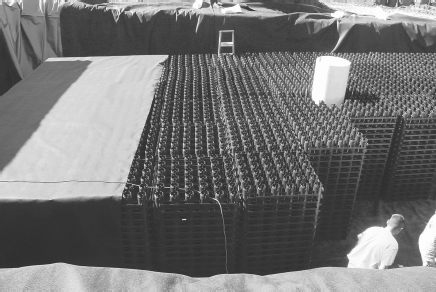
Figure 5.31 Plastic Cubes Providing Structural Support and Pore Space for Underground Storage of Stormwater.
Source: Courtesy of Invisible Structures, Inc.
Table 5.1 Urban Stormwater Pollutants, Sources, and Impacts
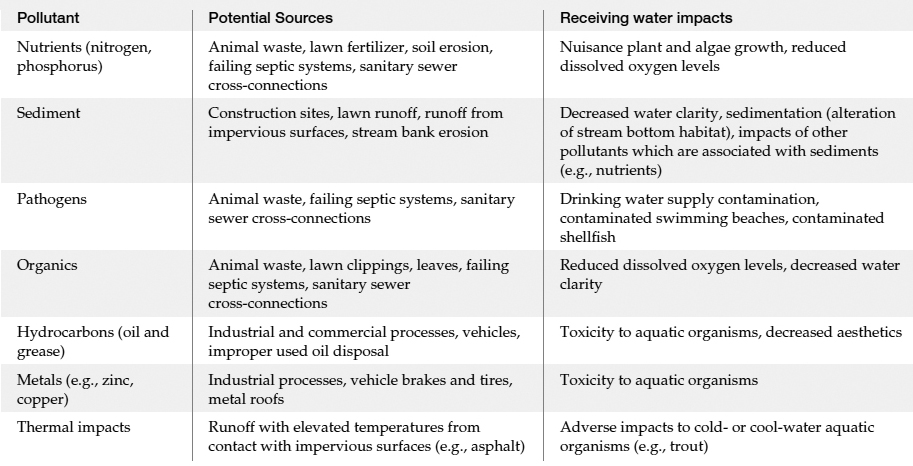
Source: Adapted from Connecticut Department of Environmental Protection, 2004.
There are many methods to treat stormwater and only a few are presented here. Wet detention ponds are constructed reservoirs that have a permanent pool of water at the base (Figure 5.32). They are designed so that stormwater will remain in the reservoir for sufficient time (e.g., 12 hours) to settle out particulate matter (to which many contaminants are attached). Oil/water separators are sometimes required at gas stations and maintenance yards to remove floating contaminants (gas, oil, etc.). Rain gardens (also termed bioretention areas) are landscaped depressions that store, treat, and infiltrate stormwater runoff (Figure 5.33).
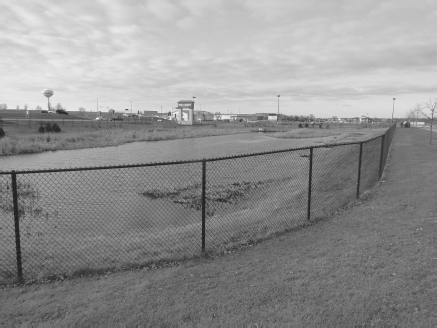
Figure 5.32 A Wet Detention Pond to Store and Treat Stormwater Runoff From a Large Retail Center. Note the fencing in the foreground, which is required for safety reasons.
Source: M. Penn.
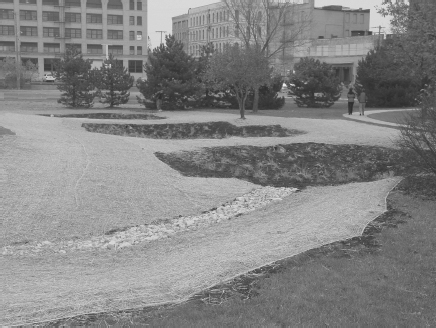
Figure 5.33 A Newly Constructed Bioretention Area. There are three depressions (dark areas with plants) connected with small culverts. The light-colored area surround the depressions has been seeded and covered with biodegradable erosion matting.
Source: M. Penn.
Parks and Recreation (ASCE 2009 Grade: C-)
Parks and recreation are important aspects to the quality of life of many people in urban areas, and are weighted criteria in nearly every ranking of “most livable cities.” Portland, Oregon, and the Twin Cities (Minneapolis and St. Paul) in Minnesota are prominent examples of U.S. cities incorporating large “green spaces” in the midst of residential, commercial, and industrial areas.

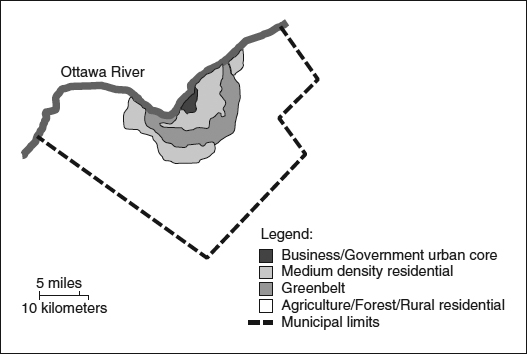
Ottawa, Ontario has a greenbelt (contiguous agricultural and forested land protected from development) that surrounds the city in a “belt” that is approximately 2 miles wide on average (Figure 5.34). In addition to aesthetic and recreational benefits, green spaces can potentially serve as stormwater storage and treatment areas.

Parks that are poorly planned, located, designed, or maintained often experience little public use, whereas some parks serve as major tourist attractions; for example, an estimated 25 million visit Central Park in Manhattan, New York each year.
Property values near parks are typically higher than those of comparable properties located further away. This fact illustrates a major challenge concerning parks—the balance between the value of the park land for potential development (and subsequent tax revenue) versus the public benefit of the land as a park.

Figure 5.34 Ottawa's Greenbelt Surrounds the Urban Core of Development. Newer suburban development is occuring outside the greenbelt.
Central Park
Central Park (Figure 5.35), now considered a model for successful park management, was not always so revered. In the mid-1970s, the Central Park Conservancy President stated, “Years of poor management and inadequate maintenance had turned a masterpiece of landscape architecture into a virtual dustbowl by day and a danger zone by night.” The fact that parks have a positive effect on adjacent property values is dramatically illustrated in Figure 5.36; the real estate value of the land occupied by Central Park is estimated to be over $500,000,000,000.

Figure 5.35 Central Park in Manhattan, New York covers 843 acres.
Source: Copyright © Terraxplorer/iStockphoto.

Figure 5.36 Prime Real Estate Bordering Central Park.
Source: Copyright © travelif/iStockphoto.
Most communities have development ordinances to ensure that additional park space is added as new development occurs. However, if the requirement is based solely on land area (e.g., 3 acres of park per 100 acres of development) and does not include considerations such as location, access, and amenities, the park may go largely unused. Many communities have had great success by linking parks and green spaces with walking/biking trails. At a larger scale, many biking trails exist to link neighboring communities through regional trail systems.
Solid Waste (ASCE 2009 Grade: C+)
Municipal solid waste (MSW) is generated by homes, businesses, institutions and industries. MSW is a “waste” because it no longer has value to the generator. According to the U.S. Environmental Protection Agency (EPA), in 2008, Americans generated about 250 million tons of trash annually, equivalent to an average of 4.5 pounds per person per day. The composition of MSW in the United States is shown in Figure 5.37.
Construction and Demolition Waste
The EPA estimates that 160 million tons of construction and demolition (C&D) waste are generated annually in the United States. This waste often ends up in C&D landfills. In the last decade, significant efforts to reduce, reuse, and recycle C&D waste have been made.
U.S. EPA Recover Your Resources Brochure on C&D Recycling
COLLECTION
MSW is typically collected weekly at curbside from residences. Larger generators (e.g., factories, home construction sites) use dumpsters with pick-up scheduled as needed.
TRANSFER
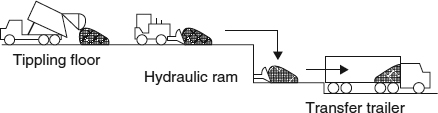
A few decades ago, it was not uncommon for nearly every community to have its own landfill. Today, there are far fewer landfills, and they are typically very large, serving a region rather than a single community. Since curb-side collection trucks cannot cost-effectively transport waste long distances, transfer stations (Figure 5.38) are used. Transfer stations accumulate waste, compact it to a higher density, and transfer it to larger trucks for long-distance hauling. Separation of recyclables often also occurs at transfer stations.
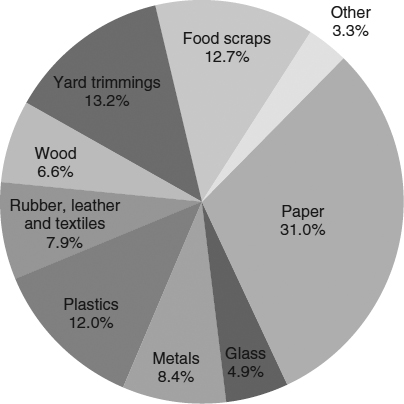
Figure 5.37 Composition of Municipal Solid Waste in the United States, as Mass Generated (Including Recycled Items).
Source: U.S. EPA, 2008.
Figure 5.38 Transfer of MSW from Collection Trucks to Hauling Trucks.
RECYCLING AND REUSE
The “three Rs” of waste reduction are reduce, reuse, and recycle. Recycling is the utilization of the raw material of a waste to produce a new product (e.g., a fleece jacket from plastic soda bottles). Recycling rates in the United States have increased dramatically due to federal, state, and local regulations, as well as due to increased environmental awareness by the public (Figure 5.39). However, the rate seems to have reached a plateau in recent years at 33 percent, and is much lower than the rates achieved in some other countries (e.g., Austria, Norway, Japan), which are approximately 60 percent.
One challenge with recycling is sorting the recyclables from the waste. Some communities have all waste go to material recovery facilities where recyclables and non-recyclables are separated by hand-sorting, magnets, and other mechanical means. Other communities separate as they pick up the waste (curbside sorting) into trucks with bins for each type of recyclable. While most of us think that recycling is a “good thing” and that we should recycle more, the realities of complex and variable markets for recycled materials make it challenging to achieve very high rates of recycling without significant government regulations and subsidies.
Reuse is largely an individual effort. Someone may choose to reuse a baby food jar to store nails on a garage shelf. Donating used furniture and clothing for resale at a local “thrift shop” is another example. “Trash picking” or “dumpster diving” is yet another example.
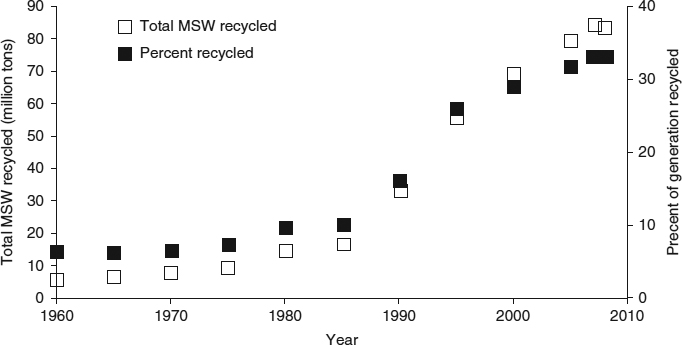
Figure 5.39 Amount of MSW Recycled and Percent of Total Generation.
Source: EPA, 2008.

Figure 5.40 A Composting Site for Yard Waste, Wooden Construction Debris, and Food Scraps. Finished compost is seen in the large pile at left.
Source: M. Penn.
To reduce waste production is the preferred alternative to managing any type of waste (MSW, industrial hazardous waste, etc.). If the waste is not generated, then there is no need to haul, recycle, reuse, or dispose of it.
COMPOSTING
Some people have added a fourth “R” to the three Rs (i.e., “rot ”), which represents composting. Given that much of MSW is organic, the majority of MSW is potentially compostable (food scraps, wood, yard trimmings, paper; Figure 5.37). However, some items that are potentially compostable (e.g., office paper) have a high recycling value and thus may be separated. Also, plastics, although organic, are not compostable (excluding new biodegradable plastics). Most states have banned yard waste (grass clippings, leaves, garden waste) from landfills, which has dramatically increased the number of composting sites (Figure 5.40). If properly managed to ensure complete breakdown and screened to remove litter and debris, compost can be sold at a profit. Many communities allow residents to haul away finished compost for use in home flower and vegetable gardens.
Composting is the aerobic (using oxygen) microbial breakdown of readily decomposable organic wastes to a stable end product (compost) resembling soil.
LANDFILLS
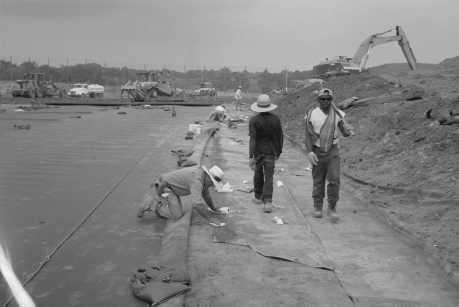
Today's landfills have little in common with the landfills of old (more correctly called “dumps ”), which often were abandoned gravel pits or rock quarries with no means of protecting groundwater from the wastes. Modern landfills are highly engineered systems. Engineers must go through a lengthy and challenging siting process to ensure that the potential for negative environmental impact is minimized and to ensure that the landfill will be a “good neighbor” to nearby property owners. Landfills are lined with plastic geomembranes (Figure 5.41) and clay to prevent contaminant-laden leachate (liquid generated from decomposition of waste and from rainfall) from entering the ground-water. Leachate is collected and pumped from landfills and treated at either on-site treatment facilities, or is trucked or sewered to municipal WWTFs. Landfills are divided into cells, typically with a fill life of a few years. Once filled, the cells are covered (again with geomembranes and clay) to prevent future precipitation from entering and creating more leachate.
Virtual Tour of a Landfill
Freshkills Park (Closed Landfill) Website
Methane is generated during the decomposition of the waste. This methane can be collected and separated from other landfill gases for use as an energy source (Figure 5.42). In some cases, the methane is simply burned (flared) without energy recovery.
Figure 5.41 A Geomembrane Placed Above a Clay Layer at the Base of a Landfill. The kneeling worker is cleaning one sheet of geomembrane (HDPE plastic) in the foreground, preparing it for “welding” to seal the overlapped seam (background).
Source: Courtesy of J. Puls.
Sorting and Disposing of the World Trade Center Debris
Nearly 2 million tons of debris from the 9/11 terrorist attack of the World Trade Centers was sorted in order to separate out human remains, personal artifacts, and criminal evidence. A previously closed landfill was re-opened for staging sorting, and ultimate disposal. The final closure of the landfill after these operations marked the end of solid waste disposal in New York City. More than 3 million tons of residential solid waste is exported from the city annually to landfills as far away as Virginia and Ohio.

Sorting Process Example
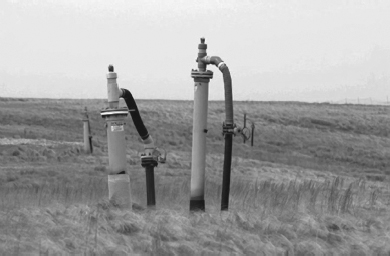
Figure 5.42 Landfill Gas Extraction Well.
Source: EPA Landfill Methane Outreach Program.
INCINERATORS
Incinerators were once quite common at sites of waste generation (e.g., factories, dormitories, and prisons). However, regulations that require treatment of air emissions from incinerators have virtually put an end to the practice of on-site incineration (except for some very large generators such as hospitals). In densely populated areas with high land values (e.g., the Northeast), large-scale incineration of MSW with energy recovery (waste-to-energy) and air pollution control is common. Incineration is also very common in Japan and Europe; in fact, landfilling is now banned in Norway. Incineration reduces the need for large landfills and is more efficient at energy recovery as compared to recovering methane from landfills. Incineration does not eliminate the need for landfills, however; the resulting ash, approximately 20 percent of the original waste mass, is typically landfilled.
Concerns over air pollution remain, and public resistance to new waste-to-energy facilities is often strong. You should realize that engineers can design air pollution control devices to virtually eliminate all pollutants; however, as the removal efficiency increases, so does the cost. There is a saying in environmental engineering that “it only takes 20 percent of the cost to remove 80 percent of pollution, and 80 percent of the cost to remove the last 20 percent of pollution.”
Hazardous Waste (ASCE 2009 Grade: D)
Federal and state regulations have strict definitions as to what is classified as hazardous waste, nuclear waste, or biohazard waste (all being different than MSW). For purposes of this textbook, consider hazardous waste to be any waste containing high levels of toxic, explosive, or flammable chemicals. Prior to the 1970s, these wastes were largely unregulated and were haphazardly dumped and discharged into the environment, in many cases creating significant environmental and public health risks. The generation of hazardous waste has been dramatically reduced due to the high costs required for management and disposal, as well as increased environmental awareness. If not reused or recycled, hazardous wastes must be disposed of either by incineration or in specially designed hazardous waste landfills.
SUPERFUND
In the previous section discussing solid waste, we described the unlined landfills (dumps) of the past. These abandoned gravel pits and rock quarries had no liners and accepted nearly all waste (including waste that today would be classified as hazardous). As a result, extensive groundwater contamination has occurred. It was also common practice prior to the 1970s for industries to (at the time, legally) dump industrial liquid waste into unlined lagoons and ditches. In 1980, the Superfund was created to clean up the most dangerous waste sites. Approximately 1,000 sites have been cleaned up to date, but the list of sites awaiting cleanup includes many more. The EPA estimates that 1 in 4 Americans lives within 4 miles of a Superfund site. The cost per site for cleanup often is millions of dollars. Additional costs are incurred from lawsuits as companies attempt to free themselves from, or lessen their financial responsibility for site cleanup.
The Superfund selection process targets the “worst of the worst.” There are hundreds of thousands of contaminated sites across the United States that are not contaminated “enough” to be prioritized for Superfund. A large percentage of these sites are gas stations, with leaking gasoline and diesel fuel tanks, and dry cleaners, with improperly handled perchloroethylene. Most states have programs to fund and administer the cleanup of these sites. In some cases, the cleanup may be as simple as the removal of the leaky tanks and the excavation of the soil around them (Figure 5.43). In other cases, when the groundwater has been contaminated, lengthy and costly groundwater treatment activities are also required.
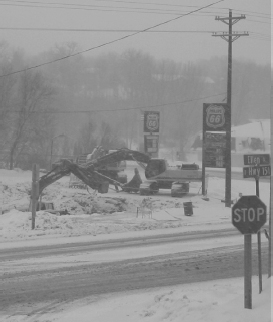
Figure 5.43 Excavation of Contaminated Soil at a Leaky Gas Station Site.
Source: M. Penn.
BROWNFIELDS
Brownfields are sites that are vacant, abandoned, or underutilized because of real or perceived contamination. In many cases, sites are literally abandoned by the owner and left to the city, or lie dormant because potential buyers are reluctant to purchase the property due to the extensive cost of cleanup if the site is contaminated. These properties do not generate significant, if any, tax revenues for the city, yet they are often located in central areas that, if it were not for the real or perceived contamination, would be “prime” real estate. Thus, an incentive exists for cities to have these areas developed. An additional incentive, from the perspective of infrastructure, is that brownfields, by virtue of their centralized location, are served by water, wastewater, and other utilities; thus, developing these sites is preferable as compared to developing at the fringes of the cities, in that the latter will require the expansion of utilities.
Video of Brownfield Success Story (Gretna, Louisiana)
Outro
After reading the last three chapters discussing infrastructure sectors and components, we hope that you are excited by the challenges and opportunities that careers in civil and environmental engineering offer. Now that the major sectors and components of infrastructure have been introduced, the remainder of this book will focus on the technical and non-technical aspects of infrastructure components and systems (of which glimpses were provided in this chapter), preparing you for future courses.
chapter Five Homework Problems
Short Answer
- 5.1 Why is electricity conveyed at high voltages in transmission lines?
- 5.2 Does saltwater intrusion decrease the volume of water in an aquifer? Explain.
- 5.3 How might the level of water in an elevated water storage tank vary over a typical day? Explain.
- 5.4 How are storm sewer outfalls “armored” to prevent soil erosion?
- 5.5 Under what situations does wastewater need to be pumped in a wastewater collection system?
- 5.6 Consider Figure 5.27. Explain why the peaks of the “pre-development” and “post-development, with detention pond” curves are equal to each other.
Discussion/Open Ended
- 5.7 What do you think are some advantages and disadvantages of curbside sorting of MSW?
- 5.8 Some have said that “dilution is the solution to pollution.” What is the logic behind this statement? How does it apply to combined sewers? Do you believe that dilution is sound practice for “treating” wastewater?
Research
Note: For Homework Problems 5.9,5.11,5.13,5.14, and 5.15, the ASCE Report Card for America's Infrastructure is available at www.wiley.com/college/penn.
- 5.9 According to the energy chapter of the latest ASCE Report Card for America's Infrastructure, how resilient is the energy infrastructure in the United States?
- 5.10 How much energy does the United States export? Use the CIA World Factbook (available at www.wiley.com/college/penn) to compare the energy that the United States exports to five other countries of your choice. Explain your rationale for choosing those five additional countries.
- 5.11 Read the drinking water chapter of the latest ASCE Report Card for America's Infrastructure. Based on this chapter, do you think that the near-failing grade is deserved? Explain.
- 5.12 Tabulate the location and dates on 10 hydrants in your city. Summarize your findings with a map.
- 5.13 According to the hazardous waste chapter of the latest ASCE Report Card for America's Infrastructure, what is the link between brownfield redevelopment and tax revenues?
- 5.14 Read the wastewater chapter of the latest ASCE Report Card for America's Infrastructure. What are the largest challenges facing the wastewater sector?
- 5.15 According to the ASCE Report Card for America's Infrastructure, solid waste received one of the highest grades. Read the chapter on this sector and provide some reasons why such a relatively high grade was earned.
- 5.16 Using U.S. EPA data (available at www.wiley.com/college/penn), graph the number of existing MSW landfills over the past two decades. What are some reasons for the decline in the number of landfills?
Key Terms
- activated sludge
- clarifiers
- collectors
- combined sewer overflow
- combined sewers
- composting
- curbside sorting
- digesters
- disinfection
- diurnal variation
- effluent
- flowrate
- force mains
- greenbelt
- headworks
- hydrographs
- infiltration
- inflow
- inlet
- interceptors
- laterals
- leachate
- lift stations
- mains
- non-renewable
- outfalls
- pathogens
- per capita water demand
- pervious
- potable
- primary treatment
- recycling
- reduce
- renewable
- reuse
- saltwater intrusion
- sanitary sewer overflows
- sanitary sewers
- secondary treatment
- sludge
- storm sewers
- tertiary treatment
- transfer stations
References
Connecticut Department of Environmental Protection. 2004. Connecticut Stormwater Manual. http://www.ct.gov/dep/cwp/view.asp?a=2721&q=325704, accessed August 8, 2011.
Environmental Protection Agency (EPA). 2008. Municipal Solid Waste Generation, Recycling, and Disposal in the United States: Facts and Figures for 2008. EPA-530-F-009-021.
Environmental Protection Agency (EPA). Landfill Methane Outreach Program. http://www.epa.gov/lmop/basic-info/lfg.html#02, accessed August 8,2011.
Michelcic, J. and J. Zimmerman. 2010. Environmental Engineering: Fundamentals, Sustainability, Design. Hoboken, NJ: John Wiley & Sons, Inc.
US Department of Transportation. 2010. National Transportation Statistics. http://www.bts.gov/publications/national_transportation_statistics, accessed August 8, 2011.
US Energy Information Administration. Energy Explained. http://tonto.eia.doe.gov/energyexplained/index.cfm?page=electricity_home#tab2, accessed August 8, 2011.
US Energy Information Administration, Gas Transportation Information System. U.S. Natural Gas Pipeline Network, 2009. http://www.eia.doe.gov/pub/oil_gas/natural_gas/analysis_publications/ngpipe]ine/ngpipelines_map.html, accessed August 8,2011.