
Adjusting for Leverage
Leverage is insidious. Suppose I have $100 of my own equity to invest and I supplement that amount with $900 in borrowed funds. That's 9:1 leverage. Colloquially, this is sometimes referred to as nine turns of leverage. I now have $1,000 in working capital. If my investment earns 10 percent, then my dollar return is $100. That's a 100 percent return on my equity. That's the power of leverage. Now, imagine, instead, that my investment lost 50 percent. I now default on my loan but my equity loss is limited to my original $100. Of course, I am abstracting away a few details but the example illustrates how leverage permits me to enjoy all the upside while limiting my downside exposure. Before the credit crisis, U.S. investment banks were leveraged at around 30:1, meaning that every dollar in equity invested was accompanied by 30 dollars of borrowed funds. The historical average was closer to 15:1. By way of contrast, Long-Term Capital Management, at the time of their default, was leveraged about 90:1!
First, some definitions: Leverage is the fraction ω of total working capital that is debt financed:
![]()
This implies that D = ωE/(1 – ω), where D and E are debt and equity, respectively. The leveraged return, ![]() , is the growth rate of working capital, net of financing costs, over equity:
, is the growth rate of working capital, net of financing costs, over equity:
![]()
We can rewrite this to get an expression in returns and leverage as follows. Making the substitution for the definition of D = ωE/(1 – ω) we can show that:
![]()
Here, ![]() is the observed return on equity and
is the observed return on equity and ![]() is the cost of capital. Obviously, an unleveraged position has a return equivalent to the return on equity. The higher leverage is, the smaller is (1 – ω) and the greater is
is the cost of capital. Obviously, an unleveraged position has a return equivalent to the return on equity. The higher leverage is, the smaller is (1 – ω) and the greater is ![]() relative to
relative to ![]() . That suggests an incentive to use borrowed funds. Highly leveraged positions enjoy all the benefits of the upside with none of the risk on the downside. Leverage, in effect, allows us to put other people's money at risk. If we lose it, then we walk away; otherwise, we get the gain, which we don't have to share (we just pay back the borrowed capital).
. That suggests an incentive to use borrowed funds. Highly leveraged positions enjoy all the benefits of the upside with none of the risk on the downside. Leverage, in effect, allows us to put other people's money at risk. If we lose it, then we walk away; otherwise, we get the gain, which we don't have to share (we just pay back the borrowed capital).
Now, what about risk? The variance of the leveraged return is straightforward:
![]()
This is a bit complicated. A spreadsheet will illuminate the relationship between risk and leverage. The one here is copied from the chapter spreadsheet labeled Leverage. To keep things simple, I have assumed that the covariance between the return on equity and the cost of capital is zero and that the cost of capital is constant (zero variance). If so, we get the following leverage adjustments for risk (ignore the liquidity adjustment ρ).
This trade-off is illustrated more clearly graphically in Figure 11.7.
Figure 11.7 Levered Risk
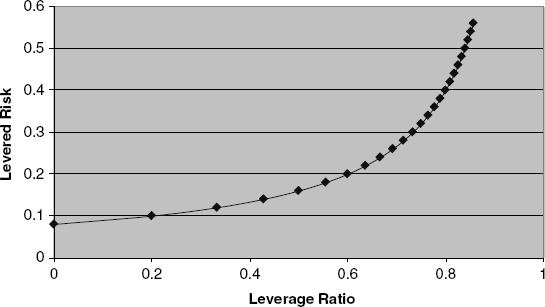
Now, we see the true impact of leverage—it increases risks exponentially. You can use the spreadsheet to experiment with various leverage ratios as well as cost of capital parameters. The bottom line is that leverage escalates downside risk. The lesson here is that if the rest of the market is running unleveraged portfolios with 8 percent returns and 8 percent volatility as shown in Table 11.2, and your portfolio is levered 2:1, in which case two-thirds of working capital is borrowed, then you are operating with the equivalent of 24 percent volatility. Now, think back to our earlier observation that investment banks were running 30:1 leverage. That is equivalent to 248 percent volatility. The relationship derived here between risk and leverage is also known as levered beta. Suppose, for example, that we hold the market portfolio. This portfolio, by definition, will have a beta of one. If we purchased the portfolio with six dollars of borrowed funds for each dollar of our own money, then we have a debt-to-equity ratio of 6:1. Ignoring taxes, the beta on this levered portfolio is:
![]()
Table 11.2 Risk Adjusted for Leverage.
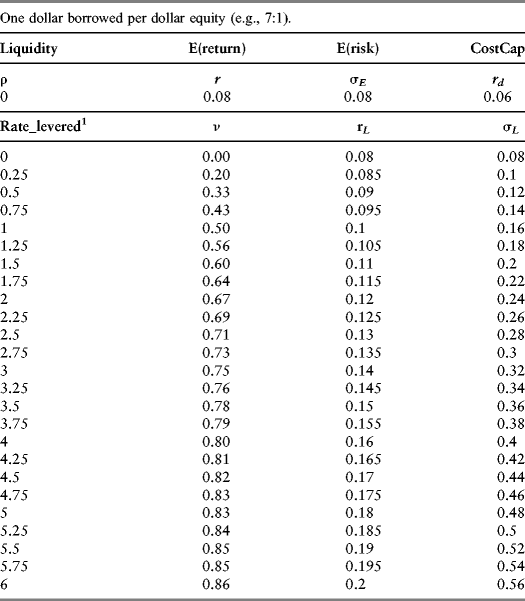
which, in our example, is equal to seven times the beta on the market portfolio. If the market portfolio has volatility equal to 8 percent, then the levered portfolio must have volatility equal to 56 percent, which is exactly what Table 11.2 confirms. Intuitively, if each dollar in equity is matched with a dollar of debt, then levered beta must be twice the unlevered beta. Incorporating taxes represented by the tax rate τ, the levered beta is a bit more complicated but still transparent:
![]()
With these facts in mind, it is important to leverage-adjust the volatility estimate we would be using in our covariance estimates. This task requires a little foresight—a private real estate portfolio that is leveraged six times over needs to be adjusted for this leverage if it is to be compared to an unleveraged benchmark like the NAREIT. On the other hand, most firms in the publicly traded Russell 3000 are leveraged around four or five times. As such, it may be better not to leverage adjust these returns because, if these stocks are publicly traded, their return volatilities probably already show the effects of leverage. My point is similar to the one made at the beginning of this chapter, which is that information on publicly traded assets in high volume markets tend to be more efficient—that is, they aggregate diverse information more completely into reported returns than privately traded assets with low liquidity.