

Appendix: Choosing the Correct Statistic
Overview
This appendix gives a structured approach for choosing the correct statistical approach to use when analyzing data. The choice of a specific statistic is based on the number and scale of the response (dependent) variables in the study considered in conjunction with the number and scale of the predictor (independent) variables. Commonly used statistics are grouped into three tables based on the number of response and predictor variables in the analysis.
Introduction: Thinking about the Number and Scale of Your Variables
Thinking about Your Response Variables
Thinking about Your Predictor Variables
Guidelines for Choosing the Correct Statistic
Single Response Variable and a Single Predictor Variable
Single Response Variable and Multiple Predictor Variables
Introduction: Thinking about the Number and Scale of Your Variables
Researchers are often confused by the task of choosing the correct statistical procedure for analyzing a given data set. There are so many procedures from which to choose that it is easy to become frustrated, not even knowing where to begin. This appendix addresses this problem by providing a relatively simple system for classifying statistics. It provides a structured approach that should make it easier to find the appropriate statistical procedure for a wide variety of circumstances.
In a sense, most statistical procedures involve investigating the relationship between two variables (or two sets of variables). In a given study, the outcome variable that you are interested in is called either a response variable (in nonexperimental research) or a dependent variable (in experimental research). In nonexperimental research, you study the relationship between the response variable and some predictor variable whose values are used to predict scores on the response. In experimental research, a manipulated independent variable is the counterpart to this predictor variable. In general, nonexperimental research involves examining the relationship between a response variable and a predictor variable whereas experimental research examines the relationship between a dependent variable and an independent variable. To simplify matters, this appendix blurs the distinction between nonexperimental versus experimental research, and uses “response variable” to represent response variables as well as dependent variables, and uses “predictor variable” to represent predictor variables as well as independent variables.
Thinking about Your Response Variables
Two of the primary factors that determine the selection of an appropriate statistical procedure are how many response variables you have and the data type (type of measurement or scale) of the response variables. Scale or data type refers to the level of measurement used in assessing these response variables (nominal, ordinal, or continuous).
For example, assume that you want to conduct a study to learn about variables that predict success in college. In your study, you may choose to use just one response variable as an index of college success such as grade point average (GPA). Alternatively, you may choose to use several response variables so that you will have multiple indices of success such as college GPA, college class rank, and whether or not participants are inducted into some college honorary society (yes versus no). Here, you can see the number of response variables varies. In the first case, there was only one response variable; in the second case, there were three response variables.
Notice, however, that the scale used to assess college success also varies. The response variable college GPA has a continuous numeric scale, college class rank was assessed on an ordinal scale, and induction into an honorary society was assessed on a nominal scale. The number of response variables used in the analysis and the data type or scale used to measure those variables helps determine which statistic you can use to analyze your data.
Thinking about Your Predictor Variables
However, you still do not have enough information to choose the appropriate statistic. Two additional factors that determine choice of the correct statistic are how many predictor variables you have and the data type (scale or measurement type) of the predictor variables. Again consider the college success study in which you want to learn about the variables that predict college success. Assume that you decide to use just one response variable as a measure of success—college GPA. You might choose to design a study that also includes just one predictor variable—high school GPA. Alternatively, you could design a study that includes multiple predictor variables such as high school GPA, scores on the Scholastic Assessment Test (SAT), high school rank, and whether the student received a scholarship (yes or no).
Notice that in the previous paragraph, the number of predictor variables that can be included in a study varies. The first study included just one predictor, while the second study included multiple predictors. Note that the scale of these predictors also varies. Predictors were assessed on a continuous numeric scale (high school GPA, SAT scores), an ordinal scale (high school rank), and a nominal scale (whether the student received a scholarship). The number of predictor variables included in your study and the data type (scale of measurement) also helps determine the appropriate statistic.
Putting It Together
The preceding discussion provides context for the following recommendation. When choosing the appropriate statistic for an analysis, always consider both of the following:
- the number and data type (scale of measurement) of the response variables
- the number and data type (scale of measurement) of the predictor variables
For example, suppose you use only one measure of college success (GPA) and one predictor variable (SAT scores) in your study. Because you have a single continuous numeric response variable and a single continuous numeric predictor variable, you know that the appropriate statistic is the Pearson correlation coefficient (assuming that a few additional assumptions are met). But what if you modified your study so that it still contained only one response variable but now contains two predictor variables, both continuous numeric variables such as SAT scores and high school GPA? In that case, it is more appropriate to analyze your data using multiple regression.
To select the right statistic, you must consider the number and nature of both your response and predictor variables. To facilitate this decision-making process, this appendix includes three tables:
- a table that lists statistics for studies that involve a single response variable and a single predictor
- a table for studies that involve a single response variable and multiple predictors
- a table for studies with multiple response variables
A few words of caution are warranted before presenting the tables. First, these tables are not designed to present an exhaustive list of statistical procedures. They focus only on the tests that are considered to be the most commonly reported in the social sciences. A good number of statistical procedures that did not fit neatly into this format (such as principal component analysis) do not appear. Also, these tables do not necessarily provide you with all of the information you need to make the final selection of a statistical procedure. Many statistical procedures require that a number of assumptions be met concerning the data for the procedure to be appropriate, and these assumptions are often too numerous to include in a short appendix such as this. The purpose of this appendix is to help you locate the statistic that might be correct for your situation given the nature of the variables. It is then up to you to learn more about the assumptions for that statistic to determine whether your data satisfy those assumptions.
Guidelines for Choosing the Correct Statistic
Single Response Variable and a Single Predictor Variable
Table A.1 lists some of the simplest (and most common) studies conducted in the social sciences. These statistical procedures are covered in this text, but the list is not exhaustive.
Table A.1 has three columns:
- The first column describes the type of response or dependent variable in a study.
- The second column describes the type of predictor or independent variable in a study.
- The third column describes the statistic that could be appropriate for that study.
For example, the first entry shows that if your predictor variable is nominal and your response is also nominal, it might be appropriate to evaluate the relationship between these variables using the Chi-square test of independence. To understand this, assume that in your study you use one nominal-scale index of college success. You might have chosen “graduation” as this response where the code for the graduation variable is “Yes” if the student did graduate from college and “No” if the student did not graduate from college. Also, assume that you use scholarship status as the one nominal-scale predictor variable in your study, which has the code “Athletic” to represent students who received athletic scholarship, “Academic” for students who received academic scholarships, and “None” for students who received no scholarship. You analyze your data with a Chi-square test of independence to determine whether there is a significant relationship between scholarship status and graduation. If the results give a significant value of Chi-square, inspection of the cells of the two-way classification table might show that students in the academic scholarship group are more likely to graduate than students in the athletic scholarship or no scholarship groups.
The first row of Table A.1 deals with the Chi-square test. The next row describes the appropriate conditions for the Wilcoxon or Kruskal-Wallis tests. Notice that the entry in the Response/Dependent Variable column is ranks derived from ordinal-scale or non-normal continuous variable. This entry indicates that when the response/dependent variable is ranked data, the Wilcoxon test is appropriate if there are only two predictor groups and the Kruskal-Wallis test is used if there are more than two predictor groups.
Notice that in the Type of Analysis column the entry Kruskal-Wallis test is flagged with an asterisk (*). Tests that are flagged with an asterisk are not described in this book. However, flagged statistical procedures can be analyzed using JMP.
Table A.1: Studies with a Single Response Variable and a Single Predictor Variable

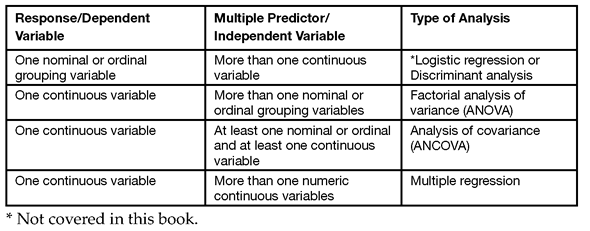
Single Response Variable and Multiple Predictor Variables
Table A.2 lists some procedures that are appropriate when the analysis includes a single response variable and multiple predictors. For example, the last row of the table is for multiple regression. The entry in the Predictor Variable column is more than one numeric continuous variable. The chapter on multiple regression indicates that it is appropriate to use multiple regression to analyze data that included college GPA as the response variable, and SAT scores and high school GPA as predictors. Note how this is consistent with the guidelines of Table A.2.
There is a single continuous numeric response variable (college GPA) and multiple numeric continuous predictor variables (SAT scores and high school GPA).
Table A.2: Studies with a Single Response Variable and Multiple Predictor Variables
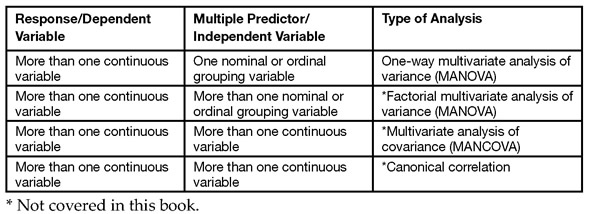
Multiple Response Variables
The Response Variable column in Table A.3 indicates that all of the procedures in this table are appropriate for studies that include multiple response variables. Note, however, that only the last three analytic procedures (factorial MANOVA, MANCOVA, and canonical correlation) involve multiple predictor variables. The first procedure (one-way MANOVA) requires only a single predictor variable on a nominal scale.
Table A.3: Studies with Multiple Response Variables
Summary
This appendix is intended to serve as a starting point for choosing appropriate statistics. You can use the preceding tables to identify statistical procedures that might be appropriate for your research design. It is then up to you to learn more about the assumptions that are associated with the statistic (whether it requires data drawn from a normal population, whether it requires independent observations). These tables, when used in conjunction with the assumptions sections included with chapters of this book, should help you find the right statistical procedure for analyzing the types of data most frequently encountered in social science research.