
Dividing a report body into multiple columns often gives a compact design with an improved look and feel.
JasperReports offers full flexibility of displaying your reports in multiple columns and provides a number of tools to enhance the look of multi-column reports.
In this simple recipe, you will learn how to convert your single-column report into a multi-column report.
Refer to the installPostgreSQL.txt file included in the source code download of this chapter to install and run PostgreSQL, which should be up and running before you proceed. The source code of this chapter also includes a file named copySampleDataIntoPGS.txt, which helps you to create a database named jasperdb7 and copy sample data for this recipe into the database.
- Open the
GroupInGroupMultiColumns.jrxmlfile from theTask1folder of the source code of this chapter. The Designer tab of iReport shows a report containing data in the Title, Customer Group Header 1, Product Group Header 1, and Detail 1 sections, as shown in the following screenshot: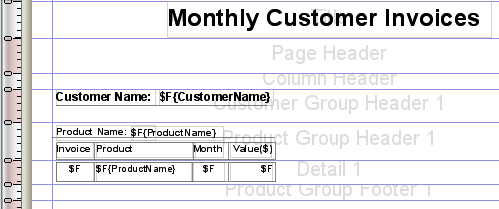
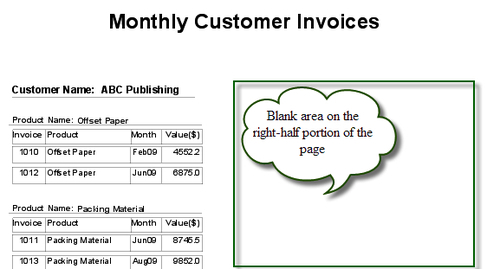
- Switch to the Preview tab and you will see a report with data in tables spanning the left-half portion of the page. The right-half portion of the page is blank, as shown in the following screenshot:
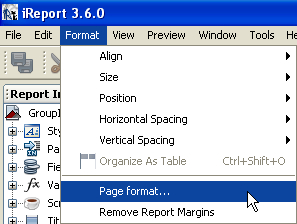
- Switch back to the Designer tab. In order to effectively populate the right-half portion of the page, you must use a two-column format for the report. In the main menu of iReport, click on the Format option. A pull-down menu will appear. Click on the Page format option in the lower portion of the pull-down menu, as shown in the following screenshot:
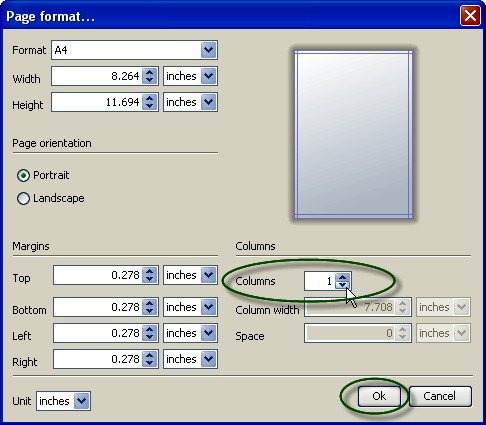
- A Page format dialog will appear. You will notice that the value of the Columns textbox under the Columns section is 1, as shown in the following screenshot. Set its value to 2 and press Ok button.
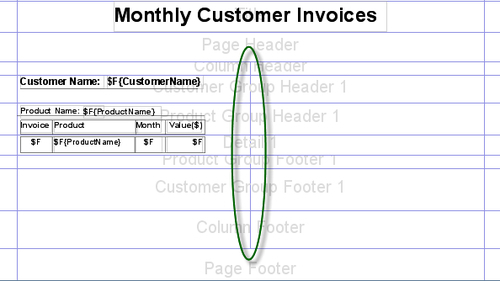
- The Page format dialog will disappear and a vertical bar will appear in your report. The bar will cut the Column Header, Customer Group Header 1, Product Group Header 1, Detail 1, Customer Group Footer 1, Product Group Footer 1, and Column Footer sections vertically, thus splitting the report body into two halves. The vertical bar doesn't cut the Title, Page Header, Page Footer, and Summary sections, as shown in the following screenshot:
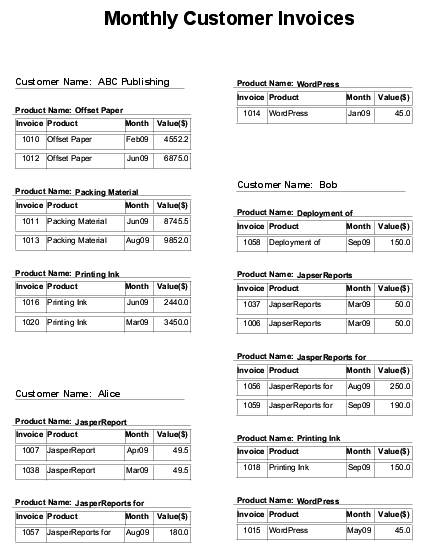
- Switch to the Preview tab and you will see a report with data in two columns, as shown in the following screenshot:
Notice the vertical bar you saw in step 5 of the recipe. The bar has no significance in report designing. This means you can place components on each side of the bar or even right on the bar.
However, the bar is actually a caution sign for you while designing multi-column reports. Notice that you placed all components on the left side of the bar. If you place components on the right of the bar, it will generate an ambiguous display. There will be two major ambiguities in the display:
- Data of the first column (that you put on the right of the bar) will overlap with the data of the second column.
- JasperReports will have no place to display data of the second column (that you put on the right of the bar). So it will just miss that particular bit of data and will not show it anywhere.
You can try dropping something on the right of the bar to see this ambiguity. If you take care and don't place anything on the right side of the bar, JasperReports will handle your multi-column report perfectly even if it spans multiple pages.