While working with multi-column reports, sometimes you need to display multiple groups or chunks of data in separate columns.
JasperReports provides full flexibility of organizing your data in multiple columns. It also provides a number of tools to introduce a column break into your report according to your needs. The requirement is sometimes static, which can be met by using a page break component, while sometimes it has to be decided at runtime.
In this recipe, the JasperReports engine will dynamically decide the location of a column break. The report engine will look for the change of a customer name and as it finds the change, it inserts a column break, thus separating data of one customer from another's.
Refer to the installPostgreSQL.txt file included in the source code download of this chapter to install and run PostgreSQL, which should be up and running before you proceed. The source code of this chapter also includes a file named copySampleDataIntoPGS.txt, which helps you create a database named jasperdb7 and copy sample data for this recipe into the database.
- Open the
GroupInGroupMultiColumns.jrxmlfile from theTask2folder of the source code of this chapter. The Designer tab of iReport shows a report containing data in the Title, Customer Group Header 1, Product Group Header 1, and Detail 1 sections. A vertical bar is also appearing in the report, which is dividing the Column Header, Customer Group Header 1, Product Group Header 1, Detail 1, Customer Group Footer 1, Product Group Footer 1, and Column Footer sections into two equal halves, as shown in the following screenshot: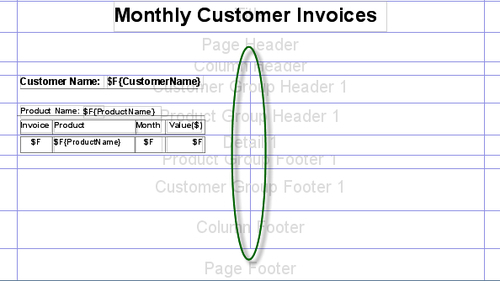
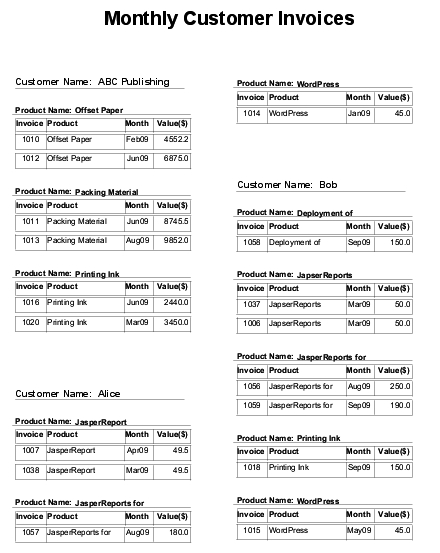
- Switch to the Preview tab and you will see a report with data in two columns. Scroll down to see the complete page. You will notice that each column is displaying data of multiple customers, as shown in the following screenshot:
- Switch back to the Designer tab. Now you will learn how to show the data of each customer in a separate column. Click anywhere on white space inside the Customer Group Header 1 section. Customer Group Header 1 - Properties will appear at the top of the Properties window below the Palette, as shown in the following screenshot:
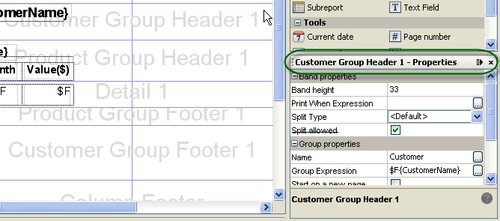
- Scroll down the Customer Group Header 1 - Properties window to find the Start on a new column property. Tick this property's checkbox to change its value to true, as shown in the following screenshot:
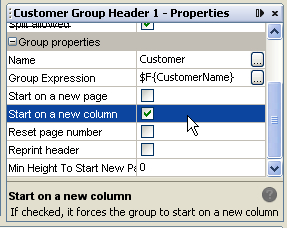
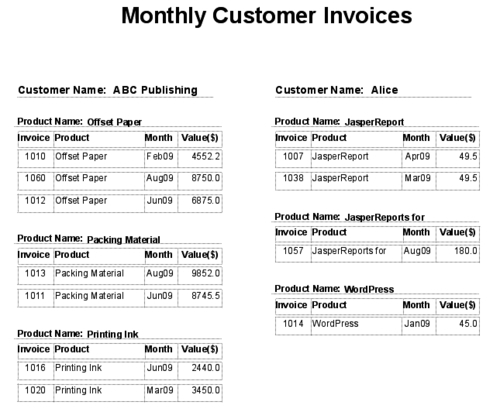
- Switch to the Preview tab and you will see a report with data in two columns. Each column is showing data of a specific customer, as shown below. When the data of a customer ends, JasperReports dynamically inserts a column break and displays data of the next customer in a separate column. Even if the data of a customer spans multiple columns or multiple pages, JasperReports inserts a column break only when the data of a customer ends.