
3
EQUITY FUND SELECTION: THE NEEDLE OR THE HAYSTACK?
The American Association of Individual Investors
Philadelphia Chapter
November 23, 1999
IT IS A VERY SPECIAL PRIVILEGE to be here with you tonight, all the more so because you have graciously agreed to let bygones be bygones and forgive me for the abrupt cancellation of my previously scheduled appearance on November 5, 1995, just four years ago. But since then I've had a change of heart. So here I am.
Some of you insiders may know that I really have had a change of heart. I entered Hahnemann Hospital in Philadelphia on October 18, 1995, to await a transplant, and, after a 128-day wait, received my new heart on February 21, 1996. I hope it will be obvious that my new heart, young and strong, has given me not only boundless energy, but a wonderful outlook on life … qualities that have enabled me to face adversity with a smile, and to put the problems of the past just where they belong—in the past. Given a second chance at life, I accept more enthusiastically than ever before the challenge Kipling laid down for those who “face both triumph and disaster: To treat those two imposters just the same.” So I intend not to dwell on the past, but to look to the future, keeping an eagle eye on the interests of Vanguard, our crew, and our shareholders, and energetically continuing my mission to give mutual fund investors everywhere a fair shake. As I tell our Vanguard shareholders in this year's annual reports: “… I have promises to keep, and miles to go before I sleep. And miles to go before I sleep.”
But it is not my non-appearance before you in 1995 that sets the stage for my remarks this evening, but my previous appearance before the Philadelphia Chapter of AAII. That speech took place on September 27, 1988, in an investment environment that is such a contrast from our current environment as to constitute the difference between day and night, or, more appropriately, between night and day. Since then, we have enjoyed one of the finest economic eras in America's long history, raising the question Cervantes asked 400 years ago: Can we ever have too much of a good thing?1 To tip my hand, I'll tell you later that I think the answer to that question may be “yes.”
Economics and Emotions
Twelve years ago, caution—or even worse—was the watchword for investors. The Dow Jones Industrial average had suddenly dipped by 35%—from 2700 in August 1987 to 1700 in October 1987—with 523 points of the 1000-point drop coming on Black Monday, October 19, 1987. A year later, when I talked to you, the market had retraced but half of the lost ground. It was at this point that Time magazine wrote a frighteningly bearish article (accompanied, of course, with the obligatory illustration of an enormous bear) that I used as the theme of my remarks to you. My talk had this lengthy title, which I pulled from the Time story:
Buy Stocks? No Way! It's a dangerous game. … It's a vote of confidence that things are getting worse. … The market has become a crapshoot. … The small investor has become an endangered species. … The stock market is one of the sleaziest enterprises in the world.
Time reported that the percentage of individual investors with immediate plans to buy more shares had plummeted from 35% at the August 1987 market high to just 3.7% in September 1988. But, both as unshakable optimist and market contrarian, I assured you that, with the Dow at 2080, the article—along with many similar articles I'd read after that Great Crash—was “far more likely to be a sign of investment opportunity than a harbinger of Armageddon.”
A nice prophesy! For that was nearly 9000 points ago. Today the Dow rests, seemingly comfortably, near the 11,000 mark, a mere 450% higher than when I spoke to you then. But, as Time’s survey of investors’ intentions suggested, few investors indeed took advantage of the fantastic investment opportunity that lay before them at that moment. Investors had purchased $25 billion of equity mutual fund shares when stock prices were high during the first seven months of 1987, but liquidated $4 billion of their fund holdings when stock prices were cheap during the first seven months of 1988.
I have spoken often of the clash between economics and emotions in investing. By economics, I refer to the strength of our U.S. economy, the nation's remarkable capacity for innovation and growth, and the resilience of our financial markets. By emotions, I refer to our all-too-human tendency to be frightened at market lows and then brimming with confidence at market highs. Emotions too often stand in the way of our making sensible economic decisions, a counterproductive element in investing that rarely has been more evident than in 1987–1988. That may seem like ancient history to you, but to me it was “only yesterday,” and holds lessons for us this evening that are every bit as relevant as they were eleven years ago.
If the idea is to keep our counterproductive emotions out of the productive economics of investing, there are two key decisions on which investors must focus. One is, of course, the allocation of your investment assets, essentially between stocks and bonds. I can't do much more here than repeat what I said eleven years ago about the proper balance: “It all depends.” It all depends on the magnitude of your accumulated assets, your financial liabilities, your investment goals, your tolerance for risk, your need for income, and your age … perhaps a 50/50 balance as the starting point, less in stocks for a cautious investor age 65 who's just retired; much more—perhaps even 100% in stocks—for a carefree younger investor just beginning with an IRA or corporate thrift plan. But I acknowledged then, and I reaffirm now, that if you think, as Cervantes did, “it is good to keep your nest egg,” you need to take into account not only the risk of investing, but the risk that your emotions may intrude even on the soundest of plans. I confessed then that I could not measure, “your psyche—your patience, your independence, your determination, in all, the strength of both your heart (There, I've said it again!) and your stomach to press on, no matter how compelling the immediate case for abandoning your plan.” But, eleven years later, in a far more bullish environment, those factors remain critical considerations.
A Needle in a Haystack
The other key decision and my main focus tonight will be the selection of common stock mutual funds for your portfolio. And it is here I come to my title theme: “The Needle or the Haystack?” It was Cervantes who warned us, “Look not for a needle in a haystack.” While that phrase has become deeply imbedded in our language, however, it has yet to gain acceptance from most mutual fund investors. Most of us spend countless time and effort poring over fund records, getting information from news articles and television interviews and friends, from hyperbolic fund advertisements and well-intentioned fund rating services. In substance, all of these statistics describe the past returns of mutual funds with decimal-point precision, yet have no predictive power to forecast the future returns a fund may earn. As it turns out, we are looking for a very small needle in a very large haystack.
How likely is it that you will find that elusive needle in the now-3500 stock fund haystack? The chances of picking winning funds or managers are, well, awful. And not because there are a horde of charlatans out there, though there are some. It is because time and again, looking backward leaves us, as the kids would say, “clueless.” And children don't mean that in a complimentary sense. Let me give you some anecdotal evidence.
First, let's take a long-term look at your chances of finding the needle. Following Cervantes’ advice that “honesty's the best policy,” I'll go back thirty years, to the end of 1969, to provide a fair perspective that includes not only the past two golden decades, but the tin decade of the 1970s. There were 355 stock funds in the market haystack at the outset. Astonishingly, 186 of them—more than half—hit the hay, metaphorically speaking, going out of business during the period. Of the 169 funds that remained for our analysis (doubtless, the better performers), the average return was 11.5% per year, 2.1 percentage points behind the 13.6% annual return of the total stock market. (See Figure 3.1.)
Only nine funds beat the aggregate return on the U.S. stock market by more than 1% per year. We'll describe them as the winners. Another 18 beat the market return by less than 1%, and 29 fell short by less than 1%, a group of 47 funds that we can describe, more or less, as market-matchers. That left 113 funds that fell behind by more than 1% annually. We'll describe them as the losers. They include 39 funds which fell more than 3% a year behind the market—poor losers, as it were—including 25 that fell an utterly unacceptable 4% or more behind, and two that actually posted negative returns. (And they're both still in business!)
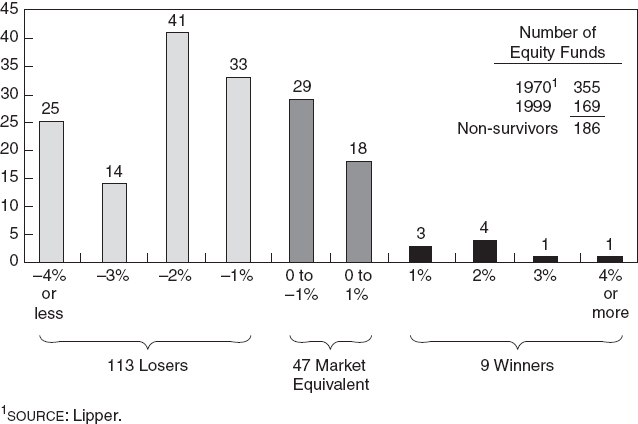
All told, your chances of owning a fund that survived were less than fifty-fifty. If you were one of the lucky ones whose fund made it through the period, the chances it was a loser were seven in ten; the chances it was a bomb, one in four, and the chances it was a winner but one in 19—if we count the number of funds that began the period, only one in forty! The odds of finding the winning needle in the fund haystack were fraught with peril; the odds of finding a losing needle rife; and the odds of losing the needle itself the largest of all.
Can an Expert Find the Needle?
But, you ask, can't the experts help us to pick the winners? The evidence is almost universally discouraging. Let me give you just two examples. One is the highly respected Morningstar Mutual Funds rating service, well-known for its award of “Morning-stars.” They award five stars to the highest-rated funds, one star to the lowest-rated funds. So, playing on Warren Buffett's idea that investment managers should eat their own cooking, let's examine the funds Morningstar initially selected in 1991 as the investment options for the 401(k) Thrift Plan they offer to members of their own staff. Surely, this is where their expertise should find its proudest fulfillment. Indeed, they argue that, “we should know a thing or two about picking funds.” They selected thirteen equity funds, a diverse group that included U.S. large-cap and small-cap funds, specialty and international funds alike—a wide range of choices that gave their employees “an expansive choice of top-rated funds.”
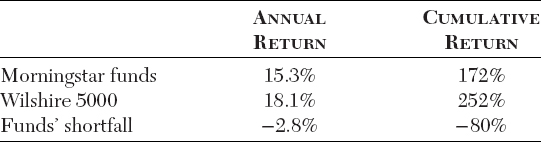
But, alas, the past was not prologue. Despite Morningstar's unarguable expertise, nine of their 13 choices have lagged the market, and their selections have earned an average annual return of 15.3% since the outset—fully 2.8 percentage points per year behind the 18.1% return of the stock market, a cumulative shortfall in return of 80 percentage points (+172% versus +252%). (See Table 3.1.) That performance gap versus the market was even worse than the 2.1 point gap experienced by the fund survivors of the past three decades. Fund selection expertise, it seems, is not so easy to come by.
But if the experts of 1991 fell short of the market by an even larger amount than did the average fund chosen 30 years ago (although we have no way of knowing the results of the 186 funds that failed to survive), the experts of 1993 did even worse. In mid-1993, The New York Times asked five professional financial advisers to select and manage a $50,000 “paper portfolio” of mutual funds, with the goal of outpacing the target chosen by the Times: an index fund modeled on the Standard & Poor's 500 Stock Index. From personal experience, I can tell you that these were anything but fly-by-night advisers. They are competent and experienced, among the best in the field. Yet, by October 1999, some six years later, not a single adviser had provided a return that even came close to the 21% annual return achieved by the target index fund. The fund portfolio of the average adviser provided an annual return of just 13.8%, more than seven percentage points behind. The closing value of the initial $50,000 paper stake The New York Times provided each participant with at the outset: Average adviser, $112,000; Index fund, $164,000. Shortfall: $52,000. What an illuminating test of the challenge of equity fund selection! The experts, once again, proved utterly unable to find the needle in the haystack.
Why So Many Losing Needles? Costs!
What has caused those consistent and ghastly shortfalls of fund returns relative to the market? Fund costs. It turns out that the average fund manager simply matches the market return, before the deduction of costs, and, I should add, before taxes. We now have very good 15-year figures (from Morningstar Mutual Funds) on the impact of taxes, so to reinforce my point, I'm now going to evaluate mutual fund returns during the past 15 years and show you the combined toll that costs and taxes have taken on fund returns. During that period, the market's return was a generous 16.9% per year. Now, let's see the bite that costs took out of it:
- First, fund sales charge costs. Fifteen years ago, most funds were purchased on a “load” basis, with front-end sales commissions then averaging about 6%. Amortized over the period, that cost came to about 0.5 percentage points per year.
- Second, fund opportunity cost. Equity mutual funds typically held cash positions equal to about 7% of assets, earning the short-term interest rate rather than the higher returns available on stocks. Result: a return sacrifice of about 0.6 percentage points per year.
- Third, fund transaction costs. Portfolio turnover costs that funds incurred in buying and selling stocks amounted to at least 0.7 percentage points during the period. (These costs are not disclosed to investors.)
- Fourth, fund operating costs. Fund expense ratios—management fees and other operating expenses, all charged against fund returns—came to 1.2 percentage points per year.
Together, these costs come to 3.0 percentage points annually, exactly equal to the 3.0 point gap—13.9% between the average fund's reported return of 13.9% and the 16.9% return of the stock market. That gap is not materially different from the 2.1% gap over the past 30 years and the 2.8% gap of the Morningstar retirement plan, and less than one-half of the shortfall of The New York Times–selected advisers. So we're seeing some fairly consistent, if not conservative, data.2
The message: In a stock market in which prices are established by the interaction of smart buyers and smart sellers—fund managers, pension managers, financial advisers, stockbrokers, and certainly most individual investors—the average fund manager proves to have average stock-picking ability, a finding that falls well short of astonishing! Nonetheless, even the fund manager who beats the market by 3% per year before costs—no mean achievement—would end up, after costs, with only average returns. And, the manager who wins by 3% before costs must be counterbalanced by another manager who loses by 3%. So the loser ends up, after costs, falling behind the market by 6% per year. The appalling, yet unarguable, asymmetry of that example—that some of the biggest winners merely match the market and some of the biggest losers are left in the dust—helps to explain why, after all those costs, there are so few winning needles in the haystack.
To make matters worse, unlike the funds themselves, most fund shareholders incur yet another cost—a fifth deduction from returns—and it is large indeed: The taxes paid to the Federal government and to state and local governments on fund dividends and distributions. The heavy turnover of fund portfolios results in the realization of both long-term capital gains, now taxable at a maximum of 20%, and short-term capital gains, taxable at the full income tax rate of up to 40%. For funds held directly in taxable accounts by investors—the majority of fund investors—taxes reduced fund returns by 2.7 percentage points annually during the period, roughly doubling the costs of fund ownership that I showed you earlier. Fund portfolio managers by and large ignore the tax consequences of their decisions. But fund investors cannot afford to ignore taxes: You must pay them. With this extra reduction in the returns published by the funds, the average equity fund delivered a net annual return, after costs and taxes, of 11.2% to investors during the last 15 years, just two-thirds of the pre-tax market return of 16.9%. The odds of finding the needle in the haystack that represents the winning fund, then, are actually worse—far worse—than I've indicated.
Invest in the Haystack
If finding a needle in the fund haystack is so difficult, what sensible course of action is available to fund shareholders? The answer is as straightforward as it is simple: Stop trying to find the needle. Invest in the haystack. Own the entire U.S. stock market. Today, that is as easily said as done.
I'm speaking, of course, of the all-market index fund. A number of these funds are available today, targeted to the Wilshire 5000 Equity Index of all publicly held stocks in the U.S. (There are actually some 8000 such stocks, but these funds basically own the largest 2000 stocks, which account for about 98% of the $14 trillion market capitalization of the Index.) Visualize 75% of the assets of such a fund as being invested in the 500 large-cap stocks that constitute the Standard & Poor's 500 Stock Index, and 25% invested in the mid- and small-cap stocks that constitute the remainder of the market. A fund that tracks the 5000 Index truly is the U.S. stock market. The all-market index fund represents complete diversification, the ultimate response to Cervantes’ warning: “Do not venture all your eggs in one basket.” It is the haystack we ought to have been looking for all along rather than seeking out those impossibly few needles hidden deep within it.
Of course, the all-market fund would incur costs and taxes, so let's see how much of the return of the market itself it can capture. We'll compare its costs with those of the actively managed funds I've just described:
- First, no sales commissions. Most all-market funds are available on a no-load basis.
- Second, there is no opportunity cost. The fund is always 100% invested in stocks.
- Third, no (or only minimal) transaction costs, since stocks are bought and held, essentially forever.
- Fourth, low expenses. No advisory fee need be paid, since an investment manager is unnecessary. Operating expenses of 0.2% or less have proven to be feasible.
- Fifth, low taxes, estimated at 0.9% over the past 15 years, which consists primarily of taxes on net dividend income and, given the funds nominal turnover, on the minimal realized capital gains that result from corporate acquisition and mergers.
To make a long story short, the stock market's annual return averaged 16.9% during the past 15 years. The average fund, net of its costs and taxes, earned an annual return of just 11.2%. A no-load, low-turnover, low-cost all-market index fund, after its estimated costs and taxes, would have earned a return of 15.8%—a truly staggering enhancement of 4.6 percentage points per year.
This difference, compounded, has a staggering impact on capital accumulation. Assuming an initial investment of $10,000 in 1984, the value of the average equity fund in late 1999, after costs and taxes, was $49,000. The final value of the same investment in the all-market index fund would have been $90,000. Nearly twice as much capital accumulated. Therefore, twice as much retirement income and a more comfortable life. It would have been nice if the average fund had merely matched the market. And garnering the market's return shouldn't have been too much to ask.
Follow the Money
Now let's follow the money. In the active fund, the sales commission consumed 6% of your capital. Opportunity cost ate up 7%; transaction costs 8%; and management costs 12%. Taxes—largely unnecessary—confiscated 20%. All told, 53% of the market's return was consumed by our financial market and tax system, leaving but 47% for the investor—who, much more than incidentally, put up 100% of the capital and assumed 100% of the risk. It doesn't seem fair … and it isn't. And there is a better way. In an all-market index fund, the financial system consumed just 2%, and taxes 11% of your capital, leaving 87% for the investor—nearly twice as much as the 47% left by the average equity mutual fund.
Simply by cutting excessive equity fund costs to the bare-bones level, index fund investors (a) virtually assure themselves that the fund they select will endure, surviving the vagaries of time that have carried so many funds to an early grave; (b) substantially eliminate the huge risk of selecting a losing fund; (c) relinquish only the tiny opportunity of selecting a winning fund; and (d) assure themselves of nearly 100% of the market's annual return. Given this balance of risk and return, it's hard to justify the search for a hard-to-find needle when, right before our very eyes, the huge haystack lies in full view.
What's To Be Done?
I imagine that most of you now own neither an all-market index fund nor its near-equivalent cousin, an S&P 500 index fund. (Their long-term returns have been nearly identical.) But it seems to me quite clear that most mutual fund investors—and nearly all taxable fund investors—should cease and desist from their efforts to find the needle in the haystack. Why bother seeking to select future fund winners when the odds against success are so awesome and the consequences of failure so grave? Sure, it may take a leap of faith to give up the traditional search for the needle in favor of an investment in the haystack. But, as Cervantes warned us, “Faint heart ne'er won fair lady.”
I quickly add even those with stout hearts must look carefully before they leap. The leap ought to be easy for taxable equity fund owners who want to use the index fund as a repository for new money; and those who own equity funds which they can sell and realize little or no capital gains. (Given some combination of poor fund performance and large taxable capital gains already realized and distributed, a misguided fund strategy the penalty for which their shareholders have already paid, there are many such funds.)
Stout-hearted investors who hold their fund shares in tax-deferred thrift plans and IRAs should also consider this great leap forward. While the clear tax advantage of index funds is of no special value to investors in tax-deferred programs, the other advantages of index investing remain; if they are less compelling, they are quite compelling enough on their own. For taxable investors who hold fund shares with substantial unrealized capital gains, however, a faint heart is an asset. Look before you leap. If your fund holding has a current value of $10,000 and a cost basis of $5,000, its liquidation would cost you $1,000 in taxes; fully 10% of your assets going directly to Uncle Sam. It would clearly take some years for the cost and tax advantages of index funds to compensate you for that loss.
But all investors should recognize the reality that a well-administered, no-load, low-cost, low-turnover, all-market index fund is the most sensible way to give up the search for the needle and own the haystack. In today's perhaps overly optimistic and highly volatile stock market, however, a second question quickly follows: Is it a good idea to invest in stocks today? Put another way, is today a wise time to own the haystack?
Owning the Haystack Today
Let me appraise the current level of the stock and bond markets by contrasting today's fundamentals with those that prevailed when I last spoke to you in September 1988. As for stocks, the Standard & Poor's Index was then at 270, a price that was equal to 12 times its earnings. The yield on the Index was 3.5%, and its earnings were to grow at 7.1% annually (from $23 per share in 1988 to $48 in 1999). Thus, the fundamental return on the Index—the portion of its annual return determined by earnings and dividends—totaled 10.6%, a measure that I call its investment return. Since 1988, its price has risen from 12 times earnings to 29 times, a change that measures what I call its speculative return. This increase in the price-earnings ratio—the change from post-1987 pessimism to pre-2000 optimism—has alone tacked an additional 8.3 percentage points per year onto the investment return, bringing the market's total rate of annual return to 18.9% during the period. (To illustrate the profound impact of this speculative return, had the price-earnings ratio merely remained at 12 times, the S&P Index today would be valued at 580, rather than at 1400—an 820 point difference. That is, the speculative return has accounted for nearly 75% of the 1130 point increase in the level of the Index.)
What might be a realistic expectation for the coming decade? We begin with today's 1.2% yield; then let's assume a solid earnings growth of 8% a year, even higher than the 7.1% growth since 1988. (Future earnings growth could be higher, or lower; in a heavy recession, earnings could even decline.) That's a 9.2% return, before we factor in the price-earnings multiple, which is at an all-time peak today. Let's assume it might ease back to 20 times. (It could remain unchanged; it could even rise. The long-term norm has been 15.5 times.) That change would knock 3.7 percentage points off the market's return, bringing it to 5.5%—even less than the plus-7% return available on high-grade bonds today. (I know that stocks have rarely provided lower returns than bonds over a decade; but I remind you that the stock market is not an actuarial table.) After all that we investors have been given in the fabulous bull market, it would be hard to feel crestfallen if such an economic return is all that the stock market gives us. However, if the economics of the fund industry remains intact, fund costs of 2.5% per year would cut the return of mutual fund investors to a measly 3.0%, a 45% slash in the return of the stock market—and before taxes at that—that would make future fund performance hard to swallow.
I've been around too long to describe that baneful forecast as a prediction. None of us is wise enough to be confident about the level of future market returns. But it is a projection of what the stock market will provide under a set of expectations that are far from irrational. The point is that market returns are determined by both investment factors—the fundamentals of the initial dividend yield on stocks plus the rate at which their earnings grow—and by speculative factors—the change in the price that investors will pay for each $1 of corporate earnings. If you disagree with my numbers, simply determine your own realistic expectations for earnings growth and for the final price-earnings ratio, and arrive at your own projection. But never forget that, while the parameters of the investment element of returns are set by the laws of economics, the parameters of the speculative element are bounded only by the whims of our emotions.
Bogle and Buffett Agree … But to What Avail?
For those who believe that, in Cervantes’ words, “there are no limits but the sky,” my projections will seem low. But at least recognize that I'm in good company. No less an investment icon than Warren Buffett, using an analysis similar in many respects to my own, recently cautioned that “investors in stocks these days are expecting far too much. … The fact is that (while) markets behave in ways that are not linked to value, sooner or later value counts.” He sets “some reasonable expectations … GDP (the U.S. gross domestic product, a measure of how much the U.S. economy produces) grows at an average of 5% per year … interest rates (remain steady or rise) … the importance of dividends to total return is way down” and comes up with a future return on stocks of 7% per year. Mr. Buffett then reduces this return by one percentage point—an estimate “on the low side, of the frictional costs investors bear, which includes [just as I did earlier] a raft of expenses for the holders of equity funds,” and concludes that “the most probable return would be 6%,” soberly adding, “If it's wrong, I believe that the percentage is just as likely to be less as more.” CAUTION: The fact that Buffett and Bogle agree is hardly proof positive that we know the answers. But perhaps our long experience, seasoned with some wisdom about realistic expectations for the stock market, may be worth factoring into your own thought process.
Let me turn now briefly to the bond market. (By the way, I happen to believe that the advantages of owning the haystack represented by a total bond market index fund vastly outweigh the long odds against finding the needle represented by a winning bond fund. The costs of owning most—but not quite all—bond funds is, well, unconscionable.) When I last spoke with you eleven years ago, the interest rate on a 10-year U.S. Treasury bond was 8%, indicating, net of the then-4¾% inflation rate, a real return of 3¼%. Today, the yield on a comparable bond is 6%, or, net of our present inflation rate of about 2%, a real return of 4%. Bonds were pretty good investments—though not as good as stocks—when I spoke to you then; they would appear to be even better investments now.
Why? Because the relationship between potential stock returns and potential bond returns has changed substantially since I talked to you in 1988. Then, the earnings yield on stocks (the inverse of the price-earnings ratio of 12 times) was about 8.4%, slightly more than 100% of the 8% yield of the 10-year Treasury. Today, the earnings yield on stocks is 3.4%, only 55% of the current 6% Treasury bond yield. This is essentially the relationship that has Federal Reserve Board Chairman Alan Greenspan worried about the stock market—though he has been wrong so far. But, given that stocks carry higher risk than bonds, this disparity suggests that today seems more a time for caution than for unbridled optimism.
In my 1988 speech to you, at a time of pessimism, I called your attention to, “the great paradox of the stock market: when stock prices are high [as they are now], everyone wants to jump on the bandwagon; when stocks are on the bargain counter [as they were then], it seems difficult to give them away.” Just as I urged you then not to get carried away with pessimism, so I urge you now not to get carried away with optimism. The best strategy is to hold a sound balance of stocks and bonds, a balance that fits your own situation, the better to “stay the course” no matter what transpires in our ever uncertain and unpredictable financial markets. Cervantes, once again, had it right: “Fore-warned is forearmed.”
1. In Don Quixote, Cervantes gave us an astonishing variety of phrases that have enriched the lexicon of investors. I've used eight of his most familiar sayings in this talk, setting them apart in boldface type in the printed version of these remarks.
2. NOTE: Like the 30-year analysis, the 15-year data includes only the 384 survivors of the period; 70 of the 454 funds that began the period failed to survive.