
5
BUY STOCKS? NO WAY!
OR
IT'S A DANGEROUS GAME. … IT'S A VOTE OF
CONFIDENCE THAT THINGS ARE GETTING WORSE. …
THE MARKET HAS BECOME A CRAPSHOOT. …
THE SMALL INVESTOR HAS BECOME AN ENDANGERED
SPECIES. … THE STOCK MARKET IS ONE OF THE
SLEAZIEST ENTERPRISES IN THE WORLD.
The American Association of Individual Investors
Philadelphia Chapter
September 27, 1988
I HAVE GIVEN my remarks this evening this rather long title to convey to you a clear picture of the low repute in which common stocks find themselves today. My title is simply the headline from an article that appeared in Time magazine dated September 26, 1988, and a collection of excerpts from the story. And it suggests that, if there is any substance whatsoever to the theory of contrary investing, today is far more likely to be a time of investment opportunity than the harbinger of Armageddon.
Buttressed by a chart (illustrated with an enormous bear) showing that the percentage of individual investors with immediate plans to buy more shares has dropped from 35% at the market high in August 1987 to 3.7% in September 1988, the Time article is one of a proliferating series of articles in the press purporting to analyze the equity environment in the year following the great stock market crash of October 19, 1987. It illustrates not only that investors have lost their appetites for stocks, but why they have.
There are, of course, infinite examples of this change. One of my favorites is the recent disappearance of the NBC “Before Hours” financial news program. A year ago, I (and doubtless many others) turned on our television sets each day at 5:45 A.M. to hear how Tokyo closed, how London opened, and, from seemingly omniscient Wall Street Journal reporters, how New York would behave just a few hours hence. Indeed, I was interviewed on “Before Hours” in NBC's New York Studio a few days after the Great Crash (providentially, I advised investors not to panic, and to stay the course), so it was especially poignant for me to witness the program's apparent recent demise. It has been replaced by a show with bouncy music and three rather lithe, leotard-clad young ladies exercising perhaps a million television viewers through their “Morning Stretch.” The stock market and its bouncy peregrinations seem a long way away!
Investor purchases of mutual fund shares are also a long way away from year-ago levels. During the first seven months of 1987, investors purchased $46 billion of equity mutual funds (often at what proved to be inflated prices). During the first seven months of 1988 (with stocks at more realistic valuations), total purchases had dropped to $16 billion, a 65% decline. Net cash flow into equity funds (investor purchases minus redemptions) had dropped even further, from an inflow of $25 billion in the first seven months of last year to an outflow of $3½ billion this year, a chilling decline of 115%.
These figures are just one more manifestation of one of the great paradoxes of the stock market: When stock prices are high, everyone seems to want to jump on the bandwagon; when stocks are on the bargain counter, it almost seems difficult to give them away. Clearly, the Great Crash has caused a lot of otherwise rational investors to abandon the stock market. While I am the first one to agree with the old adage, “If you can't stand the heat, stay out of the kitchen,” it seems to me that sensible, patient long-term investors should continue to stay the course today, just as I urged in my cameo television appearance at the depths of last October's decline.
The Great Crash and Its Aftermath
In this context, it might be useful to consider just why the Great Crash transpired. Writing just two weeks thereafter, in our Windsor Fund Annual Report for the fiscal year ended October 31, 1987, I said this to our shareholders:
Investors ask, fairly enough, “What caused the market to plummet?” We think that three factors were involved: (1) stock prices simply got “too high” relative to their underlying earnings and dividends, especially in competition with the sharply higher yields available on fixed-income securities; (2) there was some deterioration in the economic outlook, with no progress being made to reduce the Federal budget deficit, no improvement in our international trade imbalance, and a whiff of inflation in the air; and (3) the decline that was set in motion by the first two factors was greatly accelerated by “program trading” in the stock index futures market, where massive computer-driven sales took place in an effort to provide “portfolio insurance,” a misnomer if we have ever heard one.
Now, with the perspective of almost a year, I don't believe that I can add very much to that thumbnail analysis.
Today, of course, these conditions no longer exist. The common stocks that comprise the Standard & Poor's Index are selling, not at 23 times earnings (a level that has consistently marked major peaks in equity prices) as at the August 1987 highs, but at about 11 times, a relative improvement in value of 50%. (The present price-earnings ratio, in fact, is also well below the long-term average of 14 times.)
If our Federal budget deficit is in the same dismal state as a year ago, an optimist can imagine that once the November elections are history, it is at least conceivable that our legislators and our new President can begin to take a few steps toward fiscal sanity. Of course, the trade deficit trends have improved substantially, and the dollar has strengthened in international markets. And some early signs of a slowing in the economy could mean that inflationary pressures could in fact be more moderate than anticipated by market participants.
Portfolio insurance, a major factor in making a bad market situation worse, indeed bringing us to the edge of chaos, failed to live up to the expectations of those who considered it a panacea. The amount of assets invested under such schemes has dropped, it is said, from some $60 billion to $10 billion, reducing its mischief-making potential by more than 80%. Anyone who thought seriously about portfolio insurance knew as a certainty that it would not work when changes in stock prices were discontinuous. The issue is hardly either complex or novel, and was spelled out clearly in James Gleick's book about scientific theory entitled Chaos, written long before the crash, explaining what he called “the Noah effect”:
The Noah effect means discontinuity: When a quantity changes it can change almost arbitrarily fast. A stock market strategy is doomed to fail if it assumes that a stock has to sell for $50 at some point on its way down from $60 to $10.
In any event, we have witnessed significant turns for the better in each of the three principal areas that troubled us a year ago: (1) market valuations; (2) the economic outlook; and (3) participation in portfolio insurance.
Stock Values vs. Stock Prices
In our 1987 series of Vanguard Fund Annual Reports, we presented a chart showing the relationship of stock prices to book values and dividends since 1960. It made the perhaps obvious point that although prices are exposed to interim, transitory, and even frightening fluctuations, over the long term they are determined by fundamental factors such as book values and dividends, both of which have risen at a remarkably steady rate over the years. In fact, during the 1960–1987 period, dividends on the Standard & Poor's 400 Index rose by +320%, replacement book value rose by +750%, and price rose by 370%. Put another way, the underpinning for the average annual increase in stock prices of 6% during this period of nearly three decades was formed by dividend increases averaging 5½%, and book value growth averaging 8%. So the message is just the opposite of Time’s foreboding headline: not “Buy Stocks? No Way!,” but rather “Own Stocks, the Course to Stay.”
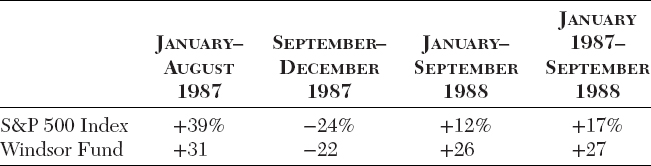
The appropriateness of that advice, I think, is buttressed by the fact that the Great Crash, in truth, was a market spasm that lasted but three business days—or, perhaps more fairly, eight weeks, from August 25 to October 19. Viewed in the light of the gains the stock market enjoyed before then, and the gains that were to follow, it provided a market timing opportunity only to the nimble investor who was either lucky or prescient—twice! (Selling high, then buying low.) The investor who owned stocks when 1987 began, held them through the crash and its aftermath, and stayed the course right up to now, has done just fine. The Standard & Poor's 500 Index, for example, has turned in a total return of +17% during this 19-month period; Vanguard's flagship Windsor Fund has done even better, with a return of +27%. For, as Table 5.1 shows, the unpleasantness of last autumn came between two delightful winter-spring-summer intervals of salubrious investment results.
I mentioned the role of luck and prescience a moment ago. I know no investors (though there may be a few) who were lucky enough both to liquidate their stocks at the highs of August 1987 and to buy them back at the turn of the year. Besides, luck is not a very reliable ingredient upon which an investor should stake his financial future. And as to the prescient investor, the market seer, the all-knowing guru, I don't know many of them either. They come and go, and their advice ranges from the erratic to the incomprehensible, as this excerpt from a Wall Street Journal interview with Robert Prechter, editor of The Elliot Wave Theorist, after “Black Monday,” illustrates:
[Mr. Prechter] said he expected support on the industrial average around 2100. Two hours later, at 12:30 p.m., Mr. Prechter told callers that “he would like to see a close over 2100 today.” But at 2:30, Mr. Prechter said he expected to see a support level between 1700 and 1800. In an update after the market closed down 508, at 1738.74—Mr. Prechter predicted that the next support level would be 1500.
Mr. Prechter, who has long predicted that the industrial average would climb to above 3600 by 1988 … now says yesterday's action “underscores the magnitude of what lies ahead for the new bear market in stocks.” Mr. Prechter could not be reached for comment yesterday.
Less than two weeks ago, Mr. Prechter said that if the industrial average dropped to near 2300, it would represent “an ideal buying spot.”
Well, whether the guru is Robert Prechter in 1987, or Joseph Granville five years earlier, or dozens of other lesser-known names at other times, their advice (such as it may be) usually rings hollow in retrospect.
The Hazards of Equity Investing
To be sure, I think that few investors are more aware than I of the hazards that lie ahead. While “peace and prosperity” accurately describe our world today, tomorrow is ever a question mark. “Brush fire wars,” now being extinguished in Africa, Afghanistan, and the Middle East, could reignite anywhere, anytime. The U.S. economy will probably face a recession within the next few years. The great industrialized nations of the free world are increasingly dependent upon one another. And the mountains of debt that have been accumulated over the past decade—by our Federal government, by the less developed countries, by U.S. corporations, by leveraged buyouts, and by consumers—is potentially explosive. Nonetheless, it is ever thus: hazards always lie ahead, and it is the investors’ responsibility to deal with them, by structuring an investment portfolio that rationally looks to protect against each kind of uncertainty.
So, common stocks, which make such good sense for maximum long-term return and optimum protections against inflation, but which carry such frightening short-term and even intermediate-term risks, should comprise only a portion of the intelligent investor's portfolio. Clearly, every investor should also have significant cash reserves, which presently pay generous returns, offer complete stability of principal, and perhaps most importantly, help provide peace of mind for queasy investors on those days when there are drops of 25 points or 50 points or 100 points or more in the Dow Jones Industrial Average. We will continue to experience such declines, I am confident, in the years immediately ahead, just as in the years immediately past, and cash reserves should fortify investors against panic, the better to avoid liquidating equity holdings at prices that reflect fear and pessimism.
Investing in Bonds
I do not want to ignore the third major leg of a three-legged stool of asset classes. You should own stocks; you should maintain cash reserves; you should also own bonds. Of course, I am well aware that in recent years bonds have been subject to periodic short-term—even daily—price fluctuations that are as comparable, and as frightening, as those of the stock market. Nonetheless, if you can ignore the price and enjoy the coupon, four basic reasons commend bonds to investors today:
First, interest rates are generous by historical standards. Best measured on a “real” (i.e., inflation-adjusted) basis, bonds provide a current real return of about 5½% (10¼% coupon on good grade utility bond, less the present inflation rate of 4¾%). The long-term real return on bonds has averaged only about 3½%, so even if inflation heats up somewhat—as well it may—bonds appear relatively attractive.
Second, bond returns are certain to be steadier than returns on stocks as the investor's holding period lengthens. This is so because typically 100% of the long-term return on a bond comes from its income stream (interest), while only about 50% of the long-term return on a stock comes from its income stream (dividends). So, in the year that begins today, a bond has a 10¼% coupon “in the bag,” while a stock today averages a 3.6% dividend in prospect (based on the current yield of the Standard & Poor's Index). Clearly, the total return on the bond is materially less sensitive to price changes than the total return on the stock.
Third, the rate premium on bonds over cash reserves provides a substantial cushion against even highly adverse changes in long-term interest rates. A compound return on a 10¼% bond over 15 years would provide a terminal value of $44,800 on an initial investment of $10,000; the comparable figure for cash reserves yielding an assumedly flat (which of course it will not be) yield of 7¼% would be $28,500. So, the value of the bond investment could drop by an incredible (and hardly likely) 35% at the end of the period, and still provide an identical return.
Fourth, rising interest rates, however schooled we have been to think of them as baneful, can in fact be a blessing. For most of the long-term compound return on a bond does not come from the regular payment of its interest and the final payment of its principal. Rather, it comes from the reinvestment of the interest coupon (i.e., “interest on interest”). Indeed, taking the 15-year 10¼% bond just described, $15,400 of its total return comes from its coupon; the remaining $19,400 comes from interest on interest. The net result is that if interest rates were to immediately rise to, say 12½%, the terminal value would rise from $44,800 to $52,300, or nearly 20%. I should note that this principle holds only for the long-term investor. Typically, the “break-even” point for total return comes at about half way through the bond's life (in this case, the eighth year). So, the risk of changes in interest rates should not unduly deter the long-term investor from a substantial position in bonds.
(I have been referring, of course, to long-term bonds in these comments. More cautious or more risk-averse investors should also consider short-term bonds, which are substantially less volatile, but yield a nice premium over cash reserves. In many cases, a mixture of long-term and short-term bonds would be appropriate.)
The Appropriate Balance
Now, if I have persuaded you of the importance of maintaining significant positions in stocks and in bonds and in cash reserves in your investment portfolios, it is fair for you to ask just what “balance” is best. Regrettably, the answer is, “it all depends.” It depends most importantly on the amount of your assets (and liabilities!), your financial goals, your tolerance for risk, your need for income, and your age. I can't cover each of these factors for each one of you here tonight, but I can suggest this: a good beginning point might be 50% in stocks, 30% in bonds, and 20% in reserves. For younger investors just beginning to invest—say in an IRA or corporate thrift plan—perhaps 75% to 80% in stocks is the right number, with bonds and cash reserves commensurately reduced. For an investor who has just retired at age 65, stocks might represent 40% of the portfolio, with commensurate increases in the other two asset classes.
I recognize that these examples are grossly oversimplified. For example, there are groups of common stocks with distinct investment characteristics; the younger investor might seek greater returns via stocks with higher growth potential but lower yields and higher risks; the older investor would almost certainly seek stocks with higher yields and a growing income stream, at lower risk. For another example, I have ignored specialty asset classes—such as real estate and gold—which might usefully be considered as ancillary asset classes. For a third example, of course, I have not tried to measure your psyche—your patience, your independence, your determination, in all, the strength of both your heart and your stomach in “pressing on” no matter how compelling the immediate case for abandoning your financial plan. But I hope you will find these brief thoughts on “balance” to be helpful as a starting point.
Return, Risk—and Cost
My emphasis so far in these remarks has been on return, and on risk, and on how to balance them. They are two of the central elements of any investment program. But there is also a third key element, and it is cost. Every investment carries a cost, and that cost is a certain “drag” on your investment return. It may be a transaction cost (such as brokerage or sales commissions); it may be an advisory fee; it may be the other administrative expenses involved in investing, such as custody and service fees. Usually, it is all of the above. Sometimes they are hidden. But they can be readily quantified in what I believe should be the principal medium of any investment program—mutual fund shares.
It is “hornbook economics” that spreading risk over a variety of investments is essential if the specific risk of any one security is to be substantially eliminated. So, I believe that all investors should be broadly diversified in each of the three major asset classes. And I know of no more intelligent way to achieve this diversification than by investing in mutual funds—surely the most efficient way to own lots of stocks and lots of bonds, and the certificates of deposit of lots of banks. Given that I first studied the mutual fund industry as an economics major at Princeton University some 40 years ago, that I have worked in this industry ever since, and that I have been in charge of a major mutual fund complex for more than two decades, it can hardly astonish you that I come here tonight as an unabashed advocate of the concept of mutual fund investing as the optimum way to capitalize on the rewards and minimize the risks of investing.
And so it is with particular fervor that I discuss the role that cost plays in your investment program. In my judgment, this industry has ignored the issue of cost. Indeed, in an ever-more intensive campaign to attract investors’ assets, the better to enhance the profits of the typical mutual fund shareholder, mutual fund costs are today escalating beyond belief, and beyond reason. The great mutual fund price war of the 1980s has driven sales costs ever higher (usually through the now nearly omnipresent 12b-1 fees) and advisory fees skyward. It is a paradoxical price war, since economic theory tells us that price wars are supposed to drive prices paid by consumers down, not up.
But the competition in this industry is for a sales “push,” not a demand “pull.” And the best way to attract investor dollars during the halcyon age of the great five-year bull market in stocks and bonds that extended from mid-1982 through mid-1987 (when virtually all diversified investment programs reaped substantial profits) was through massive and costly distribution efforts. This meant paying large (and often hidden) commissions to stock brokers by load funds, and paying for massive (and often misleading) advertising campaigns by no-load funds. In either case, of course, it is the mutual fund shareholder who foots the bill.
The Soaring Costs of Mutual Funds
The shares of the Vanguard Funds are offered on a pure no-load basis without front-end sales charges or deferred sales commissions, or 12b-1 sales fees. So, we are distinctly different from those of our competitors whose shares are often available only on a full-load, low-load, or deferred-load basis. I am going to limit my comments on costs, therefore, to fund operating expense ratios (the total of advisory fees, 12b-1 charges, administration costs, etc., as a percentage of fund assets). These costs are soaring. According to Forbes magazine, the expense ratio of the average stock fund has risen from 1.16% in 1982 to 1.49% in 1987, an increase of nearly 30% in just five years. Even the more easily managed fixed income funds operate at high ratios—1.04% for the average bond fund and 0.71% for the average money market fund, and new types of funds such as international stock and bond funds operate at still higher ratios, respectively, 1.79% and 1.52%. Further, these increases have in fact been held down by the apparent reluctance of fund managers to propose fee increases on existing funds to their share-holders. Rather, they have created new funds (often identical to their predecessors) with expense burdens that once would have been considered “beyond the pale.” If we were to examine just those funds newly created during the past few years, a typical expense ratio would likely be in the range of 2% or even higher.
Why would an intelligent investor pay such costs? There are really only three possibilities: one, he expects to achieve returns that vastly exceed the costs involved; two, he doesn't take the trouble to make himself fully informed; and three, he is not presented with cost information in a comprehensible manner. At last, order is coming out of chaos in the cost disclosure area. Previously, important cost information was scattered throughout a fund's prospectus—hidden and often ignored. Now, the Securities and Exchange Commission requires mutual funds to provide integrated cost disclosure in a single, crystal clear tabulation at the front of each fund's prospectus. The table must show the total costs that would actually be paid by investors—sales loads (front-end and deferred), advisory fees, 12b-1 fees, shareholder account maintenance charges, and other expenses—assuming his ownership of shares for various time periods. So, the investor can easily make his own cost comparisons, and has only himself to blame if he does not. To give you some idea as to how these costs vary, an investor could incur ten-year costs of $498 for each $10,000 invested in a low-cost fund (I have taken the liberty of using the average Vanguard fund in this example) and as much as $2,564 for each $10,000 invested in a particular high-cost fund. (I won't provide the specific name, but there are plenty of them in that range and even higher.)
The central question, of course, is: “Does cost matter?” I strongly believe that it does. Simply put, if we are measuring long-term returns by historical norms, a conservatively balanced program such as I have described in my earlier baseline example might provide a long-term return in the range of 9%. If the investor's annual cost is ½ of 1%, a $10,000 initial investment would have a terminal value of $39,000 after 15 years. If the cost were 2%, the value of the investment would grow to just $27,600. Just think of that: an increase of $29,000 versus an increase of $17,600. Or to put it another way, an extra gain of $11,400—114% of the initial investment, simply by minimizing cost, with risk and return held constant.
Now I fully recognize that it is worth your while to pay a “genius” stock fund manager 2% a year if he can earn, say 15%, particularly if his “pedestrian” counterpart who is paid ½% a year delivers only 12%. But there are, by my standards, no geniuses in this business. There are, however, lucky managers and managers who take extreme risk, and, after all, those are usually the managers at the very top (and very bottom) of the rankings over most short-term periods. There are also excellent managers with enduring and productive long-term records, but, alas, they are in a distinct minority. What is more, they are not always easily identifiable in advance, and many of yesterday's apparently superior managers will not be among this group tomorrow. Finally, there is not a scintilla—not an iota—of evidence that high-cost funds perform any better than low-cost funds. Indeed, even if the low-cost fund provides marginally lower total return performance, it can still win the competition in terms of net return delivered to the investor. One is reminded of the fable of the tortoise and the hare.
If high cost is unlikely to be rewarding to an investor in a stock fund, it is even less likely to be rewarding to an investor in a bond fund, and almost inconceivable to be rewarding to an investor in a money market fund. In this latter case, virtually the entire difference in yield among money market funds is accounted for by the difference in expenses—not management expertise—and one can hardly imagine why an investor would give up from 50 to 75 “basis points” (½% to ¾%) in yield, to absolutely no avail. While a handful of high-cost bond funds may be able to outperform their low-cost counterparts over time, given the fact that the impact of changing interest rates falls relatively evenly on all classes of bonds, the investor in fixed-income mutual funds who ignores cost is playing very long odds indeed.
Index Funds … and Others
On that note, let me now turn to some types of mutual funds that—in part because of their cost efficiency—I believe will become increasingly important in the years ahead—and then some types that I would caution you to avoid. First is the Index Fund—a fund that matches the composition of, usually, the Standard & Poor's 500 Composite Stock Price Index, and hence emulates its investment performance. It is no secret that this Index has been a redoubtable competitor to actively managed equity accounts over a long span of years, and for reasons that are obvious and simple.
Assume the total stock market provides an average annual return of 12%. That is, by definition, the gross return that all investors—individual and institutional alike—will share. If we accept the assumption that these investors incur costs—advisory fees, transaction cost, etc.—averaging 1½%, they will share a net return of 10½% per year. But if an Index Fund can operate without advisory fees and with minimal transaction costs, its costs might run to, say, ⅜%, it would turn in a net return of 11⅝% per year. Over fifteen years, then, the terminal value of a $10,000 investment at the net market return would be $44,700, while the Index Fund value would be $52,000. Clearly, the typical manager will have his work cut out for him to surpass this unmanaged portfolio.
And that is precisely what the past record shows us. Over the past twenty years, the annual return on the average managed pension equity account has been +8.3%; the annual return on the Standard & Poor's Index has been +9.3%. This actual historical difference of 1% is remarkably close to the simple theoretical difference of 1.1% mentioned a moment ago. (The pension figure is before transaction and administration fees. These costs are probably about equal, so the same relationship would prevail on a “net” basis.) During the past five years, the Index superiority is even larger (+16.5% vs. +14.9%), but this high degree of superiority is probably unsustainable in the future.
While indexing has been a major factor in pension management (an estimated $180 billion currently), it has not made much of a dent in the mutual fund field. Indeed, the 500 Portfolio of Vanguard Index Trust, organized in 1976, was, until 1986, the only publicly available index fund, and our assets of about $1 billion hardly mark it as a dominant force among equity mutual funds. And none of our recent index fund competitors seem as determined as Vanguard to minimize costs. (Our Trust's expense ratio will run at about ¼ of 1% this year, the lowest in the entire mutual fund industry, as far as we know.) An investor would have to be very naive to choose a sales-loaded, high-expense ratio index fund when he could select our no-load, low-expense Trust. So, we look for continued growth in this portion of Vanguard's asset base.
Of course, use of an Index Fund precludes the opportunity for extraordinary performance delivered by a truly superior manager, however rare he might be. In return, however, indexing provides an “odds on” bet that an investor can outpace most other equity funds, and a virtual guarantee that his performance will never be at the bottom of the deck. For most investors, that trade-off is apt to be worthwhile, and an index account should be considered as at least a core portion of the equity portfolios of most investors.
Indexing, moreover, is moving well beyond a simple “Standard & Poor's 500 Stock Index” approach. This Index comprises about 70% of the value of all stocks, so we have developed our Extended Market Portfolio to index the remaining 30% of the market. By using our 500 Portfolio and our Extended Market Portfolio in these proportions, an investor can in effect “own the entire stock market,” a useful hedge against the inevitable periods when small- and medium-sized companies outperform their “blue chip” cousins. (So far, 1988 looks like just such a year.)
Our unique Extended Market Portfolio is but one of three extensions to the basic indexing concept that Vanguard has introduced. A second is Vanguard Bond Market Fund, indexed to the Salomon Brothers Investment Grade Index. A third is Vanguard Quantitative Portfolios, which is “managed” by a computer valuation system with the objective of matching the basic investment characteristics of the S&P Index (industry composition, yield, etc.) but, within that constraint, selecting stocks that appear undervalued. Our goal is to outpace the Index while providing relative performance predictability. In our first year, 1987, we fell short by less than 1%; so far this year, we are about 1% ahead.
I personally believe that more is yet to come in the indexing arena. If mutual funds can be classified as “small company,” “capital appreciation,” “growth,” “growth and income,” and “equity income,” for example, why can there not be, in effect, index funds emulating each group? We know that their general performance characteristics can be replicated; we also know that if their counterpart index funds are operated at extremely low cost, such index funds will have a strong and favoring wind at their back.
Another new Vanguard fund for which we have high hopes—but realistic expectations—is Vanguard Asset Allocation Fund, which we expect to introduce in November. It will provide a changing mix of stocks (based on the S&P Index), bond (based on the long-term U.S. Treasury bond), and reserves. We have retained Mellon Capital Management as adviser to the Fund. The principals of this firm are pioneers in the field of disciplined strategic asset allocation, and their actual (not, I hasten to add, “back-tested”) results over the past decade have been impressive. (We believe that Mellon's highly systematic approach will differentiate the Fund from the “guru approach.”) Of course, there are no guarantees of our future success. At worst, the Fund could decline as much as the stock market in downswings and rise much less in upswings. At best, it could do the reverse, matching the upswings and limiting volatility in the downswings. We expect neither extreme. Rather, we hope to garner long-term returns somewhat in excess of those of stocks in general, while moderating risk and minimizing both transaction costs and operating expenses. Only time, of course, will tell.
Beware of Some Funds
I hope you will forgive me for emphasizing Vanguard funds in these comments about indexing and asset allocation. But the fact is that few, if any, of our competitors offer mutual funds in these areas, as evidenced by the fact that they have not formed funds designed to implement those concepts for individual investors. Similarly, as I turn to my comments regarding funds to avoid, I am afraid that the reverse will be true—that Vanguard does not offer them. Obviously, if we thought these kinds of funds made sense, we would have long since developed them. I do not want to suggest that we are necessarily “right” and our principal competitors “wrong.” But we clearly are following distinctly different strategies from most other firms.
- “Government-plus” bond funds, that seem to generate large yields despite expenses that are often exorbitant. This neat trick is achieved by selling covered call options on the bonds, gaining premium income that enhances their interest income. But such a policy reduces upside participation in the bond markets while maintaining downside participation. In the long-run, in my judgment, that strategy is destined to ratchet down principal, and thus to fail.
- Actively traded “sector funds,” that experience unprecedented transaction activity by their shareholders, and hence huge and expensive portfolio turnover, as well as extremely high cost structures (initial sales charges and annual expense ratios in the 2.5% range). I fear that, if their objective is merely to equal the performance of the industry sectors in which they participate, they too are destined to fail. (Our Vanguard Specialized Portfolios have limited exchange privileges designed to discourage switching, are no-load, and operate at expense ratios of about 0.75%. Most investors, however, seem not to be interested in this combination, and we have achieved very limited success in the market-place.)
- “Strategic” funds, with characteristics that permit them to speculate in anything and everything available among today's derivative financial instruments: futures, options, longs, shorts, currencies, and so on. There may well be some managers that can do all of this to the benefit of fund shareholders, but their success will be spasmodic. Interestingly, some of these equity-oriented funds did quite well in 1987, but are doing quite badly in 1988. For better or worse, they seem to totally lack any “baseline” on which to predict relative performance.
Summing Up
Well, in my long talk this evening, I have tried to give you a retrospective on the year since the Great Crash, a syllabus on the need for both balance and diversification, an insight into the counterintuitive idea that unmanaged, index-oriented investing makes good sense, and a few investment concepts that, in my highly subjective opinion, you might be wary of. In all, I continue to believe that common stocks—seasoned with bonds and reserves in amounts appropriate to your own needs—represent a sound centerpiece to the financial programs of most individual investors seeking optimum long-term returns without excessive risk. I hope and expect that Time is simply wrong when it suggests that the individual investor is an endangered species. Despite the paroxysms of October 19, 1987, wise and patient investors will be unpersuaded by “Buy Stocks? No Way!” Rather, they will accept the advice that I have presented this evening, which might be rhythmically put as:
Own Stocks, the Course to Stay;
Hold Bonds, for They Will Pay;
Keep Cash Reserves for a Rainy Day.