
6
THE DEATH RATTLE OF INDEXING
Keynote Speech
The Superbowl of Indexing III
Palm Springs, California
December 7, 1998
ON FEBRUARY 16, 1993, in the weekly Investment Perspectives bulletin published by Morgan Stanley, the author of the Strategy section began his analysis with this headline: “I Hear the Death Rattle of Indexing.”
It was based, reasonably enough I suppose, on the fact that after a decade of generally miserable performance relative to the market indexes by money managers during the 1980s, their “stock picking paid off well in 1991–1992,” and would continue to pay off during the remainder of the decade. During that two-year period, most managers were finally beating “the market.” The average mutual fund, for example, had risen at a 22% annual rate, compared to 18% for the S&P 500 Index. The strategist's forecast: “I think many active managers will outperform the popular indexes for most of the 1990s.” I salute the courage it takes to issue such a forecast—especially under an unequivocal, contentious headline proclaiming a “death rattle”—for in this business, sticking one's neck out with a forecast of future performance is a very risky endeavor. (Full disclosure requires me to acknowledge that I learned that lesson the hard way!)
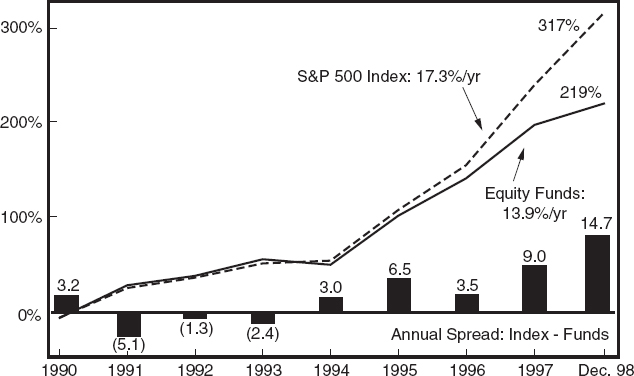
Nonetheless, the forecast could scarcely have been worse. For the Standard & Poor's 500 Stock Index, while continuing to lag for the remainder of 1993, quickly moved ahead of the average fund manager, and has not only remained there, but has—almost unbelievably—steadily accelerated its margin of advantage year after year. And this index of large capitalization stocks is putting the icing on the cake this year, with an astonishing advantage of 15 percentage points over the average equity mutual fund manager: +22% vs. +7% for the average fund through December 1. (See Figure 6.1.)
In all, with the bountiful decade of the 1990s nearing its conclusion only a year hence, the S&P 500 Index has produced an average annual return of +17.3%, compared to a gain of +13.9% for the average diversified equity mutual fund. That 3.4 percentage point margin, in a sense, conceals more than it reveals. Compounded, the S&P 500 has risen more than 300% so far during the 1990s, while the average equity fund has gained just over 200%—nearly a 100 percentage point spread. That enormous spread in favor of the Index is so far superior to any decade on record that it brooks no real comparison.
But let's pause just a moment to evaluate what's behind all of these numbers. For the truth (or the closest approximation of truth that we can reach) is that most managers were neither as good as the “death rattle” bulletin reported in 1993, nor as bad as the decade-long results are proving to be. However, the ability of most active managers to outperform fairly chosen passive benchmarks has been bleak—and so it remains for the future.
To explain why this ominous outlook for active managers continues to exist, I want to explore five major myths that, it seems to me, have clouded the vision of investment managers and investors alike, and then to shine the sunlight of evidence on them. Here are the myths:
- One, that the S&P 500 Index is the most appropriate standard by which to measure the returns of active managers.
- Two, that the unusual and allegedly unrepeatable past superiority of passive management over active management implies that the active managers' shortfall will soon be recouped—particularly since we are said to now be entering a “stock picker's market,” a related myth.
- Three, that a market index, by being fully invested, will fall more during market declines than funds run by flexible active managers, who can protect their accounts with defensive positions.
- Four, that indexing works only in efficient markets, and that investors in what are alleged to be less efficient markets—say small-cap and international markets—have a superior ability to beat those markets.
- And five, that the anticipated death rattle of indexing, having failed to manifest itself for seven years, will now rattle even louder—a reasonable enough forecast, as far as it goes, if one believes that investment styles inevitably revert to the mean and that the costs of investment advice don't matter.
Myth One: The S&P 500 as the Benchmark
The first myth—curiously perpetuated, despite its counterproductive nature, by the money management profession, and uncritically accepted by regulators and the media alike—is that the S&P 500 Index should be the universal measuring stick for manager performance. However, as anyone who has ever considered the issue for a moment knows, the S&P 500, invested 100% in stocks at all times, is a large-cap index. Currently representing three-fourths of the market value of all U.S. stocks, it would seem a huge sample—and in the aggregate sense it is—but it completely ignores one-fourth of the market, mid-cap and small-cap stocks which periodically prove to have somewhat different performance characteristics than their large-cap cousins. So far during the 1990s, large-cap stocks have carried the day, with an annualized return of +17.3%, compared with 13.3% for the rest of the market (Wilshire 4500 Equity Index).
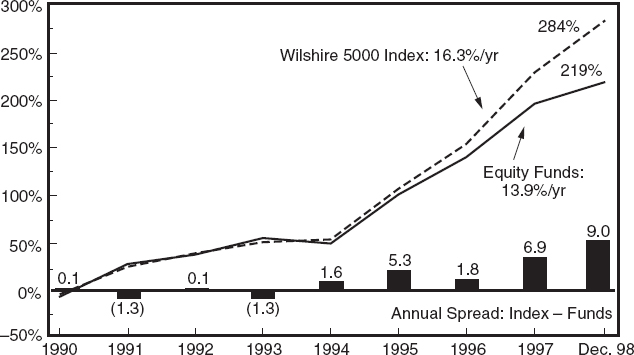
But the mutual fund industry obviously includes not only large-cap funds, but mid- and small-cap funds as well. While the comparison of the assets of equity funds closely resembles the comparison of the total market (about 75% large-cap, 17% mid-cap, 8% small-cap), the number of equity funds departs markedly from that pattern: more than 50% of funds are characterized as large-cap, about 25% each as mid- or small-cap. In an area where a perfect benchmark standard seems far too ambitious a goal, the best benchmark for this industry, in my judgment, is the all-market Wilshire 5000 Equity Index. (For the record, despite its fully invested profile, it carries significantly less risk than the average equity fund.) Interestingly, over its entire history, dating to 1970, it has earned precisely the same annualized return as the S&P 500—13.7% annualized. But within that period there have been many swings to and fro in the relationship between the returns of 500 large stocks in the S&P Index and the thousands of smaller stocks that are not included, and that is surely what we have seen during the 1990s.
Using the Wilshire 5000 as the benchmark, neither the gratifying trends (to active managers) that Morgan Stanley observed in 1991–1992, nor the frightening trends that occurred thereafter, were quite what they seemed to be. In fact, nearly 60% of active managers underperformed the Wilshire 5000 during 1991 and 1992, hardly the death rattle of indexing. And for the decade to date, while only 11% of active managers have outpaced the S&P 500, some 20% of managers have succeeded in outpacing the Wilshire 5000. It seems to me that the sooner we use this more realistic standard as the most appropriate—though not a perfect—passive benchmark for active managers, the better it will be for both the industry and the investors we serve. (See Figure 6.2.)
Myth Two: The Past Is Not Prologue
That brings me to the second myth, that the past superiority of passive management is some sort of freak accident, not to be repeated in the future. But I bring bad news to active managers. In this case, the past is all too likely to be prologue. For the past record of equity mutual funds, fairly measured, is largely the direct result of a small series of causative factors that we not only know, but that we know will continue to exist in the foreseeable future.
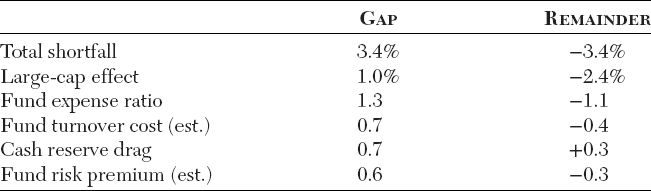
Let's analyze investment returns during the decade of the 1990s so far. We know that the S&P 500 has provided an annualized return of +17.3%, compared with just 13.9% for the average diversified mutual fund. But this 3.4% spread can be clearly explained. First, since the return on the Wilshire 5000 was 16.3% during the same period, we can count 1.0 percentage points as a “large cap effect,” bringing the gap to 2.4%. We know that the expense ratio of the average fund averaged about 1.3% during the period. (It is now 1.5% and rising.) Result: Gap falls to 1.1%. Funds turn their portfolios over at an average rate of 85% per year. (For an industry that is constantly urging its shareholders to invest for the long term, an astonishing result!) So, I'll assume that transaction costs consume at least another 0.7% of annual return, reducing the gap to 0.4%. (See Table 6.1.)
Finally, we know that fund managers held an average of about 8% of their portfolios in cash reserves, an expensive penalty in a great bull market. Taking into account the difference between returns on short-term reserves and fund equities over this period, that cost looks like about 0.7%. Now the gap is a positive 0.3% per year. Thus, measured in terms of the ability of managers to pick stocks, they actually seem to have done a bit better than we might have expected. However, given their higher risk profiles, funds should have earned a premium of perhaps 0.6%, meaning their performance was −0.3% less than expected. In fact, however, we're probably talking about a wash: Just as theory would suggest, before their costs are taken into account, fund managers as a group match the market.
But the point is that when we look ahead, future fund returns will carry at least the same burdens. The most obvious is fund costs. Expense ratios, perversely, are rising, and will almost certainly be heavier in the coming decade. Transaction costs may decline because of likely enhanced automation in market-making systems and perhaps even lower turnover. But any reduction is not likely to offset the rise in expense ratios. Finally, cash would be less of a relative drag in more subdued markets, although lower equity returns may be too much (or too little!) to count on. In all, I believe that the combination of expense ratios, transaction costs, and cash drag will be at least as high as in the past decade, pulling down the gross returns of actively managed equity mutual funds by something in the range of 2.5% per year. Result: as a group, equity funds supervised by active managers must, and will, again fall short of the passive benchmark represented by the Wilshire 5000 equity index. The past will be prologue.
I should note the countervailing thesis that we are now entering what is called a “stock picker's market,” in which astute managers will find it easier to pick superior stocks. The logic of this proposition totally escapes me. Aren't we always in a “stock picker's market?” Didn't smart managers pick Microsoft and Intel and American International Group and Coca-Cola a decade ago? (And wasn't stock picker Warren Buffett rewarded for his skill?) But even if it somehow gets easier to pick stocks (I can't imagine why!), won't 100 good stock pickers inevitably make their picks at the expense of 100 bad stock pickers? And won't the total stock market provide the same returns as the returns (before costs) of the good stock pickers and the average stock pickers and the bad stock pickers combined? If we apply even the most superficial sort of analysis to the concept of a “stock picker's market” is it evident that it too is just another myth.
Myth Three: Market Timing Will Carry the Day
There is a third myth that, mercifully, may have finally been erased by the 1998 bear market. This is the myth that actively managed funds will outpace passively managed indexes during periods of market decline. The myth was that, since indexes are at all times 100% invested in stocks, the cash reserves held by active managers would lessen the shock of the decline in their portfolios. What is more, so the myth went, smart managers, recognizing that a market decline was in prospect, would raise even more cash in advance, and gain considerable downside protection during the ensuing market storm.
First, the fact is that, at the traditional levels of equity fund cash reserves, cash is the tail and not the dog. Simple logic compels the conclusion that a 5 to 10% tail of cash cannot possibly wag the dog represented by a 90 to 95% equity position. And mutual funds hold equity portfolios that have proven to be somewhat riskier than the portfolios of the major indexes, which are dominated by higher-quality, larger-cap stocks. As a result, the indexes have traditionally provided not less, but more, downside protection than actively managed funds during market declines.
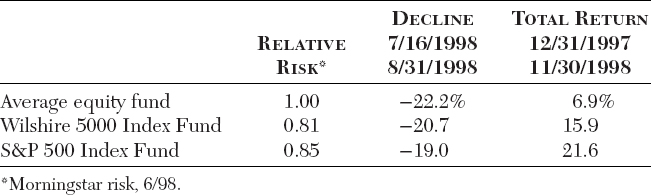
Taking into account both the cash position and the more volatile portfolio of the average mutual fund, the record confirms that index funds based on the Standard and Poor's 500 Index and the Wilshire 5000 Index are somewhat less risky. Morningstar Mutual Funds calculates a risk factor for each fund based on returns in the months in which it underperformed the risk-free U.S. Treasury bill. The data show that, over the past decade, the S&P 500 Index was some 15% less risky than the average mutual fund and the Wilshire 5000 Index was 18% less risky. (See Table 6.2.)
Looked at in a different way, over the past decade the standard deviation of return of the S&P 500 has been 3% lower than that of the average equity fund and the Wilshire 5000 has been 5% lower. Given this record, it should not have been surprising that in last summer's bear market, funds again fell more than the averages—8% more than the Wilshire 5000 (off 20.7%) and 15% more than the S&P 500 (off 19%). The average equity fund fell by 22.2%.
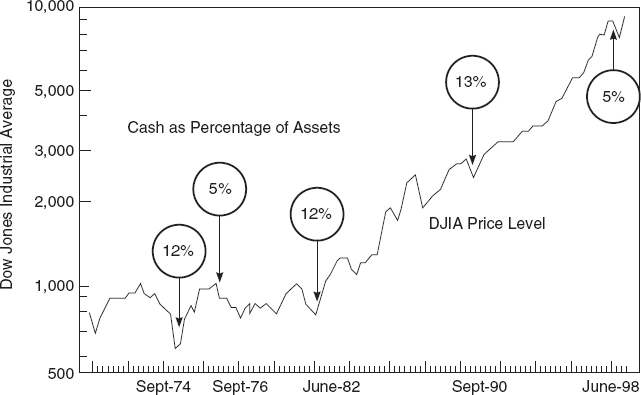
What happened to the vaunted ability of fund managers to raise cash before market drops (and to reinvest that cash after the drop is over)? It simply wasn't there. In mid-1998, just before the steepest stock market decline since 1987, reserves represented less than 5% of equity fund assets, close to the all-time lows, compared to 13% at the market low in 1990, close to the all-time highs. This pattern is all too typical. Funds have consistently tended to hold large amounts of cash at market lows and small amounts at market highs. For example, cash equaled only 4% of assets immediately before the 1973–74 market crash, but increased to about 12% at the ensuing low; at the beginning of the bull market in 1982, equity funds held cash equal to 12% of assets. Managers in short, have been bearish when they should have been bullish, and bullish when they should have been bearish. It is not a formula for success. (See Figure 6.3.)
Taken together, the recent market decline, the Morningstar risk data, and the relative standard deviations make it clear that, despite the fact that managed equity mutual funds do indeed maintain modest reserve positions—and have the ability to raise even more reserves in anticipation of market dips—their risk exposure has been systematically, and often significantly, greater than that of the fully invested broad market indexes. Yes, index funds decline with the market. So do managed funds … only more so. I hope that we have finally heard the end of the silly myth that cash reserves and market timing give active managers an edge in down markets.
Myth Four: That Indexing Works Only in Efficient Markets
As the reality that active managers must fall short of appropriate market indexes by the amount of their costs becomes commonly accepted, the investment community must create another myth to justify its existence. Sadly, much of the academic community seems willing, if not eager, to foster this myth. In any event, myth four has emerged: “Indexing works only in efficient markets,” such as those represented by the actively traded, very liquid large-capitalization stocks that overpoweringly dominate the S&P 500 Index and comprise 76% of the U.S. stock market—and not to other presumably less efficient markets.
Plausible as that argument may sound, it is specious. For the success of indexing is based, not on some notion of market efficiency, but simply on the inability of all investors in any discrete market or market segment to outpace the universe of investments in which they operate. Efficiency relates to a market price structure that generally values all securities properly at any one time, which means that good managers and bad alike will have difficulty in differentiating themselves either way. In inefficient markets, to be sure, good managers may have greater opportunities to outpace their universe, but the excess returns earned by good managers must inevitably be offset by inferior returns of the exact same dimension by bad managers. (Here again, there are good stock pickers and bad stock pickers.)
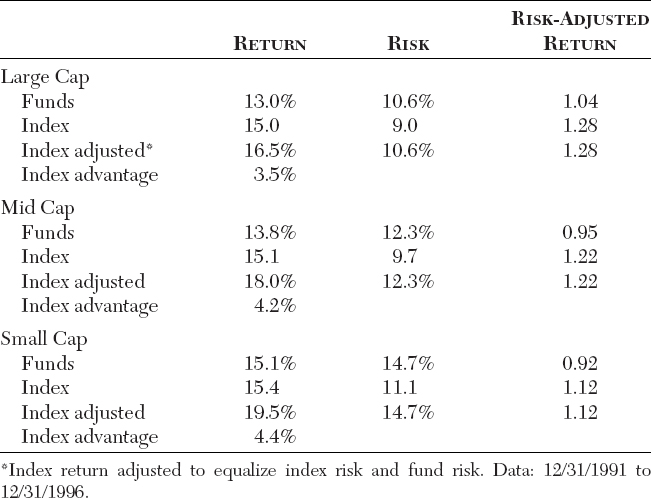
However, costs of mutual funds operating in so-called inefficient markets are higher than funds operating in efficient markets. For example, expense ratios and transaction costs of small-cap funds are systematically higher than those of large-cap funds. It also turns out, that, once account is taken for the relatively higher risks that they assume, mid-cap and small-cap mutual funds have actually realized slightly larger shortfalls to the indexes in their market sectors than their large-cap cousins have realized. A study of mine that was recently published in the Journal of Portfolio Management showed that the advantage in risk-adjusted return—which was 3.5% per year for large-cap funds—was 4.2% for mid-cap funds and 4.4% for small cap funds. Note particularly the almost-rhythmic widening difference in risk as cap-size falls—large-cap funds are 1.6 percentage points riskier than the large-cap index, 2.6 percentage points for mid-cap relative to the mid-cap index, and 3.6 percentage points for small-cap funds versus the small-cap index. (See Table 6.3.)
Costs of international funds are higher still, not only because of higher expense ratios but because of much higher custodial expenses, taxes, commissions, and market impact costs. As a result, not only do the exact same principles of indexing apply in international markets, but an even larger margin of superiority for the passively managed international index should probably be expected. The past results here are erratic, but over the past 20 years, the positive margin for the international index fund over the average international fund was 1.1% annually, while Vanguard's European and Emerging Markets Index Funds have outpaced their actively managed peers by 4.5% and 2.1% annually since their inceptions. Indexing, it turns out, works—as it must—with high effectiveness in all the far-flung corners of the world of equity investing. (See Table 6.4.)
Inefficient markets, to be sure, may provide managers with more opportunities to do well. But the added returns of those who do well must inevitably be offset by the return shortfalls of those who do not. Given the higher costs of owning funds that operate in less efficient markets, it proves to be a bad trade-off. For example, assume that: (a) the top 10% of managers can outpace an efficient market by 3% per year over time, but in an inefficient market by 5%; (b) that the bottom 10% of managers do the reverse; and (c) that total fund costs are 1½% per year in efficient markets and 2½% in inefficient markets. Result: (1) the top managers provide excess returns of 1½% in efficient markets and 2½% in inefficient markets; but (2) the bottom 10% provide returns of −4½% and −7½% respectively. (See Table 6.5.)

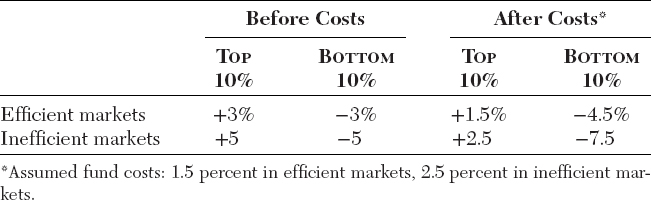
Clearly, the symmetrical pattern of pre-cost returns quickly becomes asymmetrical after the deduction of costs. Put another way, the onus of costs erodes the superiority of the top equity managers, even as it magnifies the deficiency of the bottom-tier managers. But it does so by larger amounts—in both cases—in inefficient stock markets. Thus, ironically enough, equity indexing may well prove to work more productively in inefficient markets than in efficient markets. “Another myth exploded,” as it were.
Myth Five: That Reversion to the Mean Will Finally Triumph
The final myth, in a sense, seems the most reasonable of all. While it is based on a false premise, it deserves to be rebutted because we in the fund industry, and even I personally, have helped to create it. This myth begins with the tacit acceptance that the appropriate benchmark for measuring manager performance is the Standard & Poor's 500 Index. While the analysis I have set forth today has tried to avoid reliance on that Index—and the spectacular returns it has generated, in part by reason of its focus on large-cap stocks—I want to take it on here simply because of its prevalence.
The myth, of course, is that when the seemingly inevitable reversion to the mean of the financial markets takes place and those favorites of yesterday and today—giant-cap stocks such as Microsoft, Coca-Cola, General Electric, and so on—fall back, relinquishing their leadership to small- and mid-cap stocks that have been the serious laggards of the great long bull market, index funds will fall into severe disfavor. I disagree with that thesis.
First, while Vanguard Index 500, with its near-2 million shareholders, soon to become the world's largest mutual fund of any type, has become a household name,1 the fact remains that only half of all managed equity mutual funds are large-cap funds and three-fourths of managed fund assets are represented by large-cap stocks. Thus a simple comparison of the average fund with our 500 Index Fund is flawed. Yet no matter what I say, the S&P 500 benchmark is going to remain as the prime comparison for some time. And I would be astonished if we were not facing a period in which reversion to the mean—I call it “Sir Isaac Newton's Revenge on Wall Street”—will come into play for that Index. After 15 glorious years in which the worst ranking of the S&P 500 Index was just below the 40th percentile of mutual fund managers, and during which it outpaced 96% of all surviving fund managers, it would seem almost obvious that some significant reversion in the Index's relative return lies in prospect.
Nonetheless, I have no ability to predict the extent to which this reversion might unfold. So let me turn to index pioneer William L. Fouse. He has both the preeminent credentials in the field and, of all the practitioners, probably commands the most respected intellect. He deserves every bit of that respect. In the July/August edition of The Financial Analysts Journal, he considered this issue and concluded: “I expect large stocks to soon cease outperforming the average stock. … For the next five years or so, actively-managed portfolios may outperform the S&P 500 by 50 percent or more.”
Far be it for someone with my comparatively modest credentials to challenge the experienced wisdom of Mr. Fouse. But permit me to examine what it would take to make his prediction come true in the mutual fund industry, given its configuration and costs. First, assuming a 10% future rate of return for the S&P Index, the average fund would have to generate a net return of 15%. As I've noted, 52% of funds are large-cap in focus, 26% mid-cap, and 22% small-cap. If the gross returns of large-cap funds matched the S&P Index return of 10%, the other funds would have to achieve gross returns averaging more than 20%. That would be not 50%, but 100%, above the S&P return. (See Table 6.6.)
However, given the possible 3% drag of fund expenses, transaction costs, and cash, the average fund would earn a net return not of 15%, but of 12% for its shareholders, just 2 percentage points ahead of the 500 Index. What is interesting about that figure is that it suggests that the Index would nonetheless outperform some 35% of all managers. If this is failure, heaven help the managers when it is followed at some point—as it inevitably will be—by the return of success to the 500 Index. In short, even using the wrong benchmark, rumors of the death of S&P 500 Index funds are greatly exaggerated.
What is more—and this is really the central point of these remarks—the S&P 500 is a faulty measuring stick, excluding some 25% of the market's total value. (Better to admit it in these halcyon days than to seem to change the rules after the fact.) If the non-S&P segment of the market's capitalization were to rise by 20%—100% more than the S&P rate—the annual gain in the all-market Wilshire 5000 Index would be but 12.5%. However, when we reduce that figure for our 3% assumed mutual fund lag, the net result could be a gain of 9.5% for the average mutual fund—not only 25% less than the 12.5% return of the 5000 Index itself, but even 5% less than the 10% return of the presumably faltering S&P 500 Index. Further, if the non-S&P segment provided a return 50% higher than the S&P, the fund return could be as little as 8.2%, compared to 11.2% for the Wilshire 5000 and 10% for the S&P 500. Surely no matter which of these relationships hold, they will be bad news for the critics of indexing. (See Table 6.7.)


Conclusion
In Macbeth, the protagonist says: “The Bell invites me. Hear it not, Duncan, for it is a Knell. That summons thee to heaven or to hell.” Similarly, what Morgan Stanley heard in 1993 proved to be a death knell all right, but, as it turns out, it was a knell that was summoning active managers. And since the myths I have described will remain just that—myths—there's every reason to expect that the death knell will again be summoning active managers during the new decade that will begin on January 1, 2000. Now, in a curious turn of fate, the very investment banking firm which predicted the death rattle in the 1990s now seems to agree. For a Morgan Stanley report recently took, perhaps inadvertently, a diametrically opposed position, predicting that in the years ahead the S&P Index will again outperform most fund managers.
The basis for its conclusion was reported in its Equity Research Briefing Note of August 7, 1998. After an examination of mutual fund records during the five years 1988–1992, and comparing them with the five years 1993–1997 in terms of return, risk, and risk-adjusted return, the Briefing Note found that, in terms of return, 28% of the top quartile funds and 51% of the top half funds repeat their ranking. Par for the course would be 25% and 50%. Randomness writ large! But in terms of risk, the repeat ratios are 63% for the top quartile and 93% for the top half. Impressive! As a result, in terms of risk-adjusted return, the predictability figures were 39% and 64%, respectively—both far above the random expectation of 25% and 50%. (See Figure 6.4.) Conclusion: “Risk-adjusted return has predictive qualities that are lacking in total return.” (Boldface in original.)
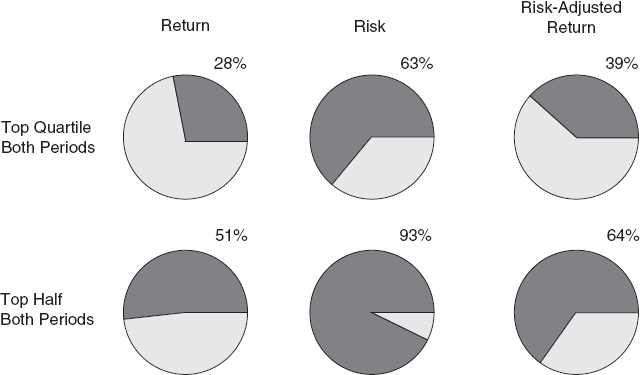
FIGURE 6.4 Persistence in fund return and risk performance in consecutive five-year periods.
SOURCE: Morgan Stanley Dean Witter.
The Note then added: “What about a benchmark? … The S&P 500 ranked in the top quartile of risk-adjusted performance throughout the first and second periods. … Mutual funds that ranked below the first quartile in risk-adjusted return in either period underperformed this benchmark.” It therefore follows that since risk-adjusted return is a highly accurate predictor of future performance, and that the Index has demonstrated a risk profile that is close to (but in fact below) that of the average fund, the firm's unmistakable conclusion must be this: The continued top-quartile performance of the S&P 500 Index is highly predictable.
To be sure, the last sentence in the Briefing Note says: “WARNING: This study is backward looking.” An appropriate warning indeed, but still a remarkable epiphany for a firm that, only five years earlier, had forecast the death rattle of indexing. But in fact that sound proved to be an early death knell, not for indexing, but for the performance of most active managers—a knell that we now know was not summoning them to heaven. Therefore, according to Macbeth's warning, the knell must have been summoning them to a colder, darker, far less felicitous—but still eternal—dwelling place.
1. In fact, as far back as 1987, I considered changing our Index 500 Fund to a Wilshire “Index 5000” fund. I finally decided, however, simply to add an “Index-Extended Market” fund to invest in the remainder of the market outside the 500 S&P stocks, then add a new “Total Stock Market Index Fund” in 1992. I believe that the Total Stock Market Index Fund should be the investment of choice for most investors, covering as it does the entire U.S. stock market, and representing the full practical fruition of the essential theory that the net returns earned by all active investors must, by reason of costs, fall short of the returns of all stocks as a group.