
8
SELECTING EQUITY MUTUAL FUNDS
WHY IS IT VIRTUALLY IMPOSSIBLE TO PICK THE WINNER,
YET SO EASY TO PICK A WINNER?
AND WHAT SHOULD YOU DO ABOUT IT IN THE 1990S?
Journal of Portfolio Management
Winter 1992
INVESTMENT MANAGEMENT is a field fraught with fragility and fallibility, a field in which today's careful, rational fund selections are too often tomorrow's embarrassments. There is little doubt in my mind that few portfolio managers actually believe that there are easy means to providing performance superiority, and that few financial advisers or intelligent investors believe that such superiority can be consistently recognized in advance.
This article considers what I believe to be a peculiar paradox of investing: how difficult it is to pick “the winner.” I would like to present the logic of my observations in the following manner:
- A study of the randomness of equity fund performance that shows, using past performance as the criterion, how difficult it is to pick the winner in advance.
- A real-world long-term study of the actual results achieved by an intelligent and careful system of fund selection.
- Given the results of that study, an obvious means of owning a winner, and being guaranteed never to own a loser.
- Assessment of techniques for evaluating past performance that are emerging in the “information explosion” regarding mutual funds today.
- A look at a theory of “rational expectations” for stock market returns during the decade of the 1990s, and its implications for equity fund selection.
Why Is It So Difficult to Pick “the” Winners?
Let me begin with a hypothesis: The relative return achieved by an equity mutual fund yesterday has virtually no material predictive value for tomorrow. While investors are likely to think that this is the case, the premise is subject to careful testing in the laboratory of fund performance. The basis (not necessarily the fairest) format for analysis is simply this: Calculate the actual past records of all general equity funds, select the top twenty in each period, and then record the future returns actually achieved. Our data include both short-term and long-term analyses.
First, we examine how the one-year “champions” perform during the following year. To minimize the possibility of randomness in any single year, we have made comparisons of fund rankings in each year during the past decade (i.e., how the top-twenty mutual fund performers of 1980 ranked in 1981, and so on through to how the top twenty of 1989 ranked in 1990). For simplicity's sake, we then average the results for each individual period, as shown in Table 8.1. Here are the conclusions:
- A top fund's performance in one year has borne no systematic relationship to its ranking in the subsequent year.
- A typical top-twenty fund in the first year provides a phenomenal return of +45.5%—nearly three times the average for all equity funds of +15.5%. In the second year, the return falls to +14.6%, still above the average of +11.5%, but only by a modest 3.1 percentage points.
- Funds that rank in the top twenty in a given year have, on average, ranked 249 (of 554 funds) in the subsequent year. (That can fairly be described as “regressing to the mean.”)
Over the long term, these three general conclusions are reaffirmed, as is also shown in Table 8.1. In a ten-year study (1971–1980 versus 1981–1990), the rankings are even less meaningful, with the average member of the top twenty providing a premium average annual return of 8.6 percentage points (+19.0% versus +10.4%) in the first decade, then lagging the average return by 0.6 percentage point in the second (+11.1% versus +11.7%). Some of the specific results are dramatic:
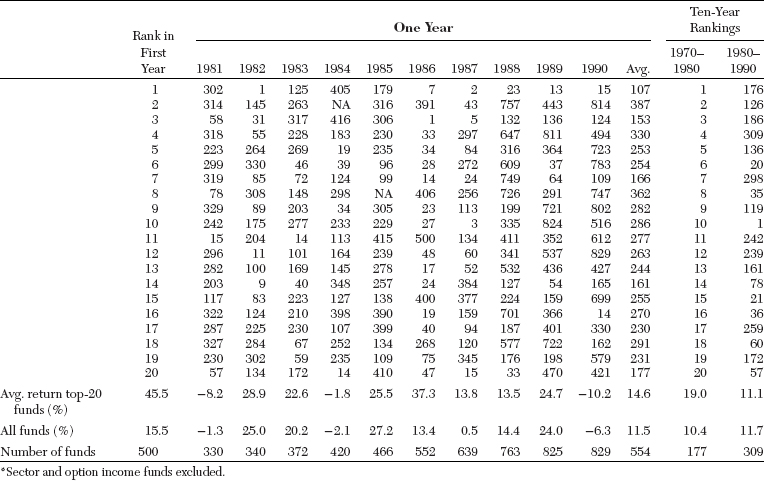
- The average rank of the top-twenty funds in the first decade falls to 137 (of 309 funds) in the second.
- Only two of the top twenty funds in the first period remain there in the second.
- The fourth-ranked fund in the first decade ranks dead last of all funds in the second.
In short, even when we examine the question from the vantage of a full decade, it appears that investing in the winners of the past, sheerly in terms of highest relative return, adds no significant value to the selection of the winners of the future.
A More Sophisticated Real-World Test of Fund Selection
There are quite a few criticisms that could be leveled at these simple tests. So, we shall present a more sophisticated test. Rather than simply picking the top performers, we carefully select the better performers, taking into account their total return over a period of at least ten years, their relative performance in both rising and falling markets, and the continuity of their portfolio management over at least seven years.
What I have described is the Forbes “Honor Roll.” It is an eminently sensible and fair system of equity fund selection, and it has been consistently prepared by the magazine each year since 1973—nearly two decades.
The Honor Roll has encompassed large funds and small, well-known and obscure alike. At one time or another such respected funds as Fidelity Magellan, Investment Company of America, Templeton Growth, Twentieth Century Growth, and Vanguard's Windsor have graced the list (although none of them does so at the moment). Nonetheless, little-known funds—by way of example, Axe Houghton “B,” Central Securities, Castle Convertible, Philadelphia, and Union Income—have scarcely been ignored. So, we have a diverse group of funds, a sensible system for selection, and an extended time period for evaluation.
We propose to test the Honor Roll in retrospect by creating a hypothetical mutual fund investor who studies the Forbes Honor Roll when it is published each year. This investor purchases (or holds) an equal amount in each fund on the list, eliminating funds as they drop from the list. Such an approach avoids the inevitable bias of back-testing (i.e., massaging past numbers until they produce the desired result, or, as it is said, “applying different tortures to the data until they finally confess”). We examine first, whether the Honor Roll is able to select a group of funds that provides better returns than other comparable funds; and second, whether the choices provide better returns than the stock market as a whole.
As to the first issue—selected funds versus all funds—the Honor Roll list provides a total return of +605% compared with +566% for the average general equity fund. (See Table 8.2.) The annual rate of return on the Honor Roll is +12.2% versus +11.8% for the equity average. I should note that this small advantage is more than accounted for by an excellent relative return (+40% versus +29%) in 1979. Excluding that single year, the score would have been: Honor Roll return +10.6%, average equity fund +10.8%. So, I think that it is fair to call the comparison essentially a draw.
This test, however, overstates the results of both the Honor Roll funds and the equity fund average, because in neither case is an adjustment made for sales charges. In the latter case, the data are simply not readily available. In the former case, however, it is relatively simple to account for the front-end sales commission on each of the non-no-load funds when they are added to the list. We do precisely that in the next example, and then compare our results with the U.S. stock market as a whole (as measured by the Wilshire 5000 Index). Now, the relationships shift. As you can see in Table 8.2, the Honor Roll return drops to +440% (+10.4% annually) as we introduce the real-world reality of sales commissions. The return of the market as a whole—as measured by the Wilshire 5000 Index—totals +633%, an average of +12.4% annually. This difference of 2.0 percentage points per year represents a statistically significant extra return. (I believe the Wilshire Index is a better comparative standard for the diverse mutual fund industry than the more conventional Standard & Poor's 500 Composite Stock Price Index; just for the record, however, the average annual return on the S&P 500 was +12.2% for the period under review.)

Assume now that such a total market fund—following a “passive” investment strategy—had been available in 1973. (The fact is that a Standard & Poor's 500 mutual fund has been available since 1976, and a “completion fund” to facilitate matching the Wilshire 5000 since 1987.) These funds are available on a no-load basis, so there is no adjustment for sales commission, although we reduce the market return by estimated annual expenses of 0.2% (today's going rate for such funds) to account for operating costs. Now, we can calculate that the naive (if intelligent) investor would have garnered an annual net return of +12.2%, compared with +10.4% for the Honor Roll (+11.6% and +8.9% if we adjust for that devilish 1979, but perhaps it is now I who am torturing the data to excess).
During the 1973–1990 period, this difference in annual return would have provided a phenomenal increase in terminal investment value, as indicated by the growth of $10,000 invested in each program on December 31, 1973:
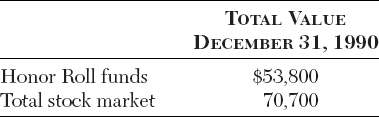
I am sure that you can now see the basis for the title of this article: seeking to select “the winners” has, at least in this instance, proven far less rewarding than selecting “a winner.” This conclusion is generated almost entirely from the fact that the sales charges, advisory fees, and portfolio turnover costs involved in mutual fund investing must inevitably cause actively managed investments in the aggregate to fall short of the market as a whole.
A Simple Strategy for Picking “a” Winner
I choose the word “inevitably” because it is indeed inevitable that a passive market strategy will, under all circumstances, past and future alike, outperform the combined result of all active strategies in the aggregate. Let me take you through this simple syllogism of proof:
- If passive equity managers can match the aggregate market return (and it has been proven over and over again that they can do precisely that), then it logically follows that active managers—that is, all other institutional and individual investors—must also match the market. For example, in a +10% total return market, the passive managers will produce a gross return of +10%; it logically follows that active managers—the remainder of the market—must divide up the +10% gross return that remains.
- If passive managers operate at lower cost than active managers, it therefore logically follows that passive managers must provide excess net returns. It is an undisputed fact that passive managers operate at far lower fees than active managers, and—because of substantially lower portfolio turnover rates—incur lower transaction costs. The conclusion, then, is self-evident.
As the mathematicians would say: QED.
What can go wrong with this thesis? The answer is “nothing.” Unless one is to put forth the far-fetched arguments that passive managers somehow lose track of their target index, or that their computers take on a sudden “virus.” Despite all the other uncertainties of investing, it is certain that passive equity strategies have, and will, and must, outperform active equity strategies in the aggregate.
If nothing can go wrong, I hasten to add, at least three things can appear to go wrong:
- When subsets of the equity market provide different results from the market as a whole. The most notable case is the use of the Standard & Poor's 500 Index as the market standard, when it in fact includes only large-capitalization stocks. The S&P 500 aggregates about 75% of the market's weight, leaving 25% remaining to be accounted for. It will outperform the total market in some periods (as in 1982–1990) and underperform in others (as in 1975–1981 and during the first three quarters of 1991). So, the all-encompassing Wilshire 5000 Index should, I believe, be the relevant standard.
- When a subset of active managers provides better equity results than another subset. For example, it is quite possible that mutual funds will outpace the market from time to time, given differences in portfolio structure. Under this circumstance, one or more of the other subsets—say, bank trust accounts, pension funds, or individual investors—must underperform by a commensurate amount. (There is no empirical evidence that this phenomenon systematically occurs.)
- When exact measures of the returns of active managers are unreliable. There is, in fact, no way to measure precisely the returns of individual investors; pension fund data are notoriously crude; and what we refer to as the “average general equity mutual fund” is unweighted by fund size. An asset-weighted return—adjusted to take into account the cash reserve position of the average equity fund—would be a more exact standard.
Despite these caveats, the past record has validated the passive/active syllogism presented above. The thesis is, implicitly at least, accepted by scores of large pension funds that have committed something like $300 billion to this concept. Why has it not found similar acceptance in the mutual fund field? Again, I would cite three reasons:
- Indexing is decidedly counter-intuitive. (“You mean that no management is better than professional management?”) Presumably few mutual fund investors have the patience to labor through the proof presented in my syllogism.
- Indexed accounts are far less profitable to investment advisers than actively managed accounts. It simply flies in the face of reality to expect an active manager with an advisory fee of 50 to 100 basis points to offer—at least with much enthusiasm—an index fund at 1 to 5 basis points.
- “Hope springs eternal.” Some investors will choose funds carefully and outpace the market; some will make lucky choices and do the same. In total, however, it is inevitable that these investors in the aggregate will be a minority.
Applying Analysis and Judgment to Identify Future Winners
I want to underscore that the “active/passive” issue is not intended to demean the skills of the very best money managers. Despite the drag of expenses and transaction costs, they have succeeded in assembling portfolios that, over an extended period of time, have provided measurably higher net returns than the market as a whole. The issue is whether these winners can be systematically identified in advance in such a way as to provide excess returns over passive investing—always a winner.
If (and I underscore the “if”) there is a systematic way to identify equity fund winners that can win bigger than the sure winner that is readily available through the techniques of passive investing, it would surely be in this new era of the microcomputer, with the fantastic explosion of information that is now available to mutual fund investors. Indeed, investors have at their disposal the means to effect intelligent investment analysis, most notably through the use of various financial publications that compile statistical data on mutual funds.
Perhaps none of these publications is more promising than “Morningstar Mutual Funds,” a remarkable conception of Morningstar, Inc. It goes to the heart of the information that intelligent investors can and must grasp, to which they must apply their own judgment, and finally make their selections. The question, of course is “will the system work?” Will it in fact enable mutual fund investors to earn enhanced risk-adjusted returns? It is to this issue that I now turn.
I propose to gauge the effectiveness of Morningstar's statistical compilations by investigating the results of its star rating system. In this rating system, each equity mutual fund is awarded an overall rating of from one to five stars, depending on the fund's total risk-adjusted return over a variety of periods. (Risk is defined as the cumulative total of all the months in which a fund underperforms the results of U.S. Treasury bills, divided by the total number of months in the period.) The top 10% of all equity funds receive five stars (highest), and the bottom 10% receive one star (lowest). The remaining 80% of funds are assigned ratings as follows: 22.5%, four stars (above average); 35%, three stars (neutral); and 22.5%, two stars (below average).
Because the Morningstar system was first published only five years ago, no definitive conclusions can be drawn regarding the predictive value of the star ratings. Nonetheless, as a preliminary test, we compared equity fund ratings over the past three years (July 31, 1988 to July 31, 1991) for the five-star and one-star funds at the start of the period. Here are the results:
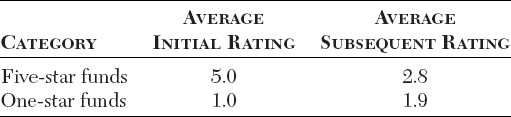
In short, in this simple test there is a remarkable (if hardly surprising) regression to the mean, with five-star funds on average falling just below the three-star (middle 35%) group, and one-star funds moving almost to the two-star category. This combination would suggest a moderately helpful predictive value for the system, primarily because the initial poor performers remain well below average in the subsequent period. (An interesting sidelight: of the initial 46 one-star funds, fully 9 liquidated or merged during the subsequent three years.)
Upon further analysis, we have concluded that the Morningstar system is somewhat better than the evaluation above suggests. A review of the data shows that 22 of the initial 57 five-star selections were mutual funds with international portfolios. Such funds, of course, were favored with an excellent investment environment through 1988, and a poor one thereafter. When compared against a list dominated by U.S. portfolios, then, their fall from grace in 1989–1991 is hardly unsurprising.
If we consider only the U.S. fund portfolios, however, the average rating for the three years ended July 31, 1991, was 3.3 stars, substantially above the 2.8 star average shown in the table above. (I believe that if the star system rated funds in terms of their returns relative to funds with comparable objectives—i.e., international, growth and income, small company—the system would be significantly more useful to investors.) The preliminary indication, then, is that the Morningstar system provides some basis for selecting the better-performing funds and for avoiding the worse-performing. Even if substantial predictive value-added does not materialize over time, however, there can be no doubt that Morningstar is an outstanding source of copious relevant information about each fund under consideration.
It includes, by way of example, a description of the fund's objectives and policies; past performance, including its consistency over a variety of periods; careful measurement of the degree of risk assumed by the fund in the past; divided history; components of its current portfolio (by asset class, by sector, and by major stock positions); portfolio statistics (price/earnings ratios, earnings growth rate, leverage, market capitalization, etc.); name and tenure of portfolio manager; and last—but far from least—the costs incurred in acquiring and holding the fund's shares (sales charges, if any, as well as expense ratios). In short, this new service enables serious investors to understand the investment characteristics of the funds that they select, and that may prove to be the greatest gift of all.
Implications for the Decade of the 1990s
During the 1980s, virtually all equity mutual funds were winners, in the sense of remarkably high absolute rates of return. (The Standard & Poor's 500 Index provided a compound annual return of +17.5%.) In this salubrious environment, fund shareholders may well have been forgiving of relative shortfalls that were not substantial. How will these same shareholders evaluate their results during what may well be a less productive future equity environment?
In particular, how will investors justify paying high expense ratios (the average equity fund carries an expense ratio of 1.40%) or the substantial transaction costs entailed by portfolio turnover (88% for the average equity fund)? If we take into account sales charges (where applicable), expenses, and transaction costs, the cost of an average fund may approximate 2.5% annually. Such a cost would have consumed one-seventh of the +17.5% annual market return we enjoyed in the 1980s, but it would consume fully one-quarter of the +10% return that stocks have returned during their modern (1926–1990) history.
So, the fifth and final issue of this article: What return can we expect of the stock market during the decade of the 1990s? A narrow range of forecasts can be established for an investor willing to make intelligent and reasonable appraisals of just three basic factors:1
- The dividend yield when the initial investment is made.
- The earnings growth rate over the ensuing period.
- The change in the price/earnings multiple during the period.
We can all quickly agree on the first of these three factors: the yield on common stocks as we entered the 1990s was 3.1%. So now we are down to but two, and I have presented some expected ranges in the matrix labeled Table 8.3. Looking first at earnings growth, a disgruntled bear might look for 4.0% a year in the 1990s, a roaring bull, let us say, 10.0%. Combining these earnings growth rates with the entry yield of 3.1% would provide an annual return of +7.1% to +13.1%, other things held equal.
As for the third factor, the price/earnings ratio of the market at the beginning of the 1990s was 15.5 times. If it remains the same at the end of this decade, stock returns will perforce fall within our range of +7% to +13% annually. Each one-point change in this price/earnings ratio will add or subtract about 0.6% to the annual return over a decade, however. To be more precise, if you believe that price/earnings ratios will be at 18 times earnings in 1999, add 1.5% to the base rate of return; if you believe that they will be at 12 times, subtract 2.5%, and so on. Thus, as shown in Table 8.4, a theoretical range on annual stock returns in the 1990s would be from +14.6% (high earnings growth, higher price/earnings ratio) to +4.6% (low earnings growth, lower price/earnings ratio).

Investors are free to make their own assumptions. But they all must deal with this matrix of rational expectations when they do so. We need not waste time debating stock returns in the abstract. Rather, we should accept the current yield as a starting point, and then debate the dimension of the two remaining factors: the “fundamental” factor of earnings growth and what the resultant earnings will be in 1999, and the “technical” factor of what multiple the marketplace will then apply to those earnings. (There is a large emotional component—to say nothing of a large interest rate component—in this factor!)
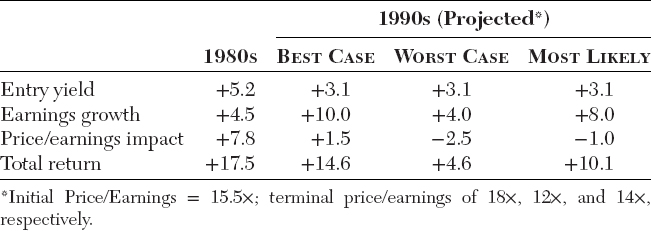
Let's close by evaluating possible returns in the 1990s relative to the “Golden Decade” of the 1980s. Table 8.4 also presents these data.2 It shows that the market's extraordinary return during the 1980s was based not on particularly good earnings growth but on a high yield (5.2%) at the start of the period, and a doubling of the price/earnings ratio from 7.3 to 15.5 times, which added 7.8% annually to return—nearly one-half of the +17.5% total rate.
Simply put, the entry yield of 3.1% at the close of 1989 compares with 5.2% at the close of 1979, and thus will reduce annual return by 2% in the 1990s. To repeat the 1980s return of 8% from price/earnings impact would require another more than doubling of the ratio, to an almost unprecedented 33 times. Perhaps the most rational scenario would be a 2-point drop in the multiple to a more normal level of 14, and an earnings growth rate of 8%. (The compound earnings growth rate over the past 30 years was 6.5%, so this assumption is an ambitious one.) Under these circumstances, the annual return on stocks would average about +10% for the decade, a close counterpart to the long-term historical norm.
Conclusion
I would like to conclude by answering the questions posed at the beginning of this article:
- Picking the winning fund is virtually impossible, because reliance on past performance is of no apparent help.
- Picking a winning fund is made easy by selecting a passive all-market index fund, or perhaps by engaging in thorough research and careful analysis.
- If the stock market in the 1990s offers annual returns well below those of the 1980s, intelligent investors simply cannot disregard the heavy burden of costs endemic to most actively managed funds, and clearly should consider index funds for at least a core portion of their equity holdings.