Chapter 3. Monitoring and Logging in Kubernetes
In this chapter, we discuss best practices for monitoring and logging in Kubernetes. We’ll dive into the details of different monitoring patterns, important metrics to collect, and building dashboards from these raw metrics. We then wrap up with examples of implementing monitoring for your Kubernetes cluster.
Metrics Versus Logs
You first need to understand the difference between log collection and metrics collection. They are complementary to each other but serve different purposes.
- Metrics
-
A series of numbers measured over a period of time
- Logs
-
Used for exploratory analysis of a system
An example of where you would need to use both metrics and logging is when an application is performing poorly. Our first indication of the issue might be an alert of high latency on the pods hosting the application, but the metrics might not give a good indication of the issue. We then can look into our logs to perform an investigation of errors that are being emitted from the application.
Monitoring Techniques
Black-box monitoring focuses on monitoring from the outside of an application and is what’s been used traditionally when monitoring systems for components like CPU, memory, storage, and so on. Black-box monitoring can still be useful for monitoring at the infrastructure level, but it lacks insights and context into how the application is operating. For example, to test whether a cluster is healthy, we might schedule a pod, and if it’s successful, we know that the scheduler and service discovery are healthy within our cluster, so we can assume the cluster components are healthy.
White-box monitoring focuses on the details in the context of the application state, such as total HTTP requests, number of 500 errors, latency of requests, and so on. With white-box monitoring, we can begin to understand the “Why” of our system state. It allows us to ask, “Why did the disk fill up?” and not just, “The disk filled up.”
Monitoring Patterns
You might look at monitoring and say, “How difficult can this be? We’ve always monitored our systems.” Yes, some of your typical monitoring patterns in place today also fit into how you monitor Kubernetes. The difference is that platforms like Kubernetes are much more dynamic and transient, and you’ll need to change your thinking about how to monitor these environments. For example, when monitoring a virtual machine (VM) you expect that VM to be up 24/7 and all its state preserved. In Kubernetes, pods can be very dynamic and short-lived, so you need to have monitoring in place that can handle this dynamic and transient nature.
There are a couple of different monitoring patterns to focus on when monitoring distributed systems.
The USE method, popularized by Brendan Gregg, focuses on the following:
-
U—Utilization
-
S—Saturation
-
E—Errors
This method is focused on infrastructure monitoring because there are limitations on using it for application-level monitoring. The USE method is described as, “For every resource, check utilization, saturation, and error rates.” This method lets you quickly identify resource constraints and error rates of your systems. For example, to check the health of the network for your nodes in the cluster, you will want to monitor the utilization, saturation, and error rate to be able to easily identify any network bottlenecks or errors in the network stack. The USE method is a tool in a larger toolbox and is not the only method you will utilize to monitor your systems.
Another monitoring approach, called the RED method, was popularized by Tom Willke. The RED method approach is focused on the following:
-
R—Rate
-
E—Errors
-
D—Duration
The philosophy was taken from Google’s Four Golden Signals:
-
Latency (how long it takes to serve a request)
-
Traffic (how much demand is placed on your system)
-
Errors (rate of requests that are failing)
-
Saturation (how utilized your service is)
As an example, you could use this method to monitor a frontend service running in Kubernetes to calculate the following:
-
How many requests is my frontend service processing?
-
How many 500 errors are users of the service receiving?
-
Is the service overutilized by requests?
As you can see from the previous example, this method is more focused on the experience of the users and their experience with the service.
The USE and RED methods are complementary to each other given that the USE method focuses on the infrastructure components and the RED method focuses on monitoring the end-user experience for the application.
Kubernetes Metrics Overview
Now that we know the different monitoring techniques and patterns, let’s look at what components you should be monitoring in your Kubernetes cluster. A Kubernetes cluster consists of control-plane components and worker-node components. The control-plane components consist of the API Server, etcd, scheduler, and controller manager. The worker nodes consist of the kubelet, container runtime, kube-proxy, kube-dns, and pods. You need to monitor all these components to ensure a healthy cluster and application.
Kubernetes exposes these metrics in a variety of ways, so let’s take a look at different components that you can use to collect metrics within your cluster.
cAdvisor
Container Advisor, or cAdvisor, is an open source project that collects resources and metrics for containers running on a node. cAdvisor is built into the Kubernetes kubelet, which runs on every node in the cluster. It collects memory and CPU metrics through the Linux control group (cgroup) tree. If you are not familiar with cgroups, it’s a Linux kernel feature that allows isolation of resources for CPU, disk I/O, or network I/O. cAdvisor will also collect disk metrics through statfs, which is built into the Linux kernel. These are implementation details you don’t really need to worry about, but you should understand how these metrics are exposed and the type of information you can collect. You should consider cAdvisor as the source of truth for all container metrics.
Metrics Server
The Kubernetes metrics server and Metrics Server API are a replacement for the deprecated Heapster. Heapster had some architectural disadvantages with how it implemented the data sink, which caused a lot of vendored solutions in the core Heapster code base. This issue was solved by implementing a resource and Custom Metrics API as an aggregated API in Kubernetes. This allows implementations to be switched out without changing the API.
There are two aspects to understand in the Metrics Server API and metrics server.
First, the canonical implementation of the Resource Metrics API is the metrics server. The metrics server gathers resource metrics such as CPU and memory. It gathers these metrics from the kubelet’s API and then stores them in memory. Kubernetes uses these resource metrics in the scheduler, Horizontal Pod Autoscaler (HPA), and Vertical Pod Autoscaler (VPA).
Second, the Custom Metrics API allows monitoring systems to collect arbitrary metrics. This allows monitoring solutions to build custom adapters that will allow for extending outside the core resource metrics. For example, Prometheus built one of the first custom metrics adapters, which allows you to use the HPA based on a custom metric. This opens up better scaling based on your use case because now you can bring in metrics like queue size and scale based on a metric that might be external to Kubernetes.
Now that there is a standardized Metrics API, this opens up many possibilities to scale outside the plain old CPU and memory metrics.
kube-state-metrics
kube-state-metrics is a Kubernetes add-on that monitors the object stored in Kubernetes. Where cAdvisor and metrics server are used to provide detailed metrics on resource usage, kube-state-metrics is focused on identifying conditions on Kubernetes objects deployed to your cluster.
Following are some questions that kube-state-metrics can answer for you:
-
Pods
-
How many pods are deployed to the cluster?
-
How many pods are in a pending state?
-
Are there enough resources to serve a pods request?
-
-
Deployments
-
How many pods are in a running state versus a desired state?
-
How many replicas are available?
-
What deployments have been updated?
-
-
Nodes
-
What’s the status of my worker nodes?
-
What are the allottable CPU cores in my cluster?
-
Are there any nodes that are unschedulable?
-
-
Jobs
-
When did a job start?
-
When did a job complete?
-
How many jobs failed?
-
As of this writing, there are 22 object types that kube-state-metrics tracks. These are always expanding, and you can find the documentation in the Github repository.
What Metrics Do I Monitor?
The easy answer is “Everything,” but if you try to monitor too much, you can create too much noise that filters out the real signals into which you need to have insight. When we think about monitoring in Kubernetes, we want to take a layered approach that takes into account the following:
-
Physical or virtual nodes
-
Cluster components
-
Cluster add-ons
-
End-user applications
Using this layered approach to monitoring allows you to more easily identify the correct signals in your monitoring system. It allows you to approach issues with a more targeted approach. For example, if you have pods going into a pending state, you can start with resource utilization of the nodes, and if all is OK, you can target cluster-level components.
Following are metrics you would want to target in your system:
-
Nodes
-
CPU utilization
-
Memory utilization
-
Network utilization
-
Disk utilization
-
-
Cluster components
-
etcd latency
-
-
Cluster add-ons
-
Cluster Autoscaler
-
Ingress controller
-
-
Application
-
Container memory utilization and saturation
-
Container CPU utilization
-
Container network utilization and error rate
-
Application framework-specific metrics
-
Monitoring Tools
There are many monitoring tools that can integrate with Kubernetes, and more arriving every day, building on their feature set to have better integration with Kubernetes. Following are a few popular tools that integrate with Kubernetes:
- Prometheus
-
Prometheus is an open source systems monitoring and alerting toolkit originally built at SoundCloud. Since its inception in 2012, many companies and organizations have adopted Prometheus, and the project has a very active developer and user community. It is now a standalone open source project and maintained independent of any company. To emphasize this, and to clarify the project’s governance structure, Prometheus joined the Cloud Native Computing Foundation (CNCF) in 2016 as the second hosted project, after Kubernetes.
- InfluxDB
-
InfluxDB is a time-series database designed to handle high write and query loads. It is an integral component of the TICK (Telegraf, InfluxDB, Chronograf, and Kapacitor) stack. InfluxDB is meant to be used as a backing store for any use case involving large amounts of timestamped data, including DevOps monitoring, application metrics, IoT sensor data, and real-time analytics.
- Datadog
-
Datadog provides a monitoring service for cloud-scale applications, providing monitoring of servers, databases, tools, and services through a SaaS-based data analytics platform.
- Sysdig
-
Sysdig Monitor is a commercial tool that provides Docker monitoring and Kubernetes monitoring for container-native apps. Sysdig also allows you to collect, correlate, and query Prometheus metrics with direct Kubernetes integration.
- Cloud provider tools
-
- GCP Stackdriver
-
Stackdriver Kubernetes Engine Monitoring is designed to monitor Google Kubernetes Engine (GKE) clusters. It manages monitoring and logging services together and features an interface that provides a dashboard customized for GKE clusters. Stackdriver Monitoring provides visibility into the performance, uptime, and overall health of cloud-powered applications. It collects metrics, events, and metadata from Google Cloud Platform (GCP), Amazon Web Services (AWS), hosted uptime probes, and application instrumentation.
- Microsoft Azure Monitor for containers
-
Azure Monitor for containers is a feature designed to monitor the performance of container workloads deployed to either Azure Container Instances or managed Kubernetes clusters hosted on Azure Kubernetes Service. Monitoring your containers is critical, especially when you’re running a production cluster, at scale, with multiple applications. Azure Monitor for containers gives you performance visibility by collecting memory and processor metrics from controllers, nodes, and containers that are available in Kubernetes through the Metrics API. Container logs are also collected. After you enable monitoring from Kubernetes clusters, metrics and logs are automatically collected for you through a containerized version of the Log Analytics agent for Linux.
- AWS Container Insights
-
If you use Amazon Elastic Container Service (ECS), Amazon Elastic Kubernetes Service, or other Kubernetes platforms on Amazon EC2, you can use CloudWatch Container Insights to collect, aggregate, and summarize metrics and logs from your containerized applications and microservices. The metrics include utilization for resources such as CPU, memory, disk, and network. Container Insights also provides diagnostic information, such as container restart failures, to help you isolate issues and resolve them quickly.
One important aspect when looking at implementing a tool to monitor metrics is to look at how the metrics are stored. Tools that provide a time-series database with key/value pairs will give you a higher degree of attributes for the metric.
Tip
Always evaluate monitoring tools you already have, because taking on a new monitoring tool has a learning curve and a cost due to the operational implementation of the tool. Many of the monitoring tools now have integration into Kubernetes, so evaluate which ones you have today and whether they will meet your requirements.
Monitoring Kubernetes Using Prometheus
In this section we focus on monitoring metrics with Prometheus, which provides good integrations with Kubernetes labeling, service discovery, and metadata. The high-level concepts we implement throughout the chapter will also apply to other monitoring systems.
Prometheus is an open source project that is hosted by the CNCF. It was originally developed at SoundCloud, and a lot of its concepts are based on Google’s internal monitoring system, BorgMon. It implements a multidimensional data model with keypairs that work much like how the Kubernetes labeling system works. Prometheus exposes metrics in a human-readable format, as in the following example:
# HELP node_cpu_seconds_total Seconds the CPU is spent in each mode.
# TYPE node_cpu_seconds_total counter
node_cpu_seconds_total{cpu="0",mode="idle"} 5144.64
node_cpu_seconds_total{cpu="0",mode="iowait"} 117.98
To collect metrics, Prometheus uses a pull model in which it scrapes a metrics endpoint to collect and ingest the metrics into the Prometheus server. Systems like Kubernetes already expose their metrics in a Prometheus format, making it simple to collect metrics. Many other Kubernetes ecosystem projects (NGINX, Traefik, Istio, LinkerD, etc.) also expose their metrics in a Prometheus format. Prometheus also can use exporters, which allow you to take emitted metrics from your service and translate them to Prometheus-formatted metrics.
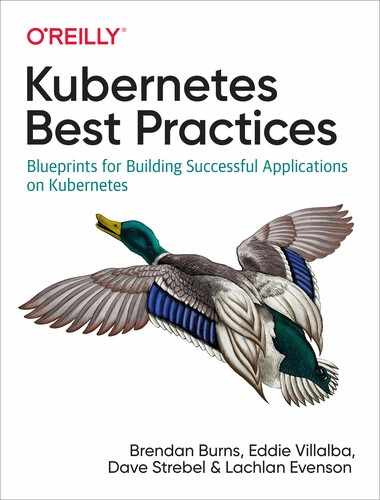
Prometheus has a very simplified architecure, as depicted in Figure 3-1.
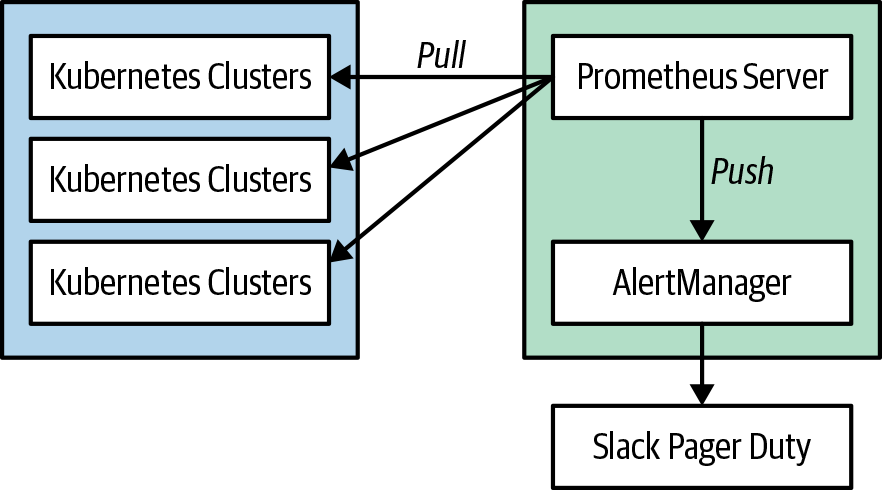
Figure 3-1. Prometheus architecture
Tip
You can install Prometheus within the cluster or outside the cluster. It’s a good practice to monitor your cluster from a “utility cluster” to avoid a production issue also affecting your monitoring system. There are tools like Thanos that provide high availability for Prometheus and allow you to export metrics into an external storage system.
A deep dive into the Prometheus architecture is beyond the scope of this book, and you should refer to another one of the dedicated books on this topic. Prometheus: Up & Running (O’Reilly) is a good in-depth book to get you started.
So, let’s dive in and get Prometheus set up on our Kubernetes cluster. There are many different ways to do this, and the deployment will depend on your specific implementation. In this chapter we install the Prometheus Operator:
- Prometheus Server
-
Pulls and stores metrics being collected from systems.
- Prometheus Operator
-
Makes the Prometheus configuration Kubernetes native, and manages and operates Prometheus and Alertmanager clusters. Allows you to create, destroy, and configure Prometheus resources through native Kubernetes resource definitions.
- Node Exporter
-
Exports host metrics from Kubernetes nodes in the cluster.
- kube-state-metrics
-
Collects Kubernetes-specific metrics.
- Alertmanager
-
Allows you to configure and forward alerts to external systems.
- Grafana
-
Provides visualization on dashboard capabilities for Prometheus.
helm install --name prom stable/prometheus-operator
After you’ve installed the Operator, you should see the following pods deployed to your cluster:
$kubectl get pods -n monitoring NAME READY STATUS RESTARTS AGE alertmanager-main-0 2/2 Running05h39m alertmanager-main-1 2/2 Running05h39m alertmanager-main-2 2/2 Running05h38m grafana-5d8f767-ct2ws 1/1 Running05h39m kube-state-metrics-7fb8b47448-k6j6g 4/4 Running05h39m node-exporter-5zk6k 2/2 Running05h39m node-exporter-874ss 2/2 Running05h39m node-exporter-9mtgd 2/2 Running05h39m node-exporter-w6xwt 2/2 Running05h39m prometheus-adapter-66fc7797fd-ddgk5 1/1 Running05h39m prometheus-k8s-0 3/3 Running15h39m prometheus-k8s-1 3/3 Running15h39m prometheus-operator-7cb68545c6-gm84j 1/1 Running05h39m
Lets take a look at the Prometheus Server to see how you can run some queries to retrieve Kubernetes metrics:
kubectl port-forward svc/prom-prometheus-operator-prometheus 9090
This creates a tunnel to our localhost on port 9090. Now, we can open a web browser and connect to the Prometheus server on http://127.0.0.1:9090.
Figure 3-2 depicts the screen you’ll see if you successfully deployed Prometheus to your cluster.
Now that we have Prometheus deployed, let’s explore some Kubernetes metrics through the Prometheus PromQL query language. There is a PromQL Basics guide available.
We talked earlier in the chapter about employing the USE method, so let’s gather some node metrics on CPU utilization and saturation.
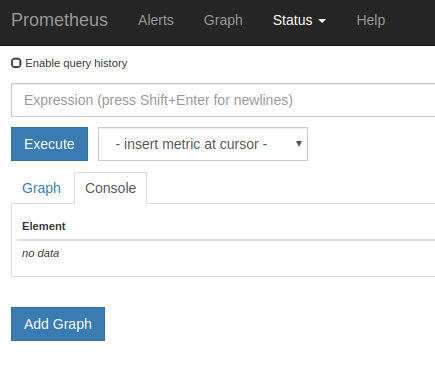
Figure 3-2. The Prometheus dashboard
In the Expression input, enter the following query:
avg(rate(node_cpu_seconds_total[5m]))
This will return the average CPU utilization for the entire cluster.
If we want to get the CPU utilization per node, we can write a query like the following:
avg(rate(node_cpu_seconds_total[5m]))by(node_name)
This returns average CPU utilization for each node in the cluster.
So, now that you have some experience with running queries within Prometheus, let’s take a look at how Grafana can help build dashboard visualization for these common USE method metrics we want to track. The great thing about the Prometheus Operator you installed is that it comes with some prebuilt Grafana dashboards that you can use.
You’ll now need to create a port-forward tunnel to the Grafana pod so that you can access it from your local machine:
kubectl port-forward svc/prom-grafana 3000:3000
Now, point your web browser at http://localhost:3000 and log in using the following credentials:
-
Username: admin
-
Password: admin
Under the Grafana dashboard you’ll find a dashboard called Kubernetes / USE Method / Cluster. This dashboard gives you a good overview of the utilization and saturation of the Kubernetes cluster, which is at the heart of the USE method. Figure 3-3 presents an example of the dashboard.
Figure 3-3. A Grafana dashboard
Go ahead and take some time to explore the different dashboards and metrics that you can visualize in Grafana.
Tip
Avoid creating too many dashboards (aka “The Wall of Graphs”) because this can be difficult for engineers to reason with in troubleshooting situations. You might think having more information in a dashboard means better monitoring, but the majority of the time it causes more confusion for a user looking at the dashboard. Focus your dashboard design on outcomes and time to resolution.
Logging Overview
Up to this point, we have discussed a lot about metrics and Kubernetes, but to get the full picture of your environment, you also need to collect and centralize logs from the Kubernetes cluster and the applications deployed to your cluster.
With logging, it might be easy to say, “Let’s just log everything,” but this can cause two issues:
-
There is too much noise to find issues quickly.
-
Logs can consume a lot of resources and come with a high cost.
There is no clear-cut answer to what exactly you should log because debug logs become a necessary evil. Over time you’ll start to understand your environment better and learn what noise you can tune out from the logging system. Also, to address the ever-increasing amount of logs stored, you will need to implement a retention and archival policy. From an end-user experience, having somewhere between 30 and 45 days worth of historical logs is a good fit. This allows for investigation of problems that manifest over a longer period of time, but also reduces the amount of resources needed to store logs. If you require longer-term storage for compliance reasons, you’ll want to archive the logs to more cost-effective resources.
In a Kubernetes cluster, there are multiple components to log. Following is a list of components from which you should be collecting metrics:
-
Node logs
-
Kubernetes control-plane logs
-
API server
-
Controller manager
-
Scheduler
-
-
Kubernetes audit logs
-
Application container logs
With node logs, you want to collect events that happen to essential node services. For example, you will want to collect logs from the Docker daemon running on the worker nodes. A healthy Docker daemon is essential for running containers on the worker node. Collecting these logs will help you diagnose any issues that you might run into with the Docker daemon, and it will give you information into any underlying issues with the daemon. There are also other essential services that you will want to log from the underlying node.
The Kubernetes control plane consists of several components from which you’ll need to collect logs to give you more insight into underlying issues within it. The Kubernetes control plane is core to a healthy cluster, and you’ll want to aggregate the logs that it stores on the host in /var/log/kube-APIserver.log, /var/log/kube-scheduler.log, and /var/log/kube-controller-manager.log. The controller manager is responsible for creating objects defined by the end user. As an example, as a user you create a Kubernetes service with type LoadBalancer and it just sits in a pending state; the Kubernetes events might not give all the details to diagnose the issue. If you collect the logs in a centralized system, it will give you more detail into the underlying issue and a quicker way to investigate the issue.
You can think of Kubernetes audit logs as security monitoring because they give you insight into who did what within the system. These logs can be very noisy, so you’ll want to tune them for your environment. In many instances these logs can cause a huge spike in your logging system when first initialized, so make sure that you follow the Kubernetes documentation guidance on audit log monitoring.
Application container logs give you insight into the actual logs your application is emitting. You can forward these logs to a central repository in multiple ways. The first and recommended way is to send all application logs to STDOUT because this gives you a uniform way of application logging, and a monitoring daemon set can gather the logs directly from the Docker daemon. The other way is to use a sidecar pattern and run a log forwarding container next to the application container in a Kubernetes pod. You might need to use this pattern if your application logs to the filesystem.
Note
There are many options and configurations for managing Kubernetes audit logs. These audit logs can be very noisy and it can be expensive to log all actions. You should consider looking at the audit logging documentation, so that you can fine-tune these logs for your environment.
Tools for Logging
Like collecting metrics there are numerous tools to collect logs from Kubernetes and applications running in the cluster. You might already have tooling for this, but be aware of how the tool implements logging. The tool should have the capability to run as a Kubernetes DaemonSet and also have a solution to run as a sidecar for applications that don’t send logs to STDOUT. Utilizing an existing tool can be advantageous because you will already have a lot of operational knowledge of the tool.
Some of the more popular tools with Kubernetes integration are:
-
Elastic Stack
-
Datadog
-
Sumo Logic
-
Sysdig
-
Cloud provider services (GCP Stackdriver, Azure Monitor for containers, and Amazon CloudWatch)
When looking for a tool to centralize logs, hosted solutions can provide a lot of value because they offload a lot of the operational cost. Hosting your own logging solution seems great on day N, but as the environment grows, it can be very time consuming to maintain the solution.
Logging by Using an EFK Stack
For the purposes of this book, we use an Elasticsearch, Fluentd, and Kibana (EFK) stack to set up monitoring for our cluster. Implementing an EFK stack can be a good way to get started, but at some point you’ll probably ask yourself, “Is it really worth managing my own logging platform?” Typically it’s not worth the effort because self-hosted logging solutions are great on day one, but they become overly complex by day 365. Self-hosted logging solutions become more operationally complex as your environment scales. There is no one correct answer, so evaluate whether your business requirements need you to host your own solution. There are also a number of hosted solutions based on the EFK stack, so you can always move pretty easily if you choose not to host it yourself.
You will deploy the following for your monitoring stack:
-
Elasticsearch Operator
-
Fluentd (forwards logs from our Kubernetes environment into Elasticsearch)
-
Kibana (visualization tool to search, view, and interact with logs stored in Elasticsearch)
Deploy the manifest to your Kubernetes cluster:
kubectl create namespace logging
kubectl apply -f https://raw.githubusercontent.com/dstrebel/kbp/master/elasticsearch-operator.yaml -n logging
Deploy the Elasticsearch operator to aggregate all forwarded logs:
kubectl apply -f https://raw.githubusercontent.com/dstrebel/kbp/master/efk.yaml -n logging
This deploys Fluentd and Kibana, which will allow us to forward logs to Elasticsearch and visualize the logs using Kibana.
You should see the following pods deployed to your cluster:
kubectl get pods -n logging
efk-kibana-854786485-knhl5 1/1 Running04m elasticsearch-operator-5647dc6cb-tc2st 1/1 Running05m elasticsearch-operator-sysctl-ktvk9 1/1 Running05m elasticsearch-operator-sysctl-lf2zs 1/1 Running05m elasticsearch-operator-sysctl-r8qhb 1/1 Running05m es-client-efk-cluster-9f4cc859-sdrsl 1/1 Running04m es-data-efk-cluster-default-0 1/1 Running04m es-master-efk-cluster-default-0 1/1 Running04m fluent-bit-4kxdl 1/1 Running04m fluent-bit-tmqjb 1/1 Running04m fluent-bit-w6fs5 1/1 Running04m
After all pods are “Running,” let’s go ahead and connect to Kibana through port forwarding to our localhost:
exportPOD_NAME=$(kubectl get pods --namespace logging -l"app=kibana,release=efk"-ojsonpath="{.items[0].metadata.name}")
kubectl port-forward $POD_NAME 5601:5601
Now point your web browser at http://localhost:5601 to open the Kibana dashboard.
To interact with the logs forwarded from our Kubernetes cluster, you first need to create an index.
The first time you start Kibana, you will need to navigate to the Management tab, and create an index pattern for Kubernetes logs. The system will guide you through the required steps.
After you create an index, you can search through logs using a Lucene query syntax, such as the following:
log:(WARN|INFO|ERROR|FATAL)
This returns all logs containing the fields warn, info, error, or fatal. You can see an example in Figure 3-4.
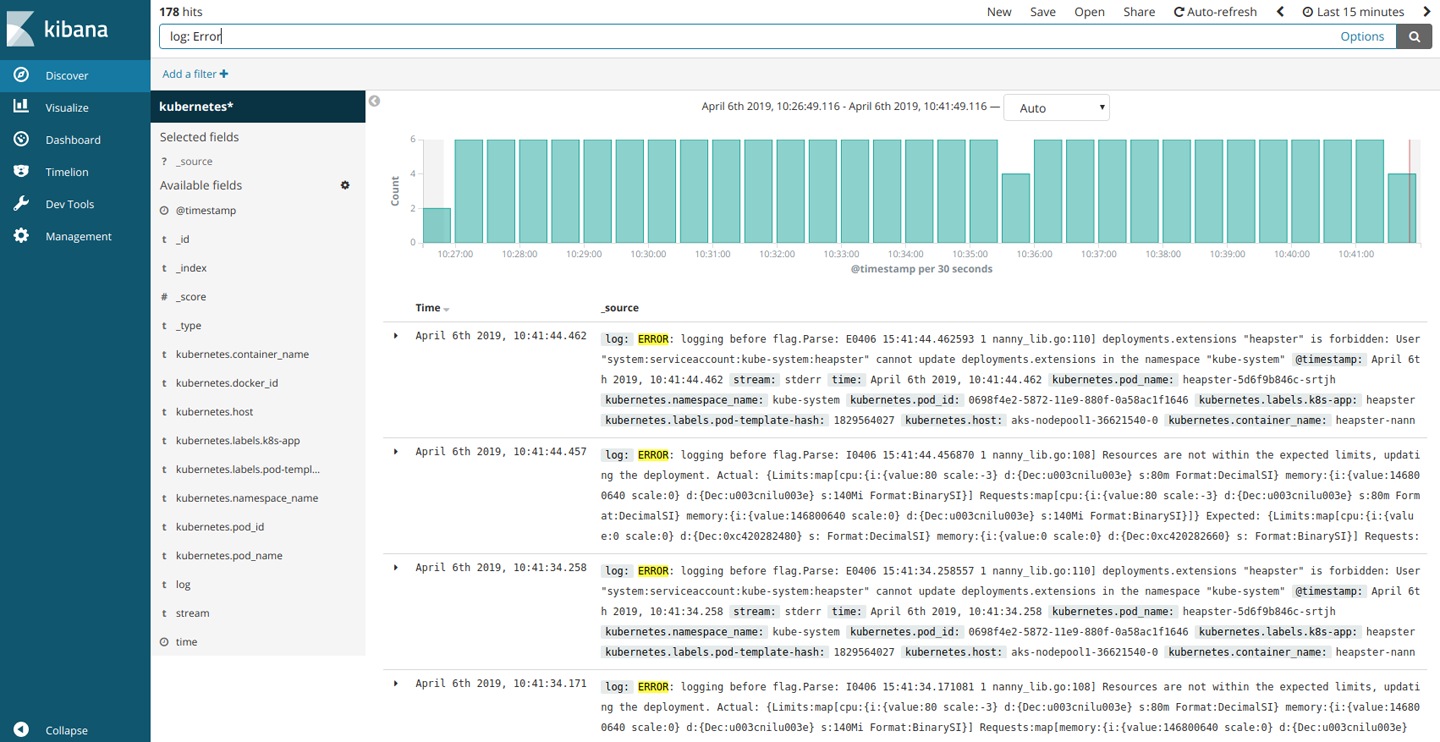
Figure 3-4. The Kibana dashboard
In Kibana, you can perform ad hoc queries on the logs, and you can build out dashboards to give you an overview of the environment.
Go ahead and take some time to explore the different logs that you can visualize in Kibana.
Alerting
Alerting is a double-edged sword, and you need to strike a balance on what you alert on versus what should just be monitored. Alerting on too much causes alert fatigue, and important events will be lost in all the noise. An example would be generating an alert any time a pod fails. You might be asking, “Why wouldn’t I want to monitor for a pod failure?” Well, the beauty of Kubernetes is that it provides features to automatically check the health of a container and restart the container automatically. You really want to focus alerting on events that affect your Service-Level Objectives (SLOs). SLOs are specific measurable characteristics such as availability, throughput, frequency, and response time that you agree upon with the end user of your service. Setting SLOs sets expectations with your end users and provides clarity on how the system should behave. Without an SLO, users can form their opinion, which might be an unrealistic expectation of the service. Alerting in a system like Kubernetes needs an entirely new approach from what we are typically accustomed to and needs to focus on how the end user is experiencing the service. For example, if your SLO for a frontend service is a 20-ms response time and you are seeing higher latency than average, you want to be alerted on the problem.
You need to decide what alerts are good and require intervention. In typical monitoring, you might be accustomed to alerting on high CPU usage, memory usage, or processes not responding. These might seem like good alerts, but probably don’t indicate an issue that someone needs to take immediate action on and requires notifying an on-call engineer. An alert to an on-call engineer should be an issue that needs immediate human attention and is affecting the UX of the application. If you have ever experienced a “That issue resolved itself” scenario, then that is a good indication that the alert did not need to contact an on-call engineer.
One way to handle alerts that don’t need immediate action is to focus on automating the remediation of the cause. For example, when a disk fills up, you could automate the deletion of logs to free up space on the disk. Also, utilizing Kubernetes liveness probes in your app deployment can help autoremediate issues with a process that is not responding in the application.
When building alerts, you also need to consider alert thresholds; if you set thresholds too short, then you can get a lot of false positives with your alerts. It’s generally recommended to set a threshold of at least five minutes to help eliminate false positives. Coming up with standard thresholds can help define a standard and avoid micromanaging many different thresholds. For example, you might want to follow a specific pattern of 5 minutes, 10 minutes, 30 minutes, 1 hour, and so on.
When building notifications for alerts you want to ensure that you provide relevant information in the notification, for example, providing a link to a “playbook” that gives troubleshooting or other helpful information on resolving the issue. You should also include information on the datacenter, region, app owner, and affected system in notifications. Providing all this information will allow engineers to quickly formalize a theory around the issue.
You also need to build notification channels to route alerts that are fired. When thinking about “Who do I notify when an alert is triggered?” you should ensure that notifications are not just sent to a distribution list or team emails. What tends to happen if alerts are sent to larger groups is that they end up getting filtered out because users see these as noise. You should route notifications to the user who is going to take responsibility for the issue.
With alerting, you’ll never get it perfect on day one, and we could argue it might never be perfect. You just want to make sure that you incrementally improve on alerting to preclude alert fatigue, which can cause many issues with staff burnout and your systems.
Note
For further insight on how to approach alerting on and managing systems, read “My Philosophy on Alerting” by Rob Ewaschuk, which is based on Rob’s observations as a site reliability engineer (SRE) at Google.
Best Practices for Monitoring, Logging, and Alerting
Following are the best practices that you should adopt regarding monitoring, logging, and alerting.
Monitoring
-
Monitor nodes and all Kubernetes components for utilization, saturation, and error rates, and monitor applications for rate, errors, and duration.
-
Use black-box monitoring to monitor for symptoms and not predictive health of a system.
-
Use white-box monitoring to inspect the system and its internals with instrumentation.
-
Implement time-series-based metrics to gain high-precision metrics that also allow you to gain insight within the behavior of your application.
-
Utilize monitoring systems like Prometheus that provide key labeling for high dimensionality; this will give a better signal to symptoms of an impacting issue.
-
Use average metrics to visualize subtotals and metrics based on factual data. Utilize sum metrics to visualize the distribution across a specific metric.
Logging
-
You should use logging in combination with metrics monitoring to get the full picture of how your environment is operating.
-
Be cautious of storing logs for more than 30 to 45 days and, if needed, use cheaper resources for long-term archiving.
-
Limit usage of log forwarders in a sidecar pattern, as they will utilize a lot more resources. Opt for using a DaemonSet for the log forwarder and sending logs to STDOUT.
Alerting
-
Be cautious of alert fatigue because it can lead to bad behaviors in people and processes.
-
Always look at incrementally improving upon alerting and accept that it will not always be perfect.
-
Alert for symptoms that affect your SLO and customers and not for transient issues that don’t need immediate human attention.
Summary
In this chapter we discussed the patterns, techniques, and tools that can be used for monitoring our systems with metric and log collection. The most important piece to take away from this chapter is that you need to rethink how you perform monitoring and do it from the outset. Too many times we see this implemented after the fact, and it can get you into a very bad place in understanding your system. Monitoring is all about having better insight into a system and being able to provide better resiliency, which in turn provides a better end-user experience for your application. Monitoring distributed applications and distributed systems like Kubernetes requires a lot of work, so you must be ready for it at the beginning of your journey.