7
Mid‐IR Applications
The development of laser‐based sources in the mid‐infrared opened up unprecedented possibilities in many fields including spectroscopy and trace‐gas detection, atmospheric science, greenhouse gas and pollution monitoring, homeland security, hyperspectral imaging, infrared countermeasures, free‐space optical communications, biomedical diagnostics, surgery and neurosurgery, industrial process control, the study of combustion dynamics, organic material processing, and investigation of metamaterials, among others. This chapter reviews the most important applications of the mid‐IR.
7.1 Spectroscopic Sensing and Imaging
Vibrational spectra provide fingerprints of molecular structures, and as such they are used extensively in science and technology. Coherent laser sources in the mid‐IR, especially in the 3–20 μm spectral range, have long been recognized as important tools for both fundamental and applied spectroscopy and sensing. The vast majority of gaseous chemical substances exhibit fundamental vibrational absorption bands in that region, and the absorption of light by these bands provides a nearly universal means for their detection. The main advantage of optical techniques is the nonintrusive in situ detection capability for trace gases and their isotopologues (molecules that contain isotopes). As an illustration, the fundamental absorption spectra, associated with transitions between rotational–vibrational states, for 11 small molecules are shown in Figure 7.1.
The mid‐IR region contains two important windows (3–5 and 8–14 μm) in which the Earth's atmosphere is relatively transparent. When the strongest rotational–vibrational (“ro‐vibrational”) molecular absorptions in the fingerprint region are targeted, one can detect small traces of vapors with sensitivities of parts‐per‐billion (ppb) to parts‐per‐trillion (ppt), in a variety of atmospheric, security, and industrial applications.
Figure 7.1 Fundamental absorption features (plotted as spectral line intensities) of 11 molecular gases. The plot is based on data from the HITRAN database [1].
Source: reproduced with permission of Elsevier.
There is a plethora of literature on spectroscopic applications in the mid‐IR published to date. An outstanding review by Tittel et al. [2] provides an insight into different spectroscopic techniques using a variety of mid‐IR laser sources. In this chapter, we will focus on the most recent developments with emphasis on the new techniques and advanced laser sources.
7.1.1 QCLs for Spectroscopy and Trace‐gas Analysis
Quantum cascade lasers (QCLs) are almost ideal sources for trace‐gas monitoring, thanks to their small size and high spectral purity, when operated in a single‐longitudinal‐mode (SLM) regime. Recent progress in the development of QCLs has led to the availability of robust mid‐IR spectroscopic light sources capable of high output power and room temperature operation [3–7]. QCLs cover the mid‐IR region from 3.5 to 19 μm, where most molecules have their fundamental absorption bands. For accurate spectroscopic analysis, in most cases both single transverse and single longitudinal mode operation for QCLs are required. The latter can be achieved with distributed feedback (DFB) QCLs [8, 9] or by using an external‐cavity configuration [10]. QCLs can be used to carry out absorption spectroscopy with different techniques including multipass spectroscopy, wavelength‐ and frequency‐modulation spectroscopy, cavity‐enhanced spectroscopy, cavity ring‐down spectroscopy (CRDS), intracavity spectroscopy, magnetic field rotation spectroscopy, photoacoustic spectroscopy (PAS), and photothermal spectroscopy [2, 11].
Figure 7.2 Portion of the absorption spectrum of nitrous oxide (N2O) at 10‐torr pressure obtained with a single scan of the EC‐QCL. Shown are HITRAN simulation (top) and experimental absorption spectrum (bottom, inverted).
Source: reproduced from figure 4 of [13], with permission of Elsevier.
QCL‐based trace‐gas sensors that rely upon direct optical absorption in the mid‐IR have wide applications for practical detection of trace gases in the atmosphere. Nelson et al. [12] reported measurements of nitric oxide (NO) at λ = 5.26 μm in outside air with a detection limit of less than 1 ppb using a thermoelectrically cooled QCL with a DFB grating that operated in pulsed (duration ~10 ns) frequency‐sweep mode with an “instantaneous” full‐width half‐maximum (FWHM) linewidth down to 0.02 cm−1. With a 210‐m path‐length multiple‐pass absorption cell filled with NO gas at 50‐torr pressure, a detection precision of 0.12 ppb Hz−1/2 was achieved using a liquid‐nitrogen‐cooled detector.
Daylight Solutions demonstrated a high‐resolution QCL spectrometer based on an external‐cavity QCL (EC‐QCL) that contains a diffraction grating and operates in a continuous‐wave (CW) single‐frequency regime. The instrument can be continuously tuned, without mode hops, over >100 cm−1 of the optical frequency, with a linewidth that can be as narrow as 0.001 cm−1. A closed‐loop servo with feedback was used to optimize the cavity length to select and support the desired single mode at every grating angle. Figure 7.2 shows a portion of the Doppler‐resolved spectrum of N2O gas at 10‐torr (13‐mbar) pressure obtained with such an instrument [13]. Wysocki et al. performed high‐resolution background‐free magnetic field rotation (Faraday rotation) spectroscopy of NO molecules using room‐temperature CW mode‐hop‐free EC‐QCL with a single‐mode tuning range of 155 cm−1 near λ = 5.3 μm (maximum power of 11 mW). The authors also used another mode‐hop‐free EC‐QCL with a single‐mode tuning range of 7.77–9.05 μm (span 182 cm−1, maximum power 50 mW), to measure high‐resolution N2O spectrum via direct absorption spectroscopy [14]. Chao et al. performed wavelength‐modulation‐spectroscopy (WMS) for real‐time in situ NO detection in combustion gases at exhaust temperature of 600 K [15]. The laser used for these experiments was a commercial EC‐QCL (Daylight Solutions) that could be tuned mode‐hop‐free from 1895 to 1951 cm−1 (5.1256–5.2770 μm) with a nominal spectral linewidth <0.0015 cm−1. This tuning region can cover 20 pairs of NO absorption transitions in the R‐branch of its fundamental vibrational band.
PAS is based, similar to the optical absorption spectroscopy, on resonant optical absorption process; however, it relies on a different physical principle [16]. When light at a specific wavelength is absorbed by the gas sample, the excited molecules subsequently relax to the ground state by means of non‐radiative processes. This produces localized heating in the gas, which in turn results in the production of a sound wave. The key advantages of this technique are that (i) no optical detector is required – the resulting sound waves can be detected by an inexpensive microphone, and (ii) it is a background‐free technique in the sense that the photoacoustic signal is present only in the presence of absorption and is proportional to the absorption coefficient of a measured sample. A recently developed novel approach to photoacoustic detection utilizes a quartz tuning fork that can be regarded as a resonant acoustic detector [11, 17, 18]. The basic idea of quartz‐enhanced photoacoustic spectroscopy (QEPAS) is to accumulate the acoustic energy in a high‐Q resonant system – a quartz tuning fork. The latter is used, for example, in electronic clocks as a frequency standard (its resonant frequency is ~32.77 kHz). If the incident light intensity is modulated at the same frequency, the photoacoustic signal from the quartz tuning fork can be dramatically enhanced. QEPAS is now widely used for detection of various chemical species, such as NH3, H2O, CO2, N2O, CO, CH2O, and NO molecules. The best results in terms of minimum detectable gas concentration have been obtained by adding an acoustic micro‐resonator tube (Figure 7.3) to further enhance the acoustic signal. In such a way, ppb‐level concentrations can be measured for several small molecules [19, 20]. For example, Dong et al. achieved a sensitivity of detecting NO of 5 ppb at one‐second averaging time at an optimal gas pressure of 210 torr by targeting the 1900.08 cm−1 (5.26‐μm) absorption line of NO. The authors utilized an EC‐QCL combined with QEPAS system with an added acoustic micro‐resonator [21].
The CRDS method is based on measurement of the decay time of the intensity of light that is trapped in a low‐loss optical cavity [22, 23]. The laser light is injected into an optical cavity formed by a pair of highly reflective (R > 99.9%) mirrors. (In the case of a narrow‐band CW laser, the laser frequency should match one of the cavity resonances.) The light that is trapped inside the cavity reflects back and forth between the two mirrors, with a small fraction transmitting through each mirror. The resultant leaking light is monitored as a function of time and this allows the decay time of the cavity to be determined. The apparatus is converted to an extremely sensitive absorption spectrometer by placing an absorbing medium (e.g. molecular gas) between the two mirrors and recording the frequency‐dependent decay time of the cavity. Measurement of the ring‐down time allows the absolute single‐pass transmission coefficient of the cavity to be determined with high accuracy. The absorption intensities are obtained by subtracting the baseline absorption of the cavity, which is measured when the laser wavelength is off molecular resonance.

Figure 7.3 Quartz‐enhanced photoacoustic spectroscopy (QEPAS) system. The incoming photons excite the target molecule at a resonant wavelength. Collisional de‐excitation converts the absorbed energy into pressure waves, which are detected by a quartz tuning fork. EC‐QCL, external‐cavity QCL; ADM, absorption detection module.
Source: reproduced from figure 11 of [19], with permission of OSA, The Optical Society.
CRDS methods are widely used with QCLs. Kosterev et al. [24] demonstrated a spectroscopic gas sensor for NO based on the cavity ring‐down technique by accessing absorption lines at 1921.599 and 1921.601 cm−1. A CW DFB QCL operating near 5.2 μm was used as a tunable single‐frequency light source. Measurements of ppb NO concentrations in nitrogen with a 0.7‐ppb standard error for a data collection time of eight seconds have been performed.
Using CRDS, Galli et al. demonstrated mid‐IR detection of carbon dioxide containing 14C isotope (“radiocarbon dioxide,” 14CO2) at 4.5‐μm wavelength with an unprecedented parts‐per‐quadrillion (10−15) sensitivity level [25]. The spectroscopic apparatus consisted of a high‐finesse cavity with a ring‐down time constant of 17.5 μs (effective interaction path of 5.2 km). The system employed a narrow‐linewidth (9‐kHz) frequency‐stabilized QCL with a tuning range 2208–2212 cm−1 and an output power 100 mW. The sample gas was kept at 12 mbar pressure and 170 K temperature. The authors used a newly developed saturated‐absorption cavity ring‐down spectroscopic technique, where, at the beginning of the ring‐down process, the intracavity intensity is so high that it saturates the absorption of the sample gas, while at the end of the ring‐down process, the decay rate is determined by the linear gas absorption. This allowed the authors to decouple the linear gas absorption decay rate from that determined by the passive cavity losses. In such a way the authors reached a sensitivity of measurement of 14CO2 concentration of 5 × 10⁻¹⁵ with respect to the main isotopologue [25].
7.1.2 Spectroscopy with ICLs
Interband cascade lasers (ICLs) are currently widely used in spectroscopy in the 3–5 μm spectral band. Because the threshold drive powers of ICLs are far lower than those of QCLs, ICLs are viewed as the laser of choice for mid‐IR laser spectroscopy applications that do not require high output power but need to be hand‐portable and, ideally, battery operated.
Horstjann et al. [26] used a CW mid‐IR DFB ICL at λ = 3.53 μm (2832.5 cm−1) to detect formaldehyde (H2CO) using QEPAS. The laser was operated at liquid‐nitrogen (T = 77 K) temperatures and provided single‐mode (linewidth <20 MHz) output power of up to 12 mW. The authors demonstrated the feasibility of detecting formaldehyde in ambient air with a detection limit of 0.6 parts per million by volume (ppmv) for a 10‐second acquisition time. Wysocki et al. utilized a pair of ICLs mounted in the same Dewar for the simultaneous detection of two atmospheric trace gases, formaldehyde (H2CO) and ethane (C2H6), in the wavelength range of 3.56 and 3.33 μm correspondingly [27]. The researchers used the WMS and a 100‐m Herriott multipass cell. With a one‐second integration time, the minimum detection limits of 3.5 ppb for H2CO and 150 ppt for C2H6 were demonstrated.
Tunable ICLs operating at room temperature are most desirable for use in an outside laboratory, for example, for process monitoring in industry, where unattended operation is essential. Lundqvist et al. have demonstrated sensing of formaldehyde using a room‐temperature DFB ICL operating around 3.493 μm with a detection limit better than 1 ppm × m [28].
7.1.3 Spectroscopy with DFG and OPO Sources
Mid‐IR sources based on difference frequency generation (DFG) are widely used in spectroscopy. Typically, CW DFG‐based systems use well‐developed optical telecommunication lasers as pump sources, combined with robust optical fiber elements. They operate at room temperature and offer certain advantages (as compared to direct lasers sources like QCLs and ICLs) for high‐precision spectroscopic measurements, since they offer inherent sub‐MHz linewidths and do not need active feedback. Richter et al. used a mid‐IR system near λ = 3.5 μm based on DFG in periodically poled LiNbO3, with near‐IR diode and fiber lasers at 1083 and 1562 nm, respectively, serving as pump sources [29]. With the WMS employing an astigmatic Herriott multipass gas absorption cell, the compact DFG system allowed detection of formaldehyde with a minimal detectable concentration of 74 parts‐per‐trillion by volume for one minute of averaging time. Excellent reviews on spectroscopic applications of CW mid‐IR DFG sources can be found in [30, 31].
The versatility of optical parametric oscillators (OPOs) as a coherent light source in trace‐gas detection has been demonstrated by numerous groups. For example, spectroscopic sources based on CW OPOs that can be tunable all the way from 2.5 to 4.7 μm with narrow (1 MHz) linewidth, high power (∼W), and smooth, mode‐hop‐free tuning up to 60 GHz, suitable for PAS and CRDS, have been developed [32–34]. With the CRDS technique, von Basum et al. demonstrated detection of ethane in the 3‐μm wavelength region, with a detectable concentration of 0.5 ppt at a three‐minute integration time [35].
Todd et al. reported a mid‐IR CRDS system that used a pulsed widely tunable long‐wavelength (6–10 μm) OPO combined with a low‐loss CRDS cavity with the ring‐down decay time of 20 μs, equivalent to a 6 km path length. Vapor‐phase mid‐IR spectra of common explosives (TNT, TATP, RDX, PETN, and Tetryl) were acquired with ppb concentration levels [36].
7.1.4 Broadband Spectroscopy with Frequency Combs
Optical frequency combs (OFCs), initially conceived for precision spectroscopy of the hydrogen atom in the UV, are now commonly used for probing molecular ro‐vibrational transitions throughout the whole mid‐IR molecular fingerprint region [37]. Spectroscopic applications of broadband OFCs include several scenarios:
- A system where a frequency comb directly interrogates an absorbing sample after which the spectrum is dispersed in two dimensions and sensed with detector arrays [38–40].
- Michelson interferometer‐based Fourier‐transform spectroscopy [41–46] to enhance detection sensitivity; this technique may use a multipass cell [41] or an external high‐finesse optical cavity [45, 47], or it may perform intracavity spectroscopy inside the comb source [43].
- Dual‐comb spectroscopy (DCS). This is a form of high‐speed Fourier‐transform spectroscopy involving no moving parts and capable of combining vast spectral coverage with very high resolution [48–65]. The technique is capable of simultaneously probing molecular absorption on thousands of narrowly spaced wavelengths using a single high‐speed photodetector.
By using an OPO broadband comb (span ~300cm–1) that operated in the 2.7–4.8‐μm spectral range, combined with a multipass gas cell and a Fourier transform spectrometer (FTS), Adler et al. demonstrated rapid trace‐gas detection with 0.0056‐cm−1 resolution. The authors achieved ppb detection limits in 30 seconds of integration time for several important molecules including methane, ethane, isoprene, and nitrous oxide [41]. Figure 7.4 provides an example of detecting the Q‐branch spectrum of methane with such a system.
Based on a comb source centered at 8.5 μm created by difference frequency mixing in an orientation‐patterned GaP (OP‐GaP) crystal, and in combination with cavity‐enhanced direct frequency comb spectroscopy, Changala et al. obtained the first high‐resolution ro‐vibrational spectrum of the fullerene, C60, molecule [51].
Figure 7.4 (a) Methane Q‐branch spectrum (N2 buffer gas at 100 torr) obtained by the use of a multipass cell and an OPO‐based frequency‐comb Fourier‐transform spectrometer with the resolution of 0.0056 cm−1 (168 MHz). (b) A magnified view of the spectrum; open circles are measured data points. A HITRAN‐based theoretical spectrum is plotted negative for clarity.
Source: reproduced from figure 3 of [41], with permission of OSA, The Optical Society.
In DCS, which is the most advanced of the comb techniques, a second frequency comb, with a small offset of mode spacing (e.g. pulse repetition frequency), effectively plays the role of the time‐delayed second arm in the Fourier‐transform spectrometer. DCS requires a high degree of coherence between the two combs, and most reports that simultaneously take full advantage of the dual‐comb technique (broad spectral coverage, comb‐tooth resolved spectra, and rapid scans) have till recently privileged the near‐IR domain [52–54]. The true promise of DCS for sensitive molecular detection lies in the mid‐IR and proof‐of‐principle demonstrations of molecular detection have been carried out in different spectral regions of the mid‐IR. These include: the 10‐μm wavelength region (instantaneous spectral span 250 cm−1, spectral resolution 2 cm−1) [49], the 2.4‐μm region (span 200 cm−1/resolution 2 cm−1) [55], the 3‐μm region (150 cm−1/0.2 cm−1 [56]; 250 cm−1/0.8 cm−1 [57]; 350 cm−1/0.2 cm−1 [58]; 250 cm−1/0.07 cm−1 [59]; and 160 cm−1/0.5 cm−1 [60]), and the 6.5‐to‐7.5‐μm region (span 85 cm−1/resolution 0.3 cm−1) [61]. A very high spectral resolution has been demonstrated with a DFG‐based dual comb in the 3.4‐μm region, although with reduced simultaneous spectral coverage (spectral span 30 cm−1/resolution 10 kHz ≈ 3 × 10⁻⁷ cm−1) [62], and in the 7‐μm region with the use of QCL‐based dual frequency comb (spectral span 16 cm−1/resolution 0.003 cm−1) [63]. A broadband (2.6–5.2 μm) DCS was reported in [64] using dual combs created via DFG. The above span was covered in several steps, by adjusting the proper poling period of the frequency‐mixing crystal for each step.
Most recently, using a pair of broad‐bandwidth subharmonic OP‐GaAs OPO combs (Figure 7.5) with a high degree of mutual coherence, the acquisition of 350 000 comb‐tooth resolved data points over the entire (no gaps) range of 3.1–5.5 μm (spectral span >1300 cm−1, spectral resolution <0.0038 cm−1) has been achieved [65]. With a measurement time varying from 7 ms to 1000 s, the authors demonstrated parallel detection of 22 molecular species (including isotopologues) in a mixture of gases and demonstrated the full potential of the dual‐comb technique in the mid‐IR (spectral coverage, spectral resolution, speed, and the absolute frequency referencing, e.g. to atomic clock). Molecular spectra obtained with a 76‐m multipass are shown in Figure 7.6. Also, an exceptional degree of coherence between the two subharmonic OPOs (residual linewidth 25 mHz, mutual coherence time 40 seconds) allowed resolving frequency comb modes with a finesse of 4000.
Figure 7.5 Schematic of the 3.1–5.5 μm DCS setup. A pair of phase‐locked Tm‐fiber laser combs pumps a pair of subharmonic OPOs. Their beams are combined, passed through a 76‐m multipass gas cell, detected with an InSb detector, digitized, and Fourier transformed to retrieve the optical spectrum. LPF, long‐pass (>2.5 μm) filter.
Source: reproduced from figure 2a of [65], with permission of Springer Nature.
A paper by Vainio and Halonen gives a very good review of different methods for producing frequency combs based on nonlinear optics and gives examples of their use for molecular spectroscopy [66]. Another excellent paper, by Cossel et al. [67], provides an overview of broadband spectroscopy methods and applications, such as atmospheric measurements, chemical kinetics, breath analysis, astrochemistry, fundamental laboratory spectroscopy, and industrial applications.
7.1.5 Hyperspectral Imaging
The goal of hyperspectral imaging is to add spectral information for each pixel of the 2D image of a scene, with the purpose of finding hidden objects, identifying materials, detecting trace gases, etc. Stothard et al. demonstrated a scanning system for active, real‐time hyperspectral imaging in the mid‐IR [68]. The authors used a combination of a CW tunable OPO, an electromechanical scanning imager, and a single detector. The elegant design of a pump‐enhanced CW OPO, which used periodically poled RTA (PP‐RTA) crystal, and where the pump and the signal wave were both resonant, required only <500 mW of pump power from a 1064‐nm Nd:YVO4 laser to achieve the OPO threshold. With 1 W of pump power, the OPO provided adequate mid‐IR idler‐wave power (~50 mW) for 2D scanning.
Figure 7.6 Dual‐comb spectra of a mixture of gases. (a) Optical spectrum (log scale) retrieved from a single coherently averaged interferogram (100 000 averages), when the multipass (L = 76 m) gas cell was evacuated. Absorption dips originate from atmospheric gases outside the cell. (b) Optical spectrum with the gas cell filled with a mixture of gases (OCS, N2O, NO, CO, CH4, C2H6, C2H4, C2H2, CO2, and H2O) in N2 buffer gas at 3 mbar total pressure. The two curves are vertically offset for clarity. (c–k) Absorbance spectra for nine molecules (out of 22 detected) obtained by normalizing the “sample” spectrum to that of the “vacuum.” Also shown are theoretical (HITRAN) spectra (inverted for clarity).
Source: reproduced from figure 3 of [65], with permission of Springer Nature.
The geometry of the scanner was such that the radiation from the OPO was directed to the scene under surveillance via the polygon scanner with 10 facets and a tilting mirror. The backscattered radiation (that can be approximated as Lambertian reflection into the 2π solid angle) returning from the scene was collected via the same tilting mirror and the polygon scanner, and was then focused by the collection lens onto a mid‐IR detector with the sampling rate for digitization of 200 kHz. Due to the wide spectral coverage (3.18–3.5 μm) and high spectral resolution (<1 GHz), the system was capable of being selectively tuned into narrow (~5 GHz) absorption features of a wide variety of gaseous species in the atmosphere. As an example, the authors showed how a strong absorption peak exhibited by methane at 3057.7 cm−1 (3.27 μm) can be accessed and gas plumes can be imaged in concentrations as low as 30 ppm from the distance of several meters (Figure 7.7).
Dam et al. [69] demonstrated a compact imaging system where the incoming mid‐IR light (coherent or incoherent) was upconverted in a single pass through a periodically poled lithium niobate (PPLN) nonlinear crystal, by mixing with a resonating 1064‐nm Nd:YVO4 laser beam, so that the mid‐IR 2D image information was conserved in the process. The upconverted near‐IR image near 800‐nm wavelength, with quantum conversion efficiency 20%, was then detected by a charge‐coupled device (CCD) camera. The system can be tuned to any wavelength band in the 2.85–5 μm region with the bandwidth, determined by the phase matching, which varied from 5 nm at 2.9 μm to 25 nm at 3.8 μm. According to the authors, by combining image upconversion and modern low‐noise electron‐multiplying CCD cameras, one can obtain mid‐IR images with a sensitivity of about one photon per pixel.
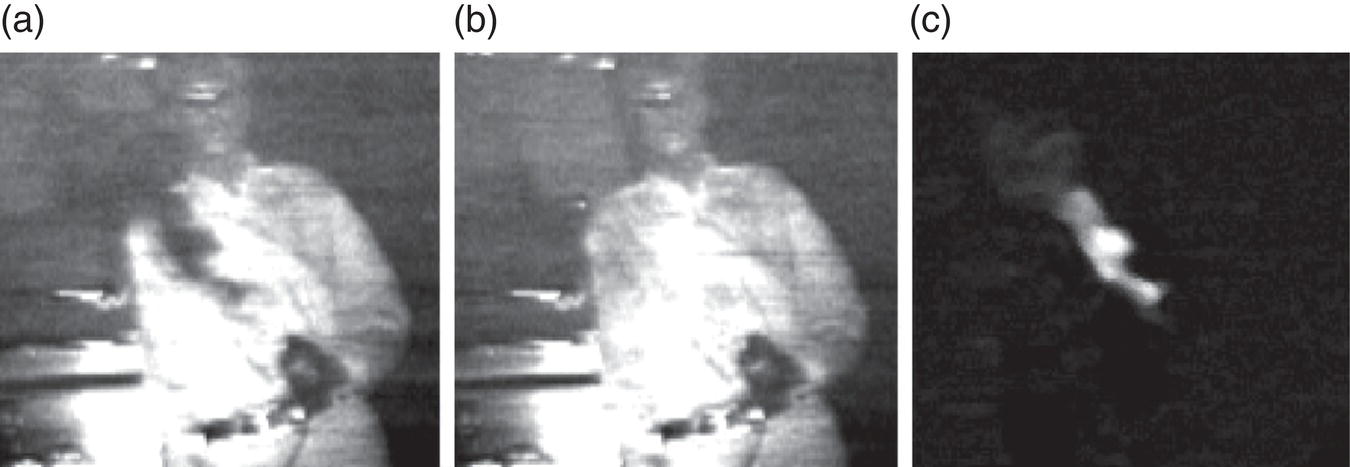
Figure 7.7 Hyperspectral imaging of methane gas. (a) Image of a methane plume acquired at the OPO wavelength in resonance with a strong methane line at 3057.7 cm−1 (3.27 μm). (b) Same when the OPO wavelength is tuned away from resonance. (c) The difference between images (a) and (b), which shows the methane plume.
Source: reproduced from figure 6 of [68], with permission of OSA, The Optical Society.
7.2 Medical Applications
7.2.1 Laser Tissue Interactions
The laser was envisioned as a surgical tool very soon after its first demonstration. Laser surgery provides a noncontact approach capable of cutting tissue with up to single‐cell precision. Short‐pulsed, mid‐infrared lasers are promising tools for human surgical applications that complement other medical lasers, due to their ability to ablate tissue with relatively little damage to surrounding tissue and reduced photochemical side effects.
A residual tissue damage needs to be minimized, hence the most important laser parameters are wavelength, pulse duration, and pulse fluence (pulse energy per unit area). High optical absorption (and small penetration length) of the tissue, typical for the mid‐IR wavelengths, is beneficial since it reduces the pulse fluence needed to superheat the tissue material and drive ablation; also, high optical absorption combined with short pulse duration help to reduce the residual tissue damage. By using laser sources operating in the mid‐infrared, water‐rich, lipid‐rich, and protein‐containing tissues can be ablated with minimal collateral damage.
7.2.1.1 Holmium and Thulium Surgical Lasers
Holmium and thulium lasers operating near 2 μm are most widely used in surgery. Cited below is an extract from the National Institute of Health report regarding the wide use of multi‐watt pulsed Ho:YAG lasers (λ = 2.1 μm): “Ho:YAG lasers, like CO2 lasers, offer precise cutting with minimal damage to adjacent tissue; however, unlike CO2 lasers, they also offer fiber optic delivery (which is ideal for endoscopic use) and the ability to treat tissue in a liquid‐filled environment (e.g. saline, blood). The initial specialty for which the Ho:YAG laser was used was arthroscopic surgery, especially discectomy (the surgical removal of herniated disc material that presses on a nerve root or the spinal cord). Today, it is effectively used in many surgical specialties, including general surgery, urology, laparoscopy, neurosurgery, lithotripsy, angioplasty, orthopedic surgery (e.g. meniscectomy, bone sculpting, plastic surgery, and some experimental surgery, such as cartilage shrinking to tighten loose joints), and dentistry. Because of its broad range of potential applications, it has been called the Swiss Army Knife of lasers” [70].
Also, in soft‐tissue medicine, direct application of the Tm3+‐doped silicate fiber laser has been widespread, owing to the fact that its emission wavelength (1.94 μm) overlaps with the absorption wavelength of the combination vibration of the O─H bond in water. The high‐power thulium fiber laser is capable of vaporization of the prostate and incision of ureteral and bladder tissues. This laser has several potential advantages over the Ho:YAG laser, including smaller size, more efficient operation, more precise incision of tissues, and operation in either the pulsed or the CW mode. Thulium fiber‐based lasers of high average power and short pulse lengths are extremely beneficial for clinical use in rapid vaporization of the prostate and more precise incision of urethral/bladder neck strictures [71].
7.2.1.2 Er:YAG Lasers (λ = 2.9 μm)
Wavelengths near 2.9 μm, which are close to the fundamental absorption peak of stretching vibrations in water, have significant benefits for laser surgery. In tissue, which is typically 70% water, the optical penetration depth near 2.9 μm is approximately 1 μm (water is a natural chromophore in human tissue). This means that the zone of thermal damage is minimized, especially when short pulses are used.
Figure 7.8 displays the absorption coefficient of liquid water over a large (six decades) span of frequencies, from the UV to THz. For clinical use, the major advantage of mid‐IR 2.9‐μm radiation over UV excimer laser radiation is that there are no mutagenic or carcinogenic effects of infrared radiation [72, 73]. Kaufmann et al. have shown that pulsed 2.94‐μm Er:YAG laser surgery allows the extremely precise etching of superficial skin lesions and also has a potential for skin resurfacing [74]. Franjic et al. reported on the highly efficient ablation of tooth enamel using 55‐ps‐long laser pulses at λ ≈ 2.95 μm [75]. The 2.95‐μm wavelength used in the experiment was both in resonance with the OH‐stretch mode of water, and also near the absorption peak of hydroxyapatite crystals (hydroxyapatite is the predominant mineral of dental enamel). The reported fluence needed to achieve ablation was 0.75 J/cm2, several times smaller than the typical ablation thresholds reported for longer laser pulses, with nanosecond and microsecond pulse durations.
Figure 7.8 Absorption coefficient of liquid water: from UV to THz (http://en.wikipedia.org/wiki/File:Absorption_spectrum_of_liquid_water.png). The scale is logarithmic in both directions.
Source: reproduced with permission of Wikipedia.
Fiber lasers of the 3‐μm range (see Chapter 3) have the potential to make a significant impact in laser surgery. Pierce et al. performed preliminary studies of the interaction between a CW erbium‐doped fiber laser operating at around 3 μm and soft biological tissue [76]. The pulse‐periodic nanosecond regime of such lasers would be particularly valuable for laser surgery. Also, solid‐state pulse‐periodic Cr2+:ZnS/ZnSe lasers tuned to 2.9‐μm wavelength (see Chapter 2) can be a good alternative to Er:YAG lasers for tissue ablation, thanks to their high efficiency and ability to operate at high repetition rates.
7.2.1.3 Importance of the Spectral Band of 6–7 μm
The ultimate goal of medical laser ablation is to remove a defined amount of material in an efficient manner with the least amount of collateral damage. Investigations were centered on two specific mid‐IR wavelengths, 6.1 and 6.45 μm. These wavelengths coincide with, respectively, the amide I and amide II absorption bands of protein, and, in addition, with the bending mode of water at 6.1 μm [77]. At these wavelengths, energy is coupled into the protein matrix as well as the bound and unbound water within the tissue.
Edwards et al. reported that targeting laser radiation wavelength to the amide II band of proteins at 6.45 μm leads to the ablation of rat brain cortex tissue with minimal collateral damage while maintaining a substantial ablation rate [78]. The authors found that the collateral damage (coagulation necrosis) at λ = 6.45 μm was much smaller than at λ = 2.94 μm, at the same dosage. They used a free‐electron laser (FEL) in their experiments. FEL is a very flexible source of electromagnetic waves, in terms of tunability, from the UV to THz, although bulky and very expensive, since it involves an electron accelerator. FEL output was in the form of 5‐μs‐long macropulses consisting of a series of short, ~1 ps, pulses repeated at an electron beam repetition rate of 2.85 GHz; thus, there were ~15 000 micropulses per macropulse and each macropulse, with ~20 mJ energy, was emitted at a repetition rate of ~4 Hz.
Peavy et al. [79] made comparison of cortical bone ablations by using different FEL wavelengths, from λ = 2.9 to 9.2 μm. The main conclusion was that the use of wavelengths in the 6.1‐μm amide I to 6.45‐μm amide II region were the most efficient for cutting cortical bone, and produced less collateral thermal injury than cutting with a surgical bone saw.
Since FELs proved too costly and too complex for widespread surgical use, several alternative laser systems at 6–7 μm were developed and have demonstrated the ability to cleanly cut soft tissues with little collateral damage [80, 81]. Mackanos et al. [81] used a 2.8‐μm Er:YSGG laser pumped‐tunable (6–8 μm) ZGP OPO producing millijoule‐level 100‐ns pulses at 5 Hz repetition rate. Among several wavelengths studied, the best results were produced with the two wavelengths: λ = 6.1 μm (the range of high water and protein amide I band absorption), and λ = 6.45 μm (moderate water absorption and high protein amide II band absorption). When using porcine cornea, the average zone of thermal damage at λ = 6.1 μm was found to be 4.1 μm for the OPO and 5.4 μm for the FEL. At λ = 6.45 μm wavelength, the damaged zone was 7.2 μm for the OPO and about the same for the FEL. Thus, the OPO caused similar or less thermal damage when compared with the FEL while generating significantly deeper craters.
Edwards et al. developed a four‐stage laser system that starts from a Nd:YLF laser, uses a combination of stimulated Raman scattering and difference frequency mixing, and generates 6.45‐μm pulses with 3–5‐ns pulse duration, 2‐mJ pulse energy, and 1/2‐Hz repetition rate [82]. The laser system was used to ablate rat brain tissue, where both a collateral damage and an ablation rate compare favorably with those previously observed with an FEL. Kozub et al. demonstrated a Raman‐shifted alexandrite laser for soft tissue ablation (they used goat cornea, rat heart, rat skin, and rat kidney) in the 6–7‐μm wavelength range [83]. In this setup, a tunable alexandrite laser pumped a two‐stage Raman converter; the first‐order Stokes shifted light (near 1 μm) was generated in a deuterium (D2) convertor; this output then generated the second‐order Stokes beam in a multipass hydrogen (H2) convertor to yield mid‐IR light. Tunable output, from 6 to 7 μm, was achieved by tuning the alexandrite laser from 771 to 785 nm. The mid‐IR pulses had up to 9‐mJ pulse energy, 10–20 ns pulse duration, and 10‐Hz repetition rate.
7.2.2 Medical Breath Analysis
One emerging application of mid‐IR lasers is medical exhaled breath analysis, based on spectroscopic methods of trace‐gas detection. Exhaled breath contains trace quantities of some 1000 volatile organic compounds (VOCs). Abnormal concentrations for many of these molecules (biomarkers) have already been correlated to specific diseases and health conditions [84–93]. These include cardiovascular diseases, asthma, gastrointestinal issues, chronic obstructive pulmonary disease (COPD), diabetes, Helicobacter pylori infection, oxidative stress, and different types of cancers. Such correlations allow for fast and noninvasive methods of health screening for a wide variety of medical conditions. Spectroscopic methods can successfully compete in the clinical use with such existing methods as gas chromatography/mass spectroscopy (GC/MS), electrochemical methods, chemiluminescence, and electronic “noses” based on sensor arrays.
The biomarker concentrations in the exhaled breath vary dramatically. Aside from very high water (5%) and CO2 (5%) concentrations, typically, the concentration levels are: 1–100 ppm (part‐per‐million in volume) for methane (CH4), 1–5 ppm for carbon monoxide (CO), 0.3–2.5 ppm for acetone, 0.3–1.6 ppm for nitrous oxide (N2O), 0.1–3 ppm for ammonia (NH3), ∼500 ppb (part‐per‐billion in volume) for methanol, 30–300 ppb for isoprene, 1–80 ppb for nitric oxide (NO), 1–200 ppb for 2,3‐butanedione, and 2–20 ppb for ethane (C2H6) [88–90, 92, 93]. Although clinical breath analysis is currently in its infancy, it offers unique capabilities to the field of medicine, because sampling breath is noninvasive, inherently safe to the subject, and poses minimum risk to the person collecting the sample.
7.2.2.1 Ethane (C2H6)
Ethane is a volatile marker for lipid peroxidation in organisms causing oxidative stress and oxidative damage in the body. Using a tunable CO‐overtone sideband laser tuned to a characteristic ethane absorption peak at 3000.3 cm−1, von Basum et al. measured, via CRDS, ethane concentration in exhaled human breath [94, 95]. The researchers demonstrated that ethane traces down to 0.5 ppb with a time resolution of ~1 second were detectable. Similarly, Halmer et al. demonstrated breath measurements with a detection limit of 0.27 ppb/Hz1/2 by using CRDS with a mid‐IR light source based on bulk DFG [96]. Skeldon et al. used a technique based on a lead‐salt tunable diode laser operating at 3.4 μm, combined with a multipass 170‐m optical cell, to measure the concentration of ethane in exhaled breath with an accuracy of 0.1 ppb [97]. QCLs and ICLs are convenient mid‐IR sources for ultrasensitive and highly selective trace‐gas monitoring. These lasers overcome many of the difficulties encountered in high‐resolution IR absorption with lead‐salt tunable diode lasers: they have better stability, reproducible behavior, and operate without cryogens. Compact chemical sensors based on QCLs and ICLs were demonstrated to be effective in clinical studies that involved the detection of a large number of exhaled biomarkers (e.g. NO, CO, CO2, NH3, C2H6, and OCS) [12, 98, 99]. Parameswaran et al. used off‐axis integrated cavity output spectroscopy (ICOS) with an ICL and demonstrated real‐time measurements of breath ethane with a detection sensitivity of 0.48 ppb/Hz1/2 (e.g. 0.48 ppb within one second integration time) [100].
7.2.2.2 NO
Measurements of exhaled nitric oxide constitute a new way to monitor the inflammatory status in respiratory disorders, such as asthma and other pulmonary conditions. Nitric oxide sensors based on off‐axis ICOS and thermoelectrically cooled CW DFB QCLs operating at 5.45 μm (1835 cm−1) were developed to determine NO in human exhaled breath at the sub‐ppbv levels [99,101–103]. A similar level of minimal detectable NO concentration was achieved in [104], where a thermoelectrically cooled CW QCL operating between 1847 and 1854 cm−1 was used in combination with WMS. Halmer et al. performed concentration measurements of NO for two nitrogen isotopes (14N and 15N) simultaneously, using a CO laser at λ = 5 μm and CW CRDS detection scheme [105]. The authors achieved 800‐ppt sensitivity for 14NO and 40 ppt for 15NO in one‐second averaging time. The detection of the 15NO isotopologue allows use of this molecule as a tracer in biochemical processes.
7.2.2.3 NH3
Exhaled ammonia (NH3) is a potential noninvasive marker of liver and kidney function as well as peptic ulcer disease. A gas analyzer based on a pulsed, thermoelectrically cooled QCL operating near 970 cm−1 (10.3 µm) using CRDS was developed for the detection of exhaled NH3 in human breath. A sensitivity of ∼50 ppb with a 20‐second time resolution was achieved [106].
7.2.2.4 CO
Exhaled carbon monoxide (CO) is a biomarker to assess such medical conditions as cardiovascular diseases, diabetes, nephritis, oxidative stress, and inflammation. Moeskops et al. demonstrated a thermoelectrically cooled DFB pulsed QCL operating between 2176 and 2183 cm−1 (~4.6 μm) that was used to measure CO in human breath [107]. The authors took advantage of the strong CO ro‐vibrational transition at 2176.2835 cm−1 and achieved a detection limit of 175 ppb using a 0.2 second integration time.
7.2.2.5 OCS
Roller et al. reported on a tunable laser absorption spectroscopy system to detect ~30 ppb concentrations of carbonyl sulfide (OCS), which is considered a biomarker for failure of liver function, and for acute lung transplant rejection. The laser sensing system comprised a thermoelectrically cooled pulsed QCL operating at 4.86 μm (2054 cm−1) and a 36‐m‐long optical multipass gas cell [108]. The selectivity of two stable isotopes in air, 12C16O32S and 12C16O34S, was also demonstrated.
Shorter et al. presented a breath analyzer for detection of multiple VOCs based on tunable IR laser differential absorption spectroscopy. The instrument was equipped with two room‐temperature‐pulsed QCLs (Alpes Lasers) [109]. One QCL operated at 1900 cm−1 for NO and CO detection, with the second QCL at 2190 cm−1 for CO and N2O monitoring. The researchers obtained detection precisions of 0.5 ppb for NO, 0.8 ppb for CO, and 0.8 ppb for N2O with an instrument response time of ~1 second – a sensitivity level that is sufficient for real‐world breath analysis.
7.2.2.6 Optical Frequency Comb Spectroscopy for Breath Analysis
While QCL‐ and ICL‐based systems provide robust and highly sensitive detection of trace molecules, they typically operate in narrow spectral regions. OFCs offer enormous potential in the detection of molecules by combining their massive spectral coverage with high spectral resolution. Following the paper by Thorpe et al. [110], where broad‐bandwidth frequency comb in the near‐IR range (1.5–1.7 μm) combined with a high‐finesse external optical cavity and an InGaAs detector array allowed detection of several biomarkers in human breath, including two stable isotopes of CO2, CO, and NH3, the same team later extended the frequency comb‐based sensing technology to the mid‐IR spectral region – in order to dramatically (by ~3 orders of magnitude) increase the detection sensitivity; an optical frequency comb‐based Fourier transform spectrometer (FC‐FTS), which operates in the spectral region of 2.7–4.8 μm (2100–3700 cm−1) with an instantaneous spectral coverage of ~300 cm−1, was introduced [41, 42, 47]. The frequency comb source was based on a high‐power fiber‐laser‐pumped mid‐IR OPO and was combined with an FTS using a fast‐scanning Michelson interferometer. To minimize drifts of the spectrum during the measurement, the OPO comb was phase‐stabilized with respect to the pump laser, whose repetition rate was in turn locked to a microwave reference for long‐term stability. With a multipass gas cell or an external enhancement cavity, the FC‐FTS system was capable of detecting ppb‐level concentrations of various molecules with the spectral resolution of up to 0.0035 cm−1, which is adequate for resolving Doppler‐broadened fine spectral features at low gas pressures.
Overall, OFC spectroscopy has been widely used to detect different volatile compounds suitable for breath analysis. These include detection of hydrogen peroxide (H2O2), acetylene (C2H2), methane (CH4), and nitrous oxide (N2O) with cavity‐enhanced frequency comb absorption spectroscopy using an OPO‐based OFC combined with an FTS [47]; detection of methane, formaldehyde (CH2O), ethylene (C2H4), and carbon monoxide (CO) using intracavity absorption method (by placing molecules under study inside the OPO resonator), combined with an FTS [43]; detection of methane using a difference frequency generator‐based OFC and an optical spectrum analyzer [57]; and detection of methane, carbon monoxide, and NO using an OPO combined with a multipass cell and an FTS [45].
Novel spectroscopic approaches with broadband OFCs based on virtually imaged phased arrays (VIPAs) [39], Vernier spectroscopy [111], and DCS [56, 65,112–114] show great promise for future breath analysis – in terms of their capability for performing fast and precise spectroscopic measurements.
An excellent review by Henderson et al. on laser spectroscopy for breath analysis and its prospective clinical implementation can be found in [115].
7.3 Nano‐IR Imaging and Chemical Mapping
Infrared spectroscopy has been a benchmark technique in a broad range of sciences and industries to characterize and identify materials via vibrational resonances of chemical bonds on a macroscale. Because of the diffraction limit, traditional mid‐IR techniques, such as Fourier‐transform IR (FTIR) microscopy, cannot measure spectra on a scale that is below several wavelengths. The ability to identify material with nanoscale resolution under the tip of an atomic force microscope (AFM) has always been an ambitious goal in the AFM community. While AFM can measure mechanical, electrical, magnetic, thermal, and other properties of materials, it has lacked the robust ability to chemically characterize unknown materials. Keilmann and coworkers [116–119] introduced a new type of microscopy that provides simultaneous spectral identification and a spatial resolution that is far beyond the classical Abbe diffraction limit of one‐half wavelength (λ/2), and also beyond the practical limit (~λ/10) of aperture‐based scanning near‐field optical microscopy (SNOM). The operation principle is based on the fact that the illuminated tip of an AFM can exhibit enhanced optical fields in its neighborhood. Such near fields are modified by the presence of a sample. As a consequence of this near‐field interaction, the scattered light measured in the far field carries information on the sample's local optical properties. This near‐field scattering is the basis of what has been named scattering‐type scanning near‐field optical microscopy (s‐SNOM). In practice, the metallized tip of an AFM serves as a scatterer, and it is the radius of curvature at its apex (typically 20 nm or less) that determines both the mechanical and the optical resolution. Hence, there is no wavelength‐related resolution limit, and a resolution of λ/500 was obtained in the mid‐IR at λ = 10 μm [117]. The principle of s‐SNOM is illustrated in Figure 7.9. Here, a focused IR beam illuminates the tip region of an AFM, where a sample is approached and scanned to produce a topographic image. By recording the backscattered light, an optical image is simultaneously generated at different wavelengths. To improve the signal‐to‐noise ratio, the tip oscillates at the cantilever's mechanical resonance frequency Ω (tapping mode) so that the near‐field optical signal is modulated at Ω and its harmonics. This allows a synchronous lock‐in detection. The IR laser wavelength has a clear effect on the IR image (Figure 7.9c and e). As the wavelength is tuned to a vibrational resonance of polystyrene embedded in polymethylmethacrylate (PMMA), the IR image is darker. This effect disappears at absorption‐free wavelengths, giving clear evidence of near‐field vibrational image contrast [116].
Dazzi and colleagues introduced a different principle of nano‐chemical mapping with an AFM using the photoacoustic (photothermal) effect [120–123]. When the wavelength of a pulsed (nanosecond) laser is tuned to the absorption resonance, a fast heat deposition results in rapid thermal expansion of the absorbing region. This expansion pulse is then detected with the tip of an AFM through detecting the oscillations of the cantilever at its resonant modes. Thus, the system acts as a detector of extremely small motions induced by optical absorption. The detection scheme used here is analogous to PAS, except that it is the AFM tip and cantilever that are used to detect the thermal expansion, instead of a microphone in a gas cell. In life sciences, the AFM‐IR technique provides a label‐free method for mapping IR‐absorbing species in biological materials. For example, Dazzi et al. performed chemical spectroscopy at the subcellular level and demonstrated chemical mapping of the distribution of viruses in the infected bacteria Escherichia coli [123]. By tuning the laser to a DNA absorption peak around 1080 cm−1 (9.26 μm), the authors were able to localize single viruses (bacteriophage T5) inside the bacteria. Figure 7.10 shows that while the topography performed by an AFM was not able to reveal the viruses, the AFM‐IR was able to do so. As a tunable source in their AFM‐IR experiments, the researchers used a pulsed mid‐IR FEL “CLIO” located in the Centre Laser Infrarouge d'Orsay, France [121–123]. In 2010, Anasys Instruments, Inc., commercialized a compact version of the AFM‐IR device that uses a broadly tunable benchtop IR source based on a nanosecond OPO [124].
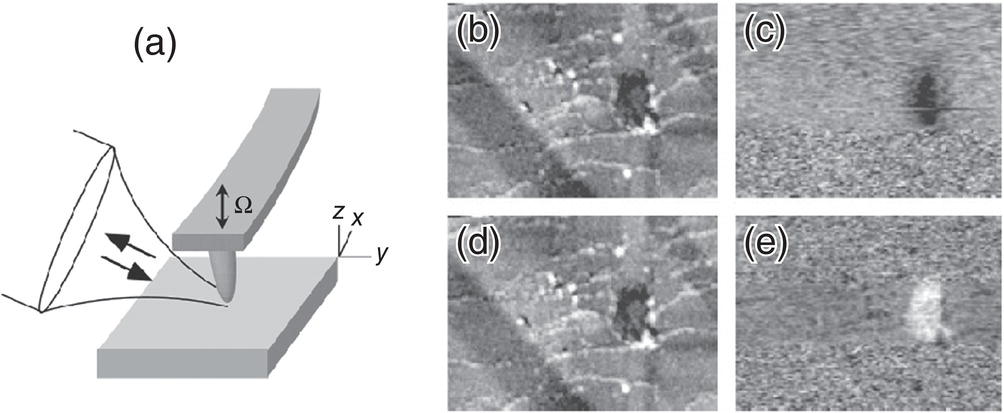
Figure 7.9 (a) Principle of s‐SNOM. A focused laser beam illuminates the tip region of an AFM, where a sample is approached and scanned to produce a topographic image. By recording the backscattered light, an optical image is simultaneously generated at different laser wavelengths. The tip oscillates at the cantilever's mechanical resonance frequency Ω, so that the near‐field optical signal is modulated at Ω and its harmonics, allowing a synchronous lock‐in detection. (b and d) Topographic images and (c and e) corresponding infrared images of polystyrene (PS) embedded in polymethylmethacrylate (PMMA). The image (c) was taken at a wavelength λ = 9.68 μm, and the image (e) at λ = 10.17 μm. One can see a wavelength‐dependent contrast that allows to identify chemical composition. The field of view in (b–e) is 3.5 × 2.5 μm.
Source: reproduced from figures 1 and 4 of [116], with permission of Springer Nature.
Lu and Belkin reported a photothermal technique that allows obtaining AFM‐IR spectra under low‐average‐power illumination from a pulsed tunable QCL (energy per pulse 4 nJ, duration 40 ns) [125]. To detect minute thermal expansion in a polymer deposited on a silicon substrate, the authors tuned the repetition frequency of the QCL to be in resonance with the mechanical oscillation frequency of the AFM cantilever, which is in the range 10–200 kHz. The enhancement of the AFM response, as compared to a single pulse excitation, is equal to Q, where Q ≈ 100 is the quality factor of the cantilever oscillation. The achieved spatial resolution of 50 nm (λ/170) was determined by the thermal diffusion length in a sample during the laser pulse duration; it may be further improved using shorter QCL pulses [125]. This technique can be regarded as a nanoscale analog of the QEPAS [17].
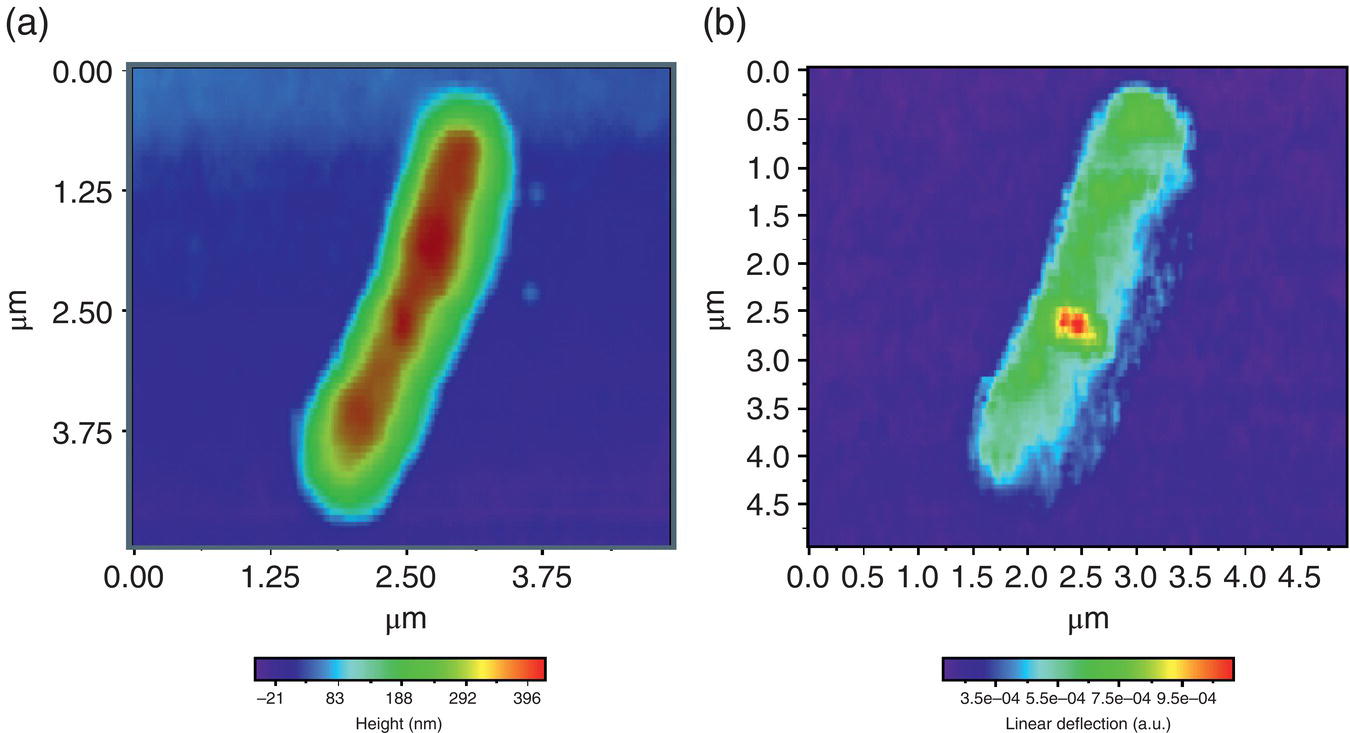
Figure 7.10 (a) Topography and (b) the corresponding AFM‐IR chemical mapping of the infected Escherichia coli cell. Although the topography performed by an AFM cannot image the viruses, the AFM‐IR was able to do so via infrared absorption contrast.
Source: reproduced from figure 4 of [122], with permission of Elsevier.
7.4 Plasmonics in the Mid‐IR
Plasmons – charge oscillations at the interface between a dielectric and a metal – were first studied in the visible regime, with increased interest now extending to the mid‐IR [126]. Plasmons give rise to very strong local fields and can be guided along the interface in the form of a traveling wave, known as a surface plasmon polariton. The excitement generated by mid‐IR plasmonics comes from the interplay between circuit (antenna) theory and wave optics. To date, research in mid‐IR plasmonics is focused on emitters (in particular, related to QCLs), improved IR detectors, and chemical sensing surfaces. Another goal of mid‐IR plasmonics is to increase the absorption in a given volume of material: in mid‐IR detectors, smaller volumes provide lower noise, and higher material absorption results in a stronger output signal. One of the ways to achieve this goal is to use an antenna‐like structure to couple incident light to surface plasmons, which are focused by the antenna to a small detection region.
Based on mid‐IR plasmonics, Yu, Wang, and Capasso demonstrated a QCL with improved beam characteristics. This was achieved by monolithically integrating specially designed plasmonic structures on the cleaved substrate of a QCL, below the laser waveguide [127]. The plasmonic structure creates desirable far‐field radiation by coupling laser emission into surface waves propagating on the substrate and by coherently scattering the energy of the waves into the free space. This is illustrated in Figure 7.11a, which shows a scanning electron microscope (SEM) image of a λ = 9.9 μm QCL with an integrated 1D plasmonic collimator, which is made of gold and has the following geometry: aperture size = 2 × 25 μm, grating period = 8.9 μm, distance between aperture and the first grating groove = 7.3 μm, groove width = 0.8 μm, and groove depth = 1.5 μm. One can see from Figure 7.11c that the measured divergence of the beam is dramatically improved in the “fast” (vertical) direction when the plasmonic collimator is used.
The other avenue of plasmonics is spectroscopic chemical sensing with surface‐enhanced IR absorption using metamaterials. Metamaterials are artificially constructed materials that consist of subwavelength elements whose spatially averaged response can be treated as that of a homogeneous medium with a characteristic effective permittivity and permeability. This permits the optical properties to be engineered, enabling, for example, near‐unity absorbance at the surface [128, 129]. Chen et al. demonstrated a dual‐band perfect absorber for plasmon‐enhanced infrared spectroscopy using an asymmetric cross‐shaped antenna made of gold nanoparticles that were placed on top of a thick gold film and separated from it by a magnesium fluoride (MgF2) spacer layer [129]. The authors demonstrated, by mid‐IR reflection spectroscopy, strong absorption enhancement for the two absorption bands: the C─H band at 2850 cm−1 (3.5 μm) and C═O band at 1700 cm−1 (5.9 μm) of a thin (4‐nm‐thick) polymer film. Even despite the fact that the two bands were well separated in wavelength, the authors demonstrated that both of them have shown a large field enhancement.
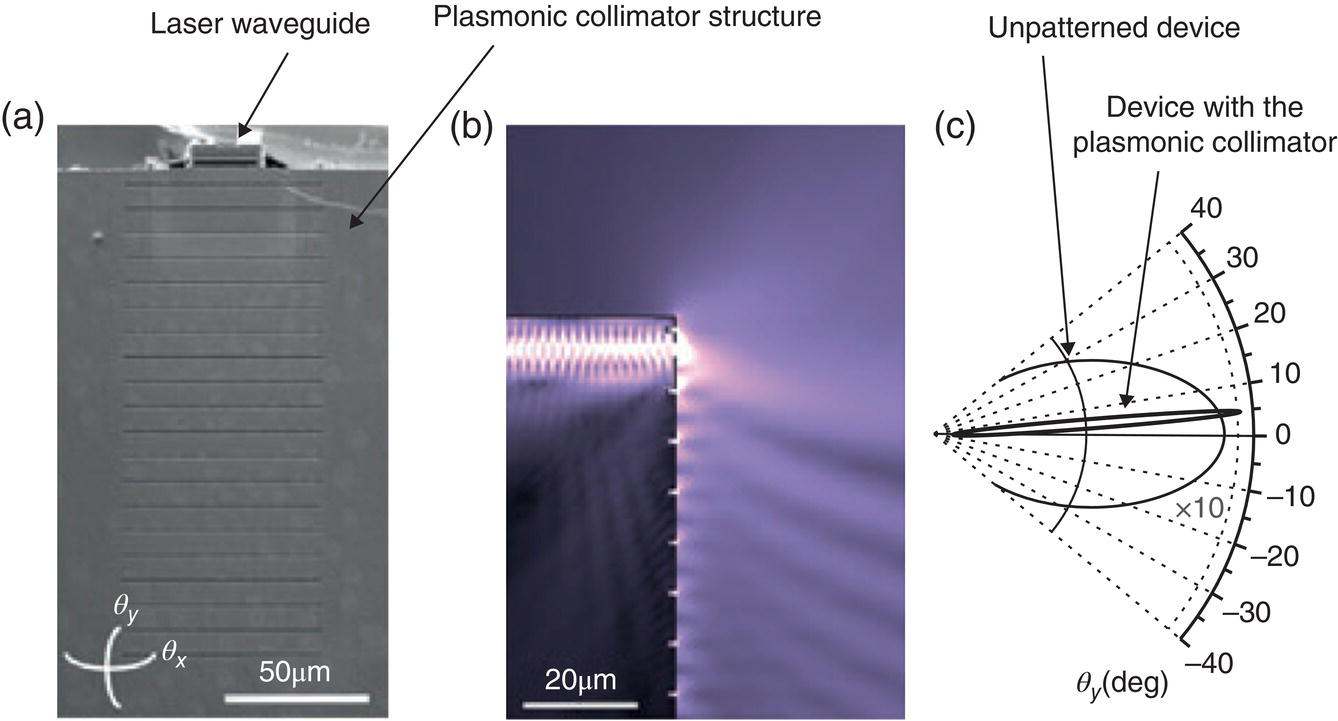
Figure 7.11 (a) SEM image of a λ = 9.9 μm QCL with an integrated 1D plasmonic collimator, which is made of gold. (b) Simulated electric‐field distribution of the QCL. (c) Measured far‐field intensity profiles in the vertical direction of the device with and without the plasmonic collimator.
Source: reproduced from figure 2 of [127], with permission of Wiley.
7.5 Infrared Countermeasures
Infrared countermeasure (IRCM) systems are used to defend the host aircraft from heat‐seeking attacking missiles by detecting the approaching threat and disabling it through the use of directed laser energy (Figure 7.12). The laser intensity should be higher than that of the target (usually blackbody radiation from a jet engine) in the appropriate mid‐IR range. When the mid‐IR radiation produced by an IRCM system is seen by a missile seeker, it overwhelms the signal from the aircraft jet and confuses the missile.1 The missile will begin to deviate from the target, rapidly breaking lock. Once an infrared seeker breaks lock (a typical field of view of 1–2°), it rarely reacquires the target. Typically, high‐power broadband pulse‐periodic ZGP OPO systems with 10‐W average power at 3–5 μm (BAE systems) or high‐power QCL systems with 10‐W average power (the high‐power beam is obtained by combining outputs from few QCLs) at 4–5‐μm wavelength (Daylight Solutions, Pranalytica) are utilized. Northrop Grumman uses similar technologies (OPOs and QCLs) in their multiband IRCM laser systems.
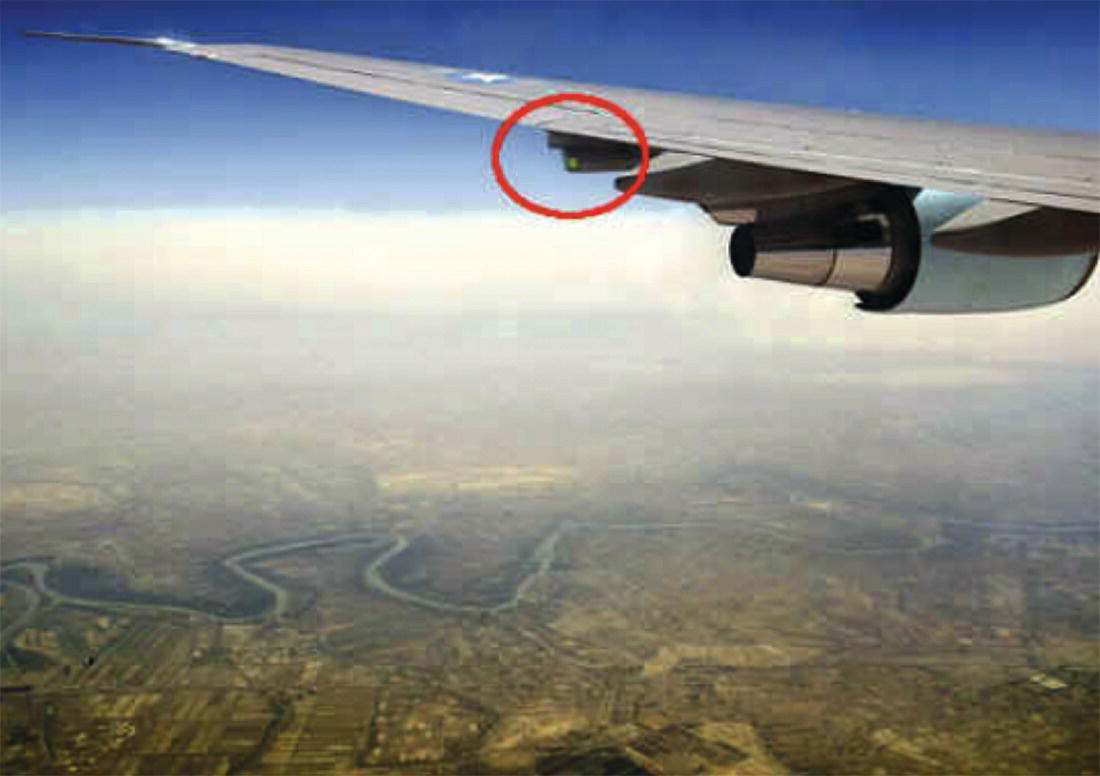
Figure 7.12 Infrared countermeasure (IRCM) system (circled in red color) on board of an airplane.
7.6 Extreme Nonlinear Optics and Attosecond Science
When energetic few‐cycle laser pulses interact with an atomic gas (He, Ne, Ar, etc.), with peak intensities >1014 W/cm2, one can generate high odd‐number optical harmonics reaching the extreme UV and even X‐ray spectral range. High‐harmonic generation (HHG) in this case can no longer be explained by perturbative nonlinear optics, which predicts decrease of the harmonic power with harmonic number. Rather, the process is initiated by electron tunneling and completed by the recollision of a highly energetic electron with its associated ion. Three decades of research into high‐order harmonic generation in gases has uncovered several practical routes for generating phase‐matched coherent X‐ray beams using tabletop femtosecond lasers [130, 131]. A bright supercontinuum that spans the entire spectrum from the UV to more than 1.6 keV with the harmonic number as high as >5001 can now be produced, allowing, in principle, the generation of pulses as short as 2.5 attoseconds. This opens up two major classes of applications: (i) creating a tabletop source of coherent X‐rays that might be used for super‐resolution imaging in medicine and nanotechnology; (ii) in fundamental science – the attosecond time durations of high‐harmonic pulses can be applied to capture the fastest events in the natural world, for instance, for imaging molecular orbitals.
The highest energy for the HHG photon emitted is given by the microscopic single‐atom cutoff rule:
where Ip is the ionization potential of the gas atom and Up is the ponderomotive energy of a free electron (the average energy of an electron driven by the oscillating laser field), which is proportional to the driving laser intensity and the wavelength squared. The quadratic wavelength dependence suggests a counterintuitive result that using a longer‐wavelength driving laser should result in a higher cutoff photon energy (and thus more energetic X‐rays). This prediction was verified by several experiments in different laboratories [131].
Figure 7.13 Experimental HHG spectra emitted under phase‐matching conditions at different driving‐laser wavelengths: 0.8, 1.3, 2, and 3.9 μm. One can see that for a longer wavelength driving laser, larger X‐ray cutoff photon energy was achieved. The inset shows that the bandwidth of the coherent supercontinuum produced with λ = 3.9‐μm laser could support a single‐cycle X‐ray pulse with 2.5‐attosecond duration (Fourier‐transform limit). The plot also shows at the bottom the inner‐shell absorption edges of several materials (Fe, Co, Ni, etc.).
Source: reproduced from figure 1(B) of [131], with permission of AAAS.
Figure 7.13 shows experimental HHG spectra emitted under phase‐matching conditions as a function of driving‐laser wavelength of 0.8, 1.3, 2, and 3.9 μm. One can see that for a longer‐wavelength driving laser, larger X‐ray cutoff photon energy was achieved. Popmintchev et al. used 80‐fs, 10‐mJ pulses at 20‐Hz repetition rate at λ = 3.9 μm from an optical parametric chirped‐pulse amplification (OPCPA) system. The phase‐matched HHG emission was produced by focusing the optical beam into a 200‐μm diameter in a 5‐cm‐long, high‐pressure He gas‐filled hollow waveguide, with the spectrum extending beyond 1.6 keV (λ < 7.7 Å). The broadband X‐ray supercontinuum could support (if properly compressed) a single‐cycle X‐ray pulse with 2.5‐attosecond duration (inset to Figure 7.13) [131].
Weisshaupt et al. have demonstrated the generation of hard X‐ray photons, consisting of the characteristic X‐ray lines of copper (Cu) at energies Kα ≈ 8.0 keV and Kβ ≈ 8.9 keV and of a broad Bremsstrahlung component that extended to ~100 keV, by the interaction between a Cu target and intense 15‐mJ femtosecond mid‐IR pulses at 3.9 μm, generated by OPCPA [132]. X‐ray generation occurred in this case via inner‐shell ionization of copper followed by a radiative transition of an outer‐shell electron into the unoccupied inner shell. The flux of X‐ray photons was about 25 times higher than in the case when 800‐nm pulses were used. This enhancement of the X‐ray flux is caused by the much more efficient electron acceleration at a longer wavelength, which results in higher kinetic energies of the electrons accelerated in the optical field. This makes high‐energy, long‐wavelength (>3 μm) lasers with few‐cycle pulse duration and high repetition rate a highly desired driving source for the generation of coherent high‐harmonic X‐rays and isolated attosecond pulses in atomic gases (see Chapter 2 for the recent solid‐state laser development).
HHG with strong electromagnetic fields has also been demonstrated in bulk crystalline materials. Chin and coauthors have observed extreme nonlinear optical phenomena in bulk semiconductors, such as ZnTe, ZnS, ZnSe, and GaAs, produced by intense (109–1011 W/cm2) mid‐IR pulses at λ = 3.5–3.9 μm [133]. These phenomena include generation of multiple mid‐IR harmonics (up to the seventh harmonic in the case of ZnSe) below the bandgap edge of semiconductors, accompanied by significant broadening of mid‐IR harmonic spectra, which the authors attribute to the onset of self‐phase modulation (SPM) as well as cross‐phase modulation (XPM) at these high intensities.
Ghimire et al. demonstrated nonperturbative (i.e. that cannot be described in the frame of nonlinear optics based on perturbation theory) HHG in a strongly driven wide‐bandgap (3.2 eV) semiconductor ZnO using 3.2–3.7‐μm (0.34–0.38‐eV) few‐cycle laser pulses having peak intensity 5 × 10¹² W/cm2 and field strength 60 MV/cm (corresponding to 0.6 V/Å, comparable to atomic field strength) [134]. The authors measured harmonics up to the 25th order (Figure 7.14), extending to the photon energy of 9.5 eV (λ = 130 nm) – more than 6 eV above the band edge. They also found that the high‐energy cutoff scaled linearly with the driving field (in contrast to the atomic case where the scaling is linear to the intensity). The spectrum comprised odd, or both odd and even, harmonics, depending on crystallographic orientation. Vampa et al. suggested, based on their high‐field HHG experiments in ZnO, that at similar field strengths and laser wavelengths, a recollision between an electron and its associated hole is the primary source of high harmonics [135].
Also, using few‐cycle mid‐IR laser excitation at the driving laser center wavelength of 10 μm (30 THz), with peak fields of up to 72 MV/cm, high harmonics have been generated in a 220‐μm‐thick semiconducting gallium selenide (GaSe) [136]. The authors observed the emission of phase‐stable transients, covering the entire terahertz‐to‐visible spectral domain between λ = 3 mm and λ = 440 nm (0.1–675 THz). Emission between 0.1 and 10 THz originated from the optical rectification in GaSe, while the shorter wavelengths were generated via HHG (up to order n = 23) in the non‐perturbative regime. The authors attributed the main mechanism of HHG to coherent interband polarization combined with dynamical Bloch oscillations [136].
Langer et al. studied the effects of strong optical field in a monolayer of tungsten diselenide (WSe2). Electron–hole pairs were generated by a near‐IR pulse and were subsequently accelerated by a mid‐IR transient with center wavelength 7.5 μm (40 THz), ~3‐cycle pulse duration, and peak electric field (in air) of 18 MV/cm, followed by a recollision of the constituent electron and hole. Recolliding electrons and holes emitted their kinetic energy in high‐order sidebands of the near‐IR pump. Despite a low sample thickness, harmonic sidebands (spaced by mid‐IR laser frequency) up to order n = 12 (λ = 340 nm, 880 THz) were observed [137].
Figure 7.14 (a) High‐order harmonic spectra from a 500‐μm‐thick ZnO crystal for two λ = 3.25‐μm driving pulse energies of 0.52 and 2.63 μJ (in the latter case the peak intensity was ~5 TW/cm2 and the field strength ~0.6 V/Å). The inset shows an expanded linear‐scale view near the cutoff for the case of pulse energy 2.63 μJ. The dotted vertical line is the ZnO band edge, where the residual long‐lived fluorescence signal is present. (b) Drive‐laser field dependence of the cutoff photon energy showing that the latter scales linearly with the driving laser field.
Source: reproduced from figure 1 of [134], with permission of Springer Nature.
7.7 Other Applications
7.7.1 Laser Wake‐field Accelerators
Particle accelerators are used in a wide variety of fields, ranging from high‐energy physics to medicine and biology. The accelerating fields in conventional radio frequency (RF) accelerators are limited to a few tens of MeV per meter, owing to material breakdown at the walls of the structure. Thus, the production of energetic particle beams currently requires large‐scale accelerators and expensive infrastructures. Replacing RF accelerator technology with compact laser‐plasma accelerators promises an economical alternative to attaining super‐relativistic electron energies [138–140]. Laser pulses, as they propagate through plasma, create a strong longitudinal accelerating field, proportional to the square root of plasma density; for example, one can get ∼1 GeV/cm at a plasma density of 1018 cm−3. Trapped in such a wake, electrons pick up several GeV of kinetic energy from a compact (1–10 cm) accelerating stage. Recent demonstrations of such high‐gradient electron acceleration, combined with good control over the properties of the accelerated beam, encourage researchers to consider plasma accelerators up to TeV energies that can be used for next‐generation e−e+ colliders and beyond. Pogorelsky et al. [141] compared the performance of laser‐plasma accelerators based on near‐IR solid‐state lasers (Ti:sapphire) and those based on long‐wavelength (9–11 μm) mid‐IR lasers and identified several advantages of selecting mid‐IR lasers for these applications.
7.7.2 Laser Acceleration in Dielectric Structures
An alternative path to creating lab‐size particle accelerators is laser acceleration in specially fabricated periodic dielectric microstructures, which directly couple an electron beam and an accelerating optical field [142, 143]. At optical frequencies, dielectric materials withstand high fields, roughly two orders of magnitude larger than metals. Together with the large optical field strength attainable with short laser pulses, dielectric laser accelerators may support acceleration gradients in the multi‐GeV per meter range. Peralta et al. demonstrated particle acceleration in a periodic structure fabricated by bonding two fused‐silica wafers, processed via standard optical lithography and reactive ion etching techniques, and powered by a 800‐nm‐wavelength mode‐locked Ti:sapphire laser [142]. The authors observed a maximum acceleration gradient of ~190 MeV/m. However, dielectric structures based on silicon are considered to be the most promising for future laser accelerator applications, and accelerating gradients in excess of 200 MeV/m have already been demonstrated [144]. Ideally, for silicon, the accelerating laser needs to have low photon energy, less than half the bandgap of silicon (0.55 eV), in order to avoid detrimental linear as well as two‐photon absorption. This might be possible with the use of mid‐IR lasers with λ > 2 μm, for example solid‐state or fiber‐based thulium laser systems.
7.7.3 Free‐space Communications
Free‐space communications is an important technique for bridging the so‐called “last mile” in telecommunication networks, especially in urban areas. QCLs are very suitable for such applications because (i) they have fast internal lifetimes that might allow for modulation frequencies of up to 5–10 GHz, (ii) their emission wavelength can be chosen to be in the atmospheric transmission windows, i.e. around 5 or at 8–10 μm, and (iii) these emission wavelengths are barely affected by atmospheric conditions such as rain and fog.
Blaser et al. showed a free‐space optical data link between two buildings separated by 350 m using a Peltier‐cooled QCL operating at λ = 9.3 μm and a room‐temperature HgCdTe detector, with the highest transmitted modulation frequency 330 MHz. The signal was successfully transmitted even under foggy conditions with a visibility range below 100 m [145]. Martini et al. demonstrated a high‐speed optical link over ~200 m of free space using a QCL with an emission wavelength of 8.1 μm; the laser was packaged and processed for high‐frequency modulation. Complex digital data (comprising up to 650 multimedia satellite channels) in the frequency region from 900 MHz to 1.45 GHz were transmitted [146]. Corrigan et al. performed a multiwavelength test in the New York metropolitan area under realistic weather conditions and showed that a mid‐IR QCL source at λ = 8.1 μm provides much better optical link stability as compared to near‐IR wavelengths (1.3 and 1.5 μm) during fog formation [147].
7.7.4 Organic Material Processing
Thin polymer films are widely used in electronics, photonics, sensor technology, organic electronics and optoelectronics, and medicine. Resonant IR pulsed laser deposition (RIR‐PLD) [148] is a promising new approach for vacuum‐phase deposition of polymers and organic molecules. As a dry, clean, and environmentally friendly technique for producing organic films, it avoids many problems caused by solvents associated with commonly used spin‐ or dip coating methods. The method employs a pulsed mid‐IR laser source with a wavelength tuned to one of the molecular vibrational bands of the organic molecule to be ablated. RIR‐PLD has been successfully employed for deposition of a variety of technologically important polymers with applications ranging from micro‐electro mechanical systems (MEMS), biological and chemical sensors to biocompatible medical‐device coatings and biodegradable time‐release drug‐delivery encapsulation. In all these experiments, an FEL was used as an optical source for RIR‐PLD, most often tuned to the C─H or O─H stretch vibrational bands around 3.4 and 2.9 μm, respectively. A number of key laser parameters that appear to be important for this technology include: laser pulse durations in the ps range, pulse energies around 1 μJ, and pulse repetition periods much shorter than the cooling time of the laser‐heated layer (100 μs to 1 ms). An elegant tabletop optical source for polymer ablation based on two‐stage pulsed optical parametric amplification, as an alternative to FEL, was developed for this purpose [149].
References
- 1 Gordon, I.E., Rothman, L.S., Hill, C., Kochanov, R.V., Tan, Y., Bernath, P.F., Birk, M., Boudon, V., Campargue, A., Chance, K.V., Drouin, B.J., Flaud, J.‐M., Gamache, R.R., Hodges, J.T., Jacquemart, D., Perevalov, V.I., Perrin, A., Shine, K.P., Smith, M.‐A.H., Tennyson, J., Toon, G.C., Tran, H., Tyuterev, V.G., Barbe, A., Császár, A.G., Devi, V.M., Furtenbacher, T., Harrison, J.J., Hartmann, J.‐M., Jolly, A., Johnson, T.J., Karman, T., Kleiner, I., Kyuberis, A.A., Loos, J., Lyulin, O.M., Massie, S.T., Mikhailenko, S.N., Moazzen‐Ahmadi, N., Mu¨ller, H.S.P., Naumenko, O.V., Nikitin, A.V., Polyansky, O.L., Rey, M., Rotger, M., Sharpe, S.W., Sung, K., Starikova, E., Tashkun, S.A., VanderAuwera, J., Wagner, G., Wilzewski, J., Wcisło, P., Yu, S., and Zak, E.J. (2017). The HITRAN 2016 molecular spectroscopic database. J. Quant. Spectrosc. Radiat. Transf. 203: 3–69.
- 2 Tittel, F.K., Richter, D., and Fried, A. (2003). Mid‐infrared laser applications in spectroscopy. In: Solid‐State Mid‐Infrared Laser Sources, Topics in Applied Physics, vol. 89 (eds. I.T. Sorokina and K.L. Vodopyanov). Berlin: Springer.
- 3 Blaser, S., Yarekha, D., Hvozdara, L., Bonetti, Y., Muller, A., Giovannini, M., and Faist, J. (2005). Room temperature, continuous‐wave, single‐mode quantum‐cascade lasers at λ≈5.4 μm. Appl. Phys. Lett. 86: 041109.
- 4 Evans, A., Yu, J.S., David, J., Doris, L., Mi, K., Slivken, S., and Razeghi, M. (2004). High‐temperature, high‐power, continuous‐wave operation of buried heterostructure quantum‐cascade lasers. Appl. Phys. Lett. 84: 314.
- 5 Yu, J.S., Slivken, S., Evans, A., Darvish, S.R., Darvish, R., Nguyen, J., and Razeghi, M. (2006). High‐power λ~9.5 μm quantum‐cascade lasers operating above room temperature in continuous‐wave mode. Appl. Phys. Lett. 88: 091113.
- 6 Diehl, L., Bour, D., Corzine, S., Zhu, J., Hofler, G., Loncar, M., Troccoli, M., and Capasso, F. (2006). High temperature continuous wave operation of strain‐balanced quantum cascade lasers grown by metal organic vapor‐phase epitaxy. Appl. Phys. Lett. 89: 081101.
- 7 Maulini, R., Mohan, A., Giovannini, M., Faist, J., and Gini, E. (2006). External cavity quantum‐cascade lasers tunable from 8.2 to 10.4 um using a gain element with a heterogeneous cascade. Appl. Phys. Lett. 88: 201113.
- 8 Aellen, T., Blaser, S., Beck, M., Hofstetter, D., Faist, J., and Gini, E. (2003). Continuous‐wave distributed‐feedback quantum‐cascade lasers on a Peltier cooler. Appl. Phys. Lett. 83: 1929.
- 9 Bakhirkin, Y., Kosterev, A., Curl, R., Tittel, F., Yarekha, D., Hvozdara, L., Giovannini, M., and Faist, J. (2005). Sub‐ppbv nitric oxide concentration measurements using cw thermoelectrically cooled quantum cascade laser‐based integrated cavity output spectroscopy. Appl. Phys. B 82: 149.
- 10 Wysocki, G., Curl, R.F., Tittel, F.K., Tittel, F.K., Tittel, K., Maulini, R., Bulliard, J.M., and Faist, J. (2005). Widely tunable mode‐hop free external cavity quantum cascade laser for high resolution spectroscopic applications. Appl. Phys. B 81: 769.
- 11 Kosterev, A., Wysocki, G., Bakhirkin, Y., So, S., Lewicki, R., Fraser, M., Tittel, F., and Curl, R.F. (2008). Application of quantum cascade lasers to trace gas analysis. Appl. Phys. B 90: 165.
- 12 Nelson, D.D., Shorter, J.H., McManus, J.B., and Zahniser, M.S. (2002). Sub‐part‐per‐billion detection of nitric oxide in air using a thermoelectrically cooled mid‐infrared quantum cascade laser spectrometer. Appl. Phys. B 75: 343.
- 13 Curl, R.F., Capasso, F., Gmachl, C., Kosterev, A.A., McManus, B., Lewicki, R., Pusharsky, M., Wysocki, G., and Tittel, F.K. (2010). Quantum cascade lasers in chemical physics. Chem. Phys. Lett. 487: 1.
- 14 Wysocki, G., Lewicki, R., Curl, R.F., Tittel, F.K., Diehl, L., Capasso, F., Troccoli, M., Hofler, G., Bour, D., Corzine, S., Maulini, R., Giovannini, M., and Faist, J. (2008). Widely tunable mode‐hop free external cavity quantum cascade lasers for high resolution spectroscopy and chemical sensing. Appl. Phys. B 92: 305.
- 15 Chao, X., Jeffries, J.B., and Hanson, R.K. (2012). Wavelength‐modulation‐spectroscopy for real‐time, in situ NO detection in combustion gases with a 5.2 μm quantum‐cascade laser. Appl. Phys. B 106: 987.
- 16 Zharov, V.P. and Letokhov, V.S. (1986). Laser Optoacoustic Spectroscopy. Springer Series in Optical Sciences, vol. 37. Berlin: Springer.
- 17 Kosterev, A.A., Bakhirkin, Y.A., Curl, R.F., and Tittel, F.K. (2002). Quartz‐enhanced photoacoustic spectroscopy. Opt. Lett. 27: 1902.
- 18 Kosterev, A.A., Tittel, F.K., Serebryakov, D., Malinovsky, A., and Morozov, A. (2005). Applications of quartz tuning forks in spectroscopic gas sensing. Rev. Sci. Instrum. 76: 043105.
- 19 Lewicki, R., Wysocki, G., Kosterev, A.A., and Tittel, F.K. (2007). QEPAS based detection of broadband absorbing molecules using a widely tunable, cw quantum cascade laser at 8.4 μm. Opt. Express 15: 7357.
- 20 Patimisco, P., Scamarcio, G., Tittel, F.K., and Spagnolo, V. (2014). Quartz‐enhanced photoacoustic spectroscopy: a review. Sensors 14: 6165.
- 21 Dong, L., Spagnolo, V., Lewicki, R., and Tittel, F.K. (2011). Ppb‐level detection of nitric oxide using an external cavity quantum cascade laser based QEPAS sensor. Opt. Express 19: 24037.
- 22 Scherer, J.J., Paul, J.B., O'Keefe, A., and Saykally, R.J. (1997). Cavity ringdown laser absorption spectroscopy: history, development, and application to pulsed molecular beams. Chem. Rev. 97: 25.
- 23 Romanini, D., Kachanov, A.A., Sadeghi, N., and Stoeckel, F. (1997). CW cavity ring down spectroscopy. Chem. Phys. Lett. 264: 316.
- 24 Kosterev, A.A., Malinovsky, A.L., Tittel, F.K., Gmachl, C., Capasso, F., Sivco, D.L., Baillargeon, J.N., Hutchinson, A.L., and Cho, A.Y. (2001). Cavity ringdown spectroscopic detection of nitric oxide with a continuous‐wave quantum‐cascade laser. Appl. Opt. 40: 5522.
- 25 Galli, I., Bartalini, S., Ballerini, R., Barucci, M., Cancio, P., De Pas, M., Giusfredi, G., Mazzotti, D., Akikusa, N., and De Natale, P. (2016). Spectroscopic detection of radiocarbon dioxide at parts‐per‐quadrillion sensitivity. Optica 3: 385.
- 26 Horstjann, M., Bakhirkin, Y.A., Kosterev, A.A., Curl, R.F., Tittel, F.K., Wong, C.M., Hill, C.J., and Yang, R.Q. (2004). Formaldehyde sensor using interband cascade laser based quartz‐enhanced photoacoustic spectroscopy. Appl. Phys. B 79: 799.
- 27 Wysocki, G., Bakhirkin, Y., So, S., Tittel, F.K., Hill, C.J., Yang, R.Q., and Fraser, M.P. (2007). Dual interband cascade laser based trace‐gas sensor for environmental monitoring. Appl. Opt. 46: 8202.
- 28 Lundqvist, S., Kluczynski, P., Weih, R., von Edlinger, M., Nähle, L., Fischer, M., Bauer, A., Höfling, S., and Koeth, J. (2012). Sensing of formaldehyde using a distributed feedback interband cascade laser emitting around 3493 nm. Appl. Opt. 51: 6009.
- 29 Richter, D., Fried, A., Wert, B.P., Walega, J.G., and Tittel, F.K. (2002). Development of a tunable mid‐IR difference frequency laser source for highly sensitive airborne trace gas detection. Appl. Phys. B 75: 281.
- 30 Chen, W., Cousin, J., Poullet, E., Burie, J., Boucher, D., Gao, X., Sigrist, M.W., and Tittel, F.K. (2007). Continuous‐wave mid‐infrared laser sources based on difference frequency generation. C R Phys. 8: 1129.
- 31 Richter, D., Fried, A., and Weibring, P. (2009). Difference frequency generation laser based spectrometers. Laser Photon. Rev. 3: 343.
- 32 van Herpen, M.M.J.W., Bisson, S.E., and Harren, F.J.M. (2003). Continuous‐wave operation of a single‐frequency optical parametric oscillator at 4–5 μm based on periodically poled LiNbO3. Opt. Lett. 28: 2497.
- 33 Henderson, A. and Stafford, R. (2006). Low threshold, singly‐resonant CW OPO pumped by an all‐fiber pump source. Opt. Express 14: 767.
- 34 Ngai, A.K.Y., Persijn, S.T., von Basum, G., and Harren, F.J.M. (2006). Automatically tunable continuous‐wave optical parametric oscillator for high‐resolution spectroscopy and sensitive trace‐gas detection. Appl. Phys. B 85: 173.
- 35 von Basum, G., Halmer, D., Hering, P., Mu¨rtz, M., Schiller, S., Mu¨ller, F., Popp, A., and Ku¨hnemann, F. (2004). Parts per trillion sensitivity for ethane in air with an optical parametric oscillator cavity leak‐out spectrometer. Opt. Lett. 29: 797.
- 36 Todd, M.W., Provencal, R.A., Owano, T.G., Paldus, B.A., Kachanov, A., Vodopyanov, K.L., Hunter, M., Coy, S.L., Steinfeld, J.I., and Arnold, J.T. (2002). Application of mid‐infrared cavity‐ringdown spectroscopy to trace explosives vapor detection using a broadly tunable (6–8 μm) optical parametric oscillator. Appl. Phys. B 75: 367.
- 37 Schliesser, A., Picque, N., and Hansch, T.W. (2012). Mid‐infrared frequency combs. Nat. Photonics 6: 440.
- 38 Diddams, S.A., Hollberg, L., and Mbele, V. (2007). Molecular fingerprinting with the resolved modes of a femtosecond laser frequency comb. Nature 445: 627.
- 39 Nugent‐Glandorf, L., Neely, T., Adler, F., Fleisher, A.J., Cossel, K.C., Bjork, B., Dinneen, T., Ye, J., and Diddams, S.A. (2012). Mid‐infrared virtually imaged phased array spectrometer for rapid and broadband trace gas detection. Opt. Lett. 37: 3285.
- 40 Fleisher, A.J., Bjork, B.J., Bui, T.Q., Cossel, K.C., Okumura, M., and Ye, J. (2015). Mid‐infrared time‐resolved frequency comb spectroscopy of transient free radicals. J. Phys. Chem. Lett. 5: 2241.
- 41 Adler, F., Maslowski, P., Foltynowicz, A., Cossel, K.C., Briles, T.C., Hartl, I., and Ye, J. (2010). Mid‐infrared Fourier transform spectroscopy with a broadband frequency comb. Opt. Express 18: 21861.
- 42 Foltynowicz, A., Maslowski, P., Ban, T., Adler, F., Cossel, K.C., Briles, T.C., and Ye, J. (2011). Optical frequency comb spectroscopy. Faraday Discuss. 150: 23.
- 43 Haakestad, M.W., Lamour, T.P., Leindecker, N., Marandi, A., and Vodopyanov, K.L. (2013). Intracavity trace molecular detection with a broadband mid‐IR frequency comb source. J. Opt. Soc. Am. B 30: 631.
- 44 Meek, S.A., Poisson, A., Guelachvili, G., Hänsch, T.W., and Picqué, N. (2014). Fourier transform spectroscopy around 3 μm with a broad difference frequency comb. Appl. Phys. B 114 (4): 573.
- 45 Khodabakhsh, A., Ramaiah‐Badarla, V., Rutkowski, L., Johansson, A.C., Lee, K.F., Jiang, J., Mohr, C., Fermann, M.E., and Foltynowicz, A. (2016). Fourier transform and Vernier spectroscopy using an optical frequency comb at 3–5.4 μm. Opt. Lett. 41: 2541.
- 46 Maslowski, P., Lee, K.F., Johansson, A.C., Khodabakhsh, A., Kowzan, G., Rutkowski, L., Mills, A.A., Mohr, C., Jiang, J., Fermann, M.E., and Foltynowicz, A. (2016). Surpassing the path‐limited resolution of Fourier‐transform spectrometry with frequency combs. Phys. Rev. A 93: 021802(R).
- 47 Foltynowicz, A., Maslowski, P., Fleisher, A.J., Bjork, B.J., and Ye, J. (2013). Cavity‐enhanced optical frequency comb spectroscopy in the mid‐infrared application to trace detection of hydrogen peroxide. Appl. Phys. B 110: 163.
- 48 Keilmann, F., Gohle, C., and Holzwarth, R. (2004). Time‐domain mid‐infrared frequency‐comb spectrometer. Opt. Lett. 29: 1542.
- 49 Schliesser, A., Brehm, M., Keilmann, F., and van der Weide, D.W. (2005). Frequency‐comb infrared spectrometer for rapid, remote chemical sensing. Opt. Express 13: 9029.
- 50 Coddington, I., Newbury, N., and Swann, W. (2016). Dual‐comb spectroscopy. Optica 3: 414.
- 51 Changala, P.B., Weichman, M.L., Lee, K.F., Fermann, M.E., and Ye, J. (2019). Rovibrational quantum state resolution of the C60 fullerene. Science 363: 49.
- 52 Coddington, I., Swann, W.C., and Newbury, N.R. (2008). Coherent multiheterodyne spectroscopy using stabilized optical frequency combs. Phys. Rev. Lett. 100: 013902.
- 53 Coddington, I., Swann, W.C., and Newbury, N.R. (2010). Time‐domain spectroscopy of molecular free‐induction decay in the infrared. Opt. Lett. 35: 1395–1397.
- 54 Zolot, A.M., Giorgetta, F.R., Baumann, E., Nicholson, J.W., Swann, W.C., Coddington, I., and Newbury, N.R. (2012). Direct‐comb molecular spectroscopy with accurate, resolved comb teeth over 43 THz. Opt. Lett. 37: 638.
- 55 Bernhardt, B., Sorokin, E., Jacquet, P., Thon, R., Becker, T., Sorokina, I.T., Picqué, N., and Hänsch, T.W. (2010). Mid‐infrared dual‐comb spectroscopy with 2.4 μm Cr2+:ZnSe femtosecond lasers. Appl. Phys. B 100: 3.
- 56 Zhang, Z., Gardiner, T., and Reid, D.T. (2013). Mid‐infrared dual‐comb spectroscopy with an optical parametric oscillator. Opt. Lett. 38: 3148.
- 57 Cruz, F.C., Maser, D.L., Johnson, T., Ycas, G., Klose, A., Giorgetta, F.R., Coddington, I., and Diddams, S.A. (2015). Mid‐infrared optical frequency combs based on difference frequency generation for molecular spectroscopy. Opt. Express 23: 26814.
- 58 Jin, Y.W., Cristescu, S.M., Harren, F.J.M., and Mandon, J. (2015). Femtosecond optical parametric oscillators toward real‐time dual‐comb spectroscopy. Appl. Phys. B 119: 65.
- 59 Zhu, F., Bicer, A., Askar, R., Bounds, J., Kolomenskii, A., Kelessides, V., Amani, M., and Schuessler, H. (2015). Mid‐infrared dual frequency comb spectroscopy based on fiber lasers for the detection of methane in ambient air. Laser Phys. Lett. 12: 095701.
- 60 Kara, O., Zhang, Z., Gardiner, T., and Reid, D.T. (2017). Dual‐comb mid‐infrared spectroscopy with free‐running oscillators and absolute optical calibration from a radio‐frequency reference. Opt. Express 25: 16072.
- 61 Kara, O., Maidment, L., Gardiner, T., Schunemann, P.G., and Reid, D.T. (2017). Dual‐comb spectroscopy in the spectral fingerprint region using OPGaP optical parametric oscillators. Opt. Express 25: 32713.
- 62 Baumann, E., Giorgetta, F.R., Swann, W.C., Zolot, A.M., Coddington, I., and Newbury, N.R. (2011). Spectroscopy of the methane ν3 band with an accurate midinfrared coherent dual‐comb spectrometer. Phys. Rev. A 84: 062513.
- 63 Villares, G., Hugi, A., Blaser, S., and Faist, J. (2014). Dual‐comb spectroscopy based on quantum‐cascade‐laser frequency combs. Nat. Commun. 5: 5192.
- 64 Maser, D.L., Ycas, G., Depetri, W.I., Cruz, F.C., and Diddams, S.A. (2017). Coherent frequency combs for spectroscopy across the 3–5 μm region. Appl. Phys. B 123: 142.
- 65 Muraviev, A., Smolski, V.O., Loparo, Z., and Vodopyanov, K.L. (2018). Massively parallel sensing of trace molecules and their isotopologues with broadband subharmonic mid‐infrared frequency combs. Nat. Photonics 12: 209.
- 66 Vainio, M. and Halonen, L. (2016). Mid‐infrared optical parametric oscillators and frequency combs for molecular spectroscopy. Phys. Chem. Chem. Phys. 18: 4266.
- 67 Cossel, K.C., Waxman, E.M., Finneran, I.A., Blake, G.A., Ye, J., and Newbury, N.R. (2017). Gas‐phase broadband spectroscopy using active sources: progress, status, and applications. J. Opt. Soc. Am. B 34: 104.
- 68 Stothard, D.J.M., Dunn, M.H., and Rae, C.F. (2004). Hyperspectral imaging of gases with a continuous‐wave pump‐enhanced optical parametric oscillator. Opt. Express 12: 947.
- 69 Dam, J.S., Tidemand‐Lichtenberg, P., and Pedersen, C. (2012). Room‐temperature mid‐infrared single‐photon spectral imaging. Nat. Photoics 6: 788.
- 70 National Institute of Health Report: Health Devices 24(3), 92–122 (1995). https://www.ncbi.nlm.nih.gov/pubmed/7782226?report=abstract, accessed 21 September 2017
- 71 Fried, N.M. and Murray, K.E. (2005). High‐power thulium fiber laser ablation of urinary tissues at 1.94 μm. J. Endourol. 19: 25.
- 72 Walsh, J.T. Jr., Flotte, T.J., and Deutsch, T.F. (1989). Er:YAG laser ablation of tissue: effect of pulse duration and tissue type on thermal damage. Lasers Surg. Med. 9: 314.
- 73 Vogel, A. and Venugopalan, V. (2003). Mechanisms of pulsed laser ablation of biological tissues. Chem. Rev. 103: 577.
- 74 Kaufmann, R. and Hibst, R. (1996). Pulsed erbium:YAG laser ablation in cutaneous surgery. Lasers Surg. Med. 19: 324.
- 75 Franjic, K., Cowan, M.L., Kraemer, D., and Miller, R.J.D. (2009). Laser selective cutting of biological tissues by impulsive heat deposition through ultrafast vibrational excitations. Opt. Express 17: 22937.
- 76 Pierce, M.C., Jackson, S.D., Dickinson, M.R., King, T.A., and Sloan, P. (2000). Laser‐tissue interaction with a continuous wave 3‐μm fibre laser: preliminary studies with soft tissue. Lasers Surg. Med. 26: 491.
- 77 Venugopalan, V., Nishioka, N.S., and Mikic, B.B. (1996). Thermodynamic response of soft biological tissues to pulsed infrared‐laser irradiation. Biophys. J. 71: 3530.
- 78 Edwards, G., Logan, R., Copeland, M., Reinisch, L., Davidson, J., Johnson, B., Maciunas, R., Mendenhall, M., Ossoff, R., Tribble, J., Werkhaven, J., and O’Day, D. (1994). Tissue ablation by a free‐electron laser tuned to the amide II band. Nature 371: 416.
- 79 Peavy, G.M., Reinisch, L., Payne, J.T., and Venugopalan, V. (1999). Comparison of cortical bone ablations by using infrared laser wavelengths 2.9 to 9.2 μm. Lasers Surg. Med. 26: 421.
- 80 Edwards, G.S. (2009). Mechanisms for soft‐tissue ablation and the development of alternative medical lasers based on investigations with mid‐infrared free‐electron lasers. Laser Photon. Rev. 3: 545.
- 81 Mackanos, M.A., Simanovskii, D.M., Contag, C.H., Kozub, J.A., and Jansen, E.D. (2012). Comparing an optical parametric oscillator (OPO) as a viable alternative for mid‐infrared tissue ablation with a free electron laser (FEL). Lasers Med. Sci. 27: 1213.
- 82 Edwards, G.S., Pearlstein, R.D., Copeland, M.L., Hutson, M.S., Latone, K., Spiro, A., and Pasmanik, G. (2007). 6450 nm wavelength tissue ablation using a nanosecond laser based on difference frequency mixing and stimulated Raman scattering. Opt. Lett. 32: 1426.
- 83 Kozub, J., Ivanov, B., Jayasinghe, A., Prasad, R., Shen, J., Klosner, M., Heller, D., Mendenhall, M., Piston, D.W., Joos, K., and Hutson, M.S. (2011). Raman‐shifted alexandrite laser for soft tissue ablation in the 6‐ to 7‐μm wavelength range. Biomed. Opt. Express 2: 1275.
- 84 Phillips, M. (1992). Breath tests in medicine. Sci. Am. 267: 74.
- 85 Miekisch, W., Schubert, J.K., and Noeldge‐Schomburg, G.F.E. (2004). Diagnostic potential of breath analysis‐‐focus on volatile organic compounds. Clin. Chim. Acta 347: 25.
- 86 Risby, T.H. and Solga, S.F. (2006). Current status of clinical breath analysis. Appl. Phys. B 85: 421.
- 87 Wang, C. and Sahay, P. (2009). Breath analysis using laser spectroscopic techniques: breath biomarkers, spectral fingerprints, and detection limits. Sensors 9: 8230.
- 88 Schwarz, K., Pizzini, A., Arendacká, B., Zerlauth, K., Filipiak, W., Schmid, A., Dzien, A., Neuner, S., Lechleitner, M., Scholl‐Bu¨rgi, S., Miekisch, W., Schubert, J., Unterkofler, K., Witkovsky&c.acute;, V., Gastl, G., and Amann, A. (2009). Breath acetone—aspects of normal physiology related to age and gender as determined in a PTR‐MS study. J. Breath Res. 3: 027003.
- 89 Shorter, J.H., Nelson, D.D., McManus, J.B., Zahniser, M.S., Sama, S., and Milton, D.K. (2011). Clinical study of multiple breath biomarkers of asthma and COPD (NO, CO2, CO and N2O by infrared laser spectroscopy). J. Breath Res. 5: 037108.
- 90 Cikach, F.S. Jr. and Dweik, R.A. (2012). Cardiovascular biomarkers in exhaled breath. Prog. Cardiovasc. Dis. 55: 34.
- 91 de Lacy Costello, B.P.J., Ledochowski, M., and Ratcliffe, N.M. (2013). The importance of methane breath testing: a review. J. Breath Res. 7: 024001.
- 92 Mochalski, P., King, J., Klieber, M., Unterkofler, K., Hinterhuber, H., Baumann, M., and Amann, A. (2013). Blood and breath levels of selected volatile organic compounds in healthy volunteers. Analyst 138: 2134.
- 93 Kim, S., Young, C., Vidakovic, B., Gabram‐Mendola, S.G.A., Bayer, C.W., and Mizaikoff, B. (2010). Potential and challenges for mid‐infrared sensors in breath diagnostics. IEEE Sensors J. 10: 145.
- 94 Dahnke, H., Kleine, D., Hering, P., and Mürtz, M. (2001). Real‐time monitoring of ethane in human breath using mid‐infrared cavity leak‐out spectroscopy. Appl. Phys. B 72: 971.
- 95 von Basum, G., Dahnke, H., Halmer, D., Hering, P., and Mürtz, M. (2003). Online recording of ethane traces in human breath via infrared laser spectroscopy. J. Appl. Physiol. 95: 2583.
- 96 Halmer, D., Thelen, S., Hering, P., and Mürtz, M. (2006). Online monitoring of ethane traces in exhaled breath with a difference frequency generation spectrometer. Appl. Phys. B. 85: 437.
- 97 Skeldon, K.D., McMillan, L.C., Wyse, C.A., Monk, S.D., Gibson, G., Patterson, C., France, T., Longbottom, C., and Padgett, M.J. (2006). Application of laser spectroscopy for measurement of exhaled ethane in patients with lung cancer. Respir. Med. 100: 300.
- 98 McCurdy, M.R., Bakhirkin, Y., Wysocki, G., Lewicki, R., and Tittel, F.K. (2007). Recent advances of laser spectroscopy‐ based techniques for applications in breath analysis. J. Breath Res. 1: 014001.
- 99 Risby, T.H. and Tittel, F.K. (2010). Current status of midinfrared quantum and interband cascade lasers for clinical breath analysis. Opt. Eng. 49: 111123.
- 100 Parameswaran, K.R., Rosen, D.I., Allen, M.G., Ganz, A.M., and Risby, T.H. (2009). Off‐axis integrated cavity output spectroscopy with a mid‐infrared interband cascade laser for real‐time breath ethane measurements. Appl. Opt. 48: B73.
- 101 McCurdy, M., Bakhirkin, Y.A., and Tittel, F.K. (2006). Quantum cascade laser‐based integrated cavity output spectroscopy of exhaled nitric oxide. Appl. Phys. B 85: 445.
- 102 Bakhirkin, Y.A., Kosterev, A.A., Curl, R.F., Tittel, F.K., Yarekha, D.A., Hvozdara, L., Giovannini, M., and Faist, J. (2006). Sub‐ppbv nitric oxide concentration measurements using CW room‐temperature quantum cascade laser based integrated cavity spectroscopy. Appl. Phys. B 82: 149.
- 103 McCurdy, M.R., Bakhirkin, Y., Wysocki, G., and Tittel, F.K. (2007). Performance of an exhaled nitric oxide and carbon dioxide sensor using quantum cascade laser based integrated cavity output spectroscopy. J. Biomed. Opt. 12: 34034.
- 104 Moeskops, B.W., Cristescu, S.M., and Harren, F.J. (2006). Sub‐part‐per‐billion monitoring of nitric oxide by use of wavelength modulation spectroscopy in combination with a thermoelectrically cooled, continuous‐wave quantum cascade laser. Opt. Lett. 31: 823.
- 105 Halmer, D., von Basum, G., Horstjann, M., Hering, P., and Muertz, M. (2005). Time resolved simultaneous detection of 14NO and 15NO via mid‐IR cavity leak‐out spectroscopy. Isot. Environ. Health Stud. 41: 303.
- 106 Manne, J., Sukhorukov, O., Jager, W., and Tulip, J. (2006). Pulsed quantum cascade laser‐based cavity ring‐down spectroscopy for ammonia detection in breath. Appl. Opt. 45: 9230.
- 107 Moeskops, B., Naus, H., Cristescu, S., and Harren, F. (2006). Quantum cascade laser‐based carbon monoxide detection on a second time scale from human breath. Appl. Phys. B 82: 649.
- 108 Roller, C., Kosterev, A.A., Tittel, F.K., Uehara, K., Gmachl, C., and Sivco, D.L. (2003). Carbonyl sulfide detection with a thermoelectrically cooled mid‐infrared quantum cascade laser. Opt. Lett. 28: 2052.
- 109 Shorter, J.H., Nelson, D.D., McManus, J.B., Zahniser, M.S., and Milton, D.K. (2010). Multicomponent breath analysis with infrared absorption using room‐temperature quantum cascade lasers. IEEE Sensors J. 10: 76.
- 110 Thorpe, M.J., Balslev‐Clausen, D., Kirchner, M.S., and Ye, J. (2008). Cavity enhanced optical frequency comb spectroscopy: application to human breath analysis. Opt. Express 16: 2387.
- 111 Khodabakhsh, A., Rutkowski, L., Morville, J., and Foltynowicz, A. (2017). Mid‐infrared continuous‐filtering Vernier spectroscopy using a doubly resonant optical parametric oscillator. Appl. Phys. B 123: 120.
- 112 Jin, Y.W., Cristescu, S.M., Harren, F.J.M., and Mandon, J. (2014). Two‐crystal mid‐infrared optical parametric oscillator for absorption and dispersion dual‐comb spectroscopy. Opt. Lett. 39: 3270.
- 113 Timmers, H., Kowligy, A., Lind, A., Cruz, F.C., Nader, N., Silfies, M., Ycas, G., Allison, T.K., Schunemann, P.G., Papp, S.B., and Diddams, S.A. (2018). Molecular fingerprinting with bright, broadband infrared frequency combs. Optica 5: 727.
- 114 Ycas, G., Giorgetta, F.R., Baumann, E., Coddington, I., Herman, D., Diddams, S.A., and Newbury, N.R. (2018). High‐coherence mid‐infrared dual‐comb spectroscopy spanning 2.6 to 5.2 μm. Nat. Photonics 12: 202.
- 115 Henderson, B., Khodabakhsh, A., Metsälä, M., Ventrillard, I., Schmidt, F.M., Romanini, D., Ritchie, G.A.D., Hekkert, S.t.L., Briot, R., Risby, T., Marczin, N., Harren, F.J.M., and Cristescu, S.M. (2018). Laser spectroscopy for breath analysis: towards clinical implementation. Appl. Phys. B 124 (161).
- 116 Knoll, B. and Keilmann, F. (1999). Near‐field probing of vibrational absorption for chemical microscopy. Nature 399: 134.
- 117 Keilmann, F. and Hillenbrand, R. (2004). Near‐field microscopy by elastic light scattering from a tip. Philos. Trans. R. Soc. Lon. A 362: 787.
- 118 Taubner, T., Hillenbrand, R., and Keilmann, F. (2004). Nanoscale polymer recognition by spectral signature in scattering infrared near‐field microscopy. Appl. Phys. Lett. 85: 22.
- 119 Taubner, T., Keilmann, F., and Hillenbrand, R. (2005). Nanoscale‐resolved subsurface imaging by scattering‐type near‐field optical microscopy. Opt. Express 13: 8893.
- 120 Dazzi, A., Prazeres, R., Glotin, F., and Ortega, J.M. (2005). Local infrared microspectroscopy with subwavelength spatial resolution with an atomic force microscope tip used as a photothermal sensor. Opt. Lett. 30: 2388.
- 121 Dazzi, A., Prazeres, R., Glotin, F., and Ortega, J.M. (2007). Analysis of nano‐chemical mapping performed by an AFM‐based (AFMIR) acousto‐optic technique. Ultramicroscopy 107: 1194.
- 122 Dazzi, A., Prazeres, R., Glotin, F., Ortega, J.‐M., Alsawaftah, M., and De Frutos, M. (2008). Chemical mapping of the distribution of viruses into infected bacteria with a photothermal method. Ultramicroscopy 108: 635.
- 123 Dazzi, A., Prater, C.B., Hu, Q., Chase, D.B., Rabolt, J.F., and Marcott, C. (2012). AFM–IR: combining atomic force microscopy and infrared spectroscopy for nanoscale chemical characterization. Appl. Spectrosc. 66: 1365.
- 124 Prater, C., Kjoller, K., Cook, D., Shetty, R., Meyers, G., Reinhardt, C., Felts, J., King, W., Vodopyanov, K.L., and Dazzi, A. (2010). Nanoscale infrared spectroscopy of materials by atomic force microscopy. Microsc. Anal. 24: 5.
- 125 Lu, F. and Belkin, M.A. (2011). Infrared absorption nano‐spectroscopy using sample photoexpansion induced by tunable quantum cascade lasers. Opt. Express 19: 19942.
- 126 Stanley, R. (2012). Plasmonics in the mid‐infrared. Nat. Photonics 6: 409–411.
- 127 Yu, N., Wang, Q., and Capasso, F. (2012). Beam engineering of quantum cascade lasers. Laser Photon. Rev. 6: 1.
- 128 Adato, R., Yanik, A.A., and Altug, H. (2011). On chip plasmonic monopole nano‐antennas and circuits. Nano Lett. 11: 5219.
- 129 Chen, K., Adato, R., and Altug, H. (2012). Dual‐band perfect absorber for multispectral plasmon‐enhanced infrared spectroscopy. ACS Nano 6: 7998.
- 130 Popmintchev, T., Chen, M.‐C., Arpin, P., Murnane, M.M., and Kapteyn, H.C. (2010). The attosecond nonlinear optics of bright coherent X‐ray generation. Nat. Photonics 4: 822.
- 131 Popmintchev, T., Chen, M.‐C., Popmintchev, D., Arpin, P., Brown, S., Ališauskas, S., Andriukaitis, G., Balčiunas, T., Mu¨cke, O.D., Pugzlys, A., Baltuška, A., Shim, B., Schrauth, S.E., Gaeta, A., Hernández‐García, C., Plaja, L., Becker, A., Jaron‐Becker, A., Murnane, M.M., and Kapteyn, H.C. (2012). Bright coherent ultrahigh harmonics in the keV X‐ray regime from mid‐infrared femtosecond lasers. Science 336: 1287.
- 132 Weisshaupt, J., Juvé, V., Holtz, M., Ku, S., Woerner, M., Elsaesser, T., Ališauskas, S., Pugžlys, A., and Baltuška, A. (2014). High‐brightness table‐top hard X‐ray source driven by sub‐100‐femtosecond mid‐infrared pulses. Nat. Photonics 8: 927.
- 133 Chin, A.H., Calderón, O.G., and Kono, J. (2001). Extreme midinfrared nonlinear optics in semiconductors. Phys. Rev. Lett. 86: 3292.
- 134 Ghimire, S., DiChiara, A.D., Sistrunk, E., Agostini, P., DiMauro, L.F., and Reis, D.A. (2011). Observation of high‐order harmonic generation in a bulk crystal. Nat. Phys. 7: 138.
- 135 Vampa, G., Hammond, T.J., Thiré, N., Schmidt, B.E., Légaré, F., McDonald, C.R., Brabec, T., and Corkum, P.B. (2015). Linking high harmonics from gases and solids. Nature 522: 462.
- 136 Schubert, O., Hohenleutner, M., Langer, F., Urbanek, B., Lange, C., Huttner, U., Golde, D., Meier, T., Kira, M., Koch, S.W., and Huber, R. (2014). Sub‐cycle control of terahertz high‐harmonic generation by dynamical Bloch oscillations. Nat. Photonics 8: 119.
- 137 Langer, F., Schmid, C.P., Schlauderer, S., Gmitra, M., Fabian, J., Nagler, P., Schu¨ller, C., Korn, T., Hawkins, P.G., Steiner, J.T., Huttner, U., Koch, S.W., Kira, M., and Huber, R. (2018). Lightwave valleytronics in a monolayer of tungsten diselenide. Nature 557: 76.
- 138 Tajima, T. and Dawson, J.M. (1979). Laser electron accelerator. Phys. Rev. Lett. 43: 267.
- 139 Mangles, S.P.D., Murphy, C.D., Najmudin, Z., Thomas, A.G.R., Collier, J.L., Dangor, A.E., Divall, E.J., Foster, P.S., Gallacher, J.G., Hooker, C.J., Jaroszynski, D.A., Langley, A.J., Mori, W.B., Norreys, P.A., Tsung, F.S., Viskup, R., Walton, B.R., and Krushelnick, K. (2004). Monoenergetic beams of relativistic electrons from intense laser‐plasma interactions. Nature 431: 535.
- 140 Faure, J., Glinec, Y., Pukhov, A., Kiselev, S., Gordienko, S., Lefebvre, E., Rousseau, J.‐P., Burgy, F., and Malka, V. (2004). A laser–plasma accelerator producing monoenergetic electron beams. Nature 431: 541.
- 141 Pogorelsky, I.V., Polyanskiy, M.N., and Kimura, W.D. (2016). Mid‐infrared lasers for energy frontier plasma accelerators. Phys. Rev. Accel. Beams 19: 091001.
- 142 Peralta, E.A., Soong, K., England, R.J., Colby, E.R., Wu, Z., Montazeri, B., McGuinness, C., McNeur, J., Leedle, K.J., Walz, D., Sozer, E.B., Cowan, B., Schwartz, B., Travish, G., and Byer, R.L. (2013). Demonstration of electron acceleration in a laser‐driven dielectric microstructure. Nature 503: 91.
- 143 Breuer, J. and Hommelhoff, P. (2013). Laser‐based acceleration of nonrelativistic electrons at a dielectric structure. Phys. Rev. Lett. 111: 134803.
- 144 Leedle, K.J., Pease, R.F., Byer, R.L., and Harris, J.S. (2015). Laser acceleration and deflection of 96.3 keV electrons with a silicon dielectric structure. Optica 2: 158.
- 145 Blaser, S., Hofstetter, D., Beck, M., and Faist, J. (2001). Free‐space optical data link using Peltier‐cooled quantum cascade laser. IEEE Electron. Lett. 37: 778.
- 146 Martini, R., Bethea, C., Capasso, F., Gmachl, C., Paiella, R., Whittaker, E.A., Hwang, H.Y., Sivco, D.L., Baillargeon, J.N., and Cho, A.Y. (2002). Free‐space optical transmission of multimedia satellite data streams using mid‐infrared quantum cascade lasers. IEEE Electron. Lett. 38: 181.
- 147 Corrigan, P., Martini, R., Whittaker, E.A., and Bethea, C. (2009). Quantum cascade lasers and the Kruse model in free space optical communication. Opt. Express 17: 4355.
- 148 Bubb, D.M., Horwitz, J.S., McGill, R.A., Chrisey, D.B., Papantonakis, M.R., Haglund, R.F., Jr., and Toftmann, B. (2001). Resonant infrared pulsed‐laser deposition of a sorbent chemoselective polymer. Appl. Phys. Lett. 79: 2847.
- 149 Kolev, V.Z., Duering, M.W., Luther‐Davies, B., and Rode, A.V. (2006). Compact high‐power optical source for resonant infrared pulsed laser ablation and deposition of polymer materials. Opt. Express 14: 12302.