
Max drawdown is also a PnL metric, but this measures the maximum loss that a strategy can take over a series of days. This is defined as the peak to trough decline in a trading strategy's account value. This is important as a risk measure so that we can get an idea of what the historical maximum decline in the account value can be. This is important because we can get unlucky during the deployment of a trading strategy and run it in live markets right at the beginning of the drawdown.
Having an expectation of what the maximum drawdown is can help us understand whether the strategy loss streak is still within our expectations or whether something unprecedented is happening. Let's look at how to compute it:
max_pnl = 0
max_drawdown = 0
drawdown_max_pnl = 0
drawdown_min_pnl = 0

for i in range(0, num_days):
  max_pnl = max(max_pnl, pnl[i])
  drawdown = max_pnl - pnl[i]

  if drawdown > max_drawdown:
    max_drawdown = drawdown
    drawdown_max_pnl = max_pnl
    drawdown_min_pnl = pnl[i]

print('Max Drawdown:', max_drawdown)

results['PnL'].plot(x='Date', legend=True)
plt.axhline(y=drawdown_max_pnl, color='g')
plt.axhline(y=drawdown_min_pnl, color='r')
plt.show()
The code will return the following output:
Max Drawdown: 15340.41716347829
The plots that follow are a result of the preceding code. Let's have a look:

In the plot, the max drawdown occurs roughly during the middle of this PnL series, with the maximum PnL being 37K and the minimum PnL after that high being 22K, causing the maximum drawdown achieved to be roughly 15K:
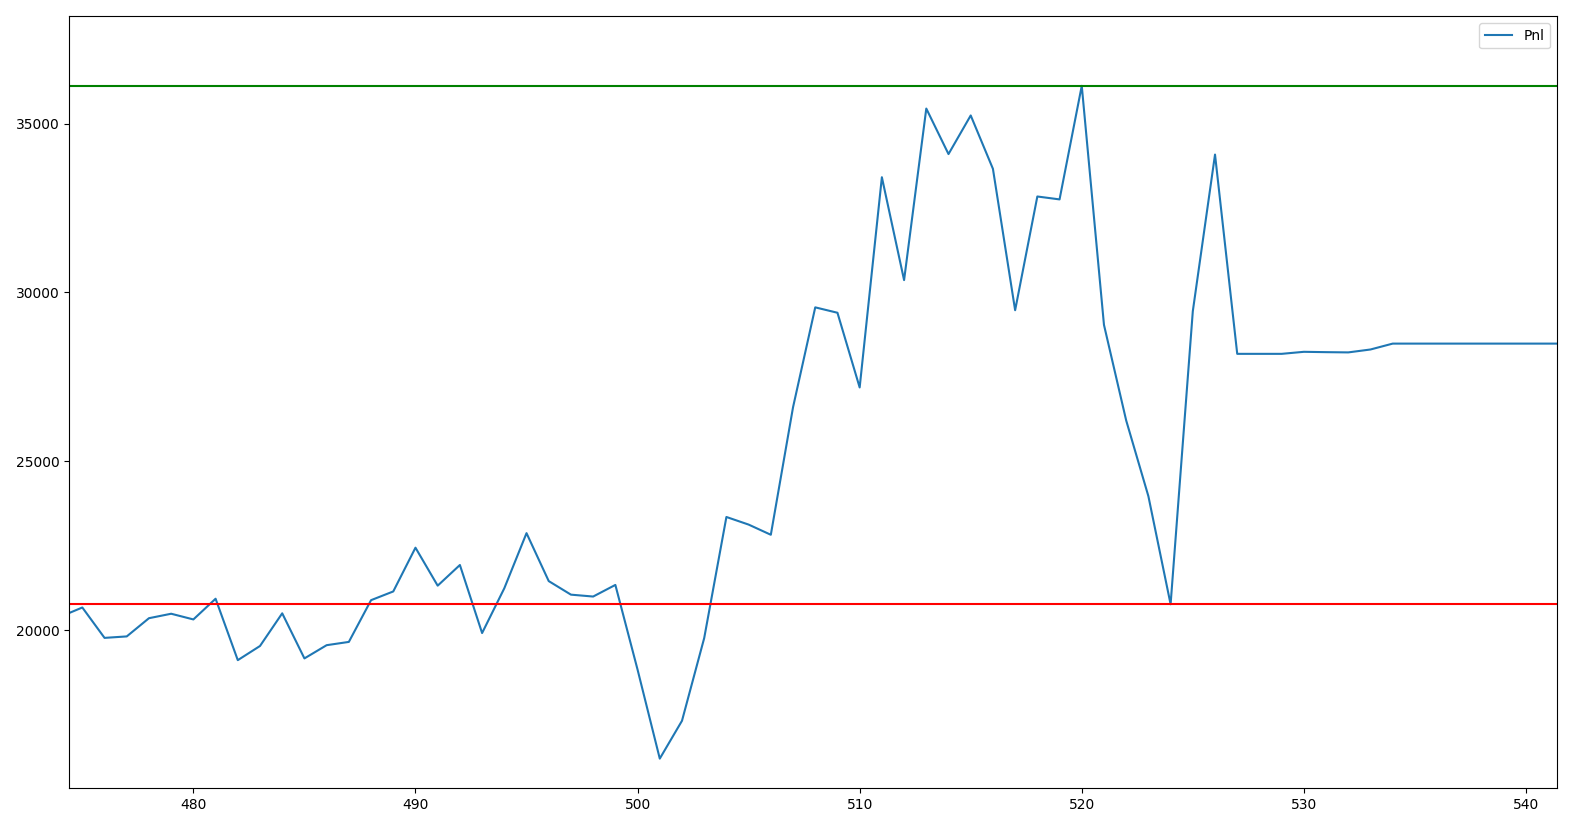
The plot is simply the same plot as before but zoomed in to the exact observations where the drawdown occurs. As we mentioned previously, after achieving a high of roughly 37K, PnLs have a large drawdown of 15K and drop down to roughly 22K, before rebounding.