
While analyzing positions that a trading strategy gets into, it is also important to measure how long a position stays open until it is closed and returned to its flat position or opposition position. The longer a position stays open, the more risk it is taking on, because the more time there is for markets to make massive moves that can potentially go against the open position. A long position is initiated when the position goes from being short or flat to being long and is closed when the position goes back to flat or short. Similarly, short positions are initiated when the position goes from being long or flat to being short and is closed when the position goes back to flat or long.
Now, let's find the distribution of open position durations with the help of the following code:
position_holding_times = []
current_pos = 0
current_pos_start = 0
for i in range(0, num_days):
  pos = results['Position'].iloc[i]

  # flat and starting a new position
  if current_pos == 0:
    if pos != 0:
      current_pos = pos
      current_pos_start = i
    continue

  # going from long position to flat or short position or
  # going from short position to flat or long position
  if current_pos * pos <= 0:
    current_pos = pos
    position_holding_times.append(i - current_pos_start)
    current_pos_start = i

print(position_holding_times)
plt.hist(position_holding_times, 100)
plt.gca().set(title='Position Holding Time Distribution', xlabel='Holding time days', ylabel='Frequency')
plt.show()
The preceding code will return the following output. Let's have a look at the position holding time distribution plot:
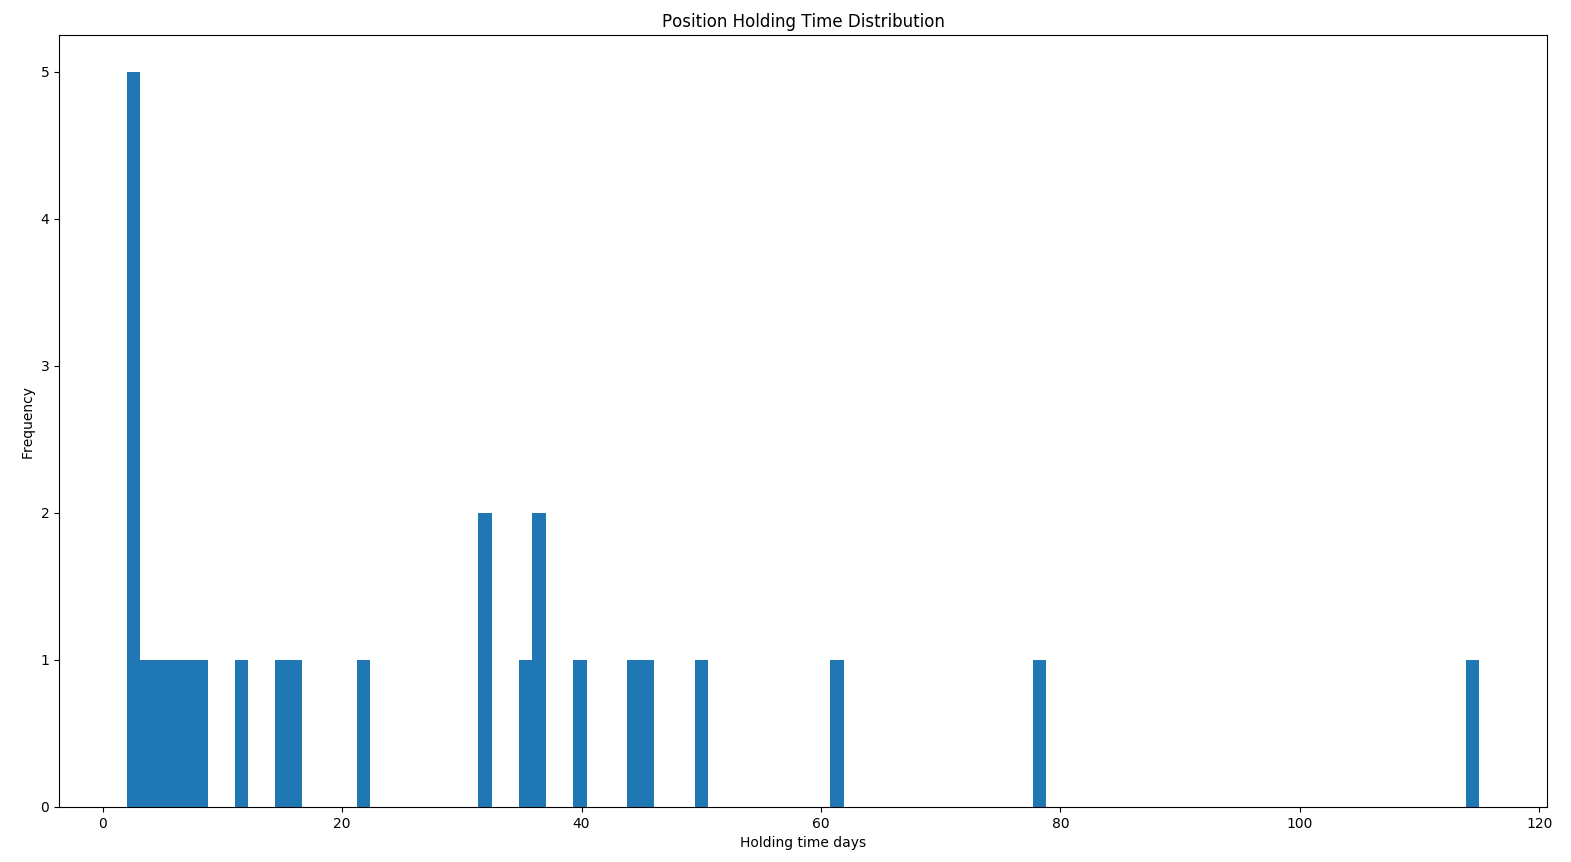
So, for this strategy, we can see that the holding time is pretty distributed, with the longest one lasting around 115 days and the shortest one lasting around 3 days.