
This risk measure is an interval-based risk check. An interval-based risk is a counter that resets after a fixed amount of time and the risk check is imposed within such a time slice. So, while there is no final limit, it's important that the limit isn't exceeded within the time interval that is meant to detect and avoid over-trading. The interval-based risk measure we will inspect is maximum executions per period. This measures the maximum number of trades allowed in a given timeframe. Then, at the end of the timeframe, the counter is reset and starts over. This would detect and prevent a runaway strategy that buys and sells at a very fast pace.
Let's look at the distribution of executions per period for our strategy using a week as our timeframe, as shown here:
executions_this_week = 0
executions_per_week = []
last_week = 0
for i in range(0, num_days):
  if results['Trades'].iloc[i] != 0:
    executions_this_week += 1

  if i - last_week >= 5:
    executions_per_week.append(executions_this_week)
    executions_this_week = 0
    last_week = i

plt.hist(executions_per_week, 10)
plt.gca().set(title='Weekly number of executions Distribution', xlabel='Number of executions', ylabel='Frequency')
plt.show()
The code will return the following output. Let's have a look at the plot:
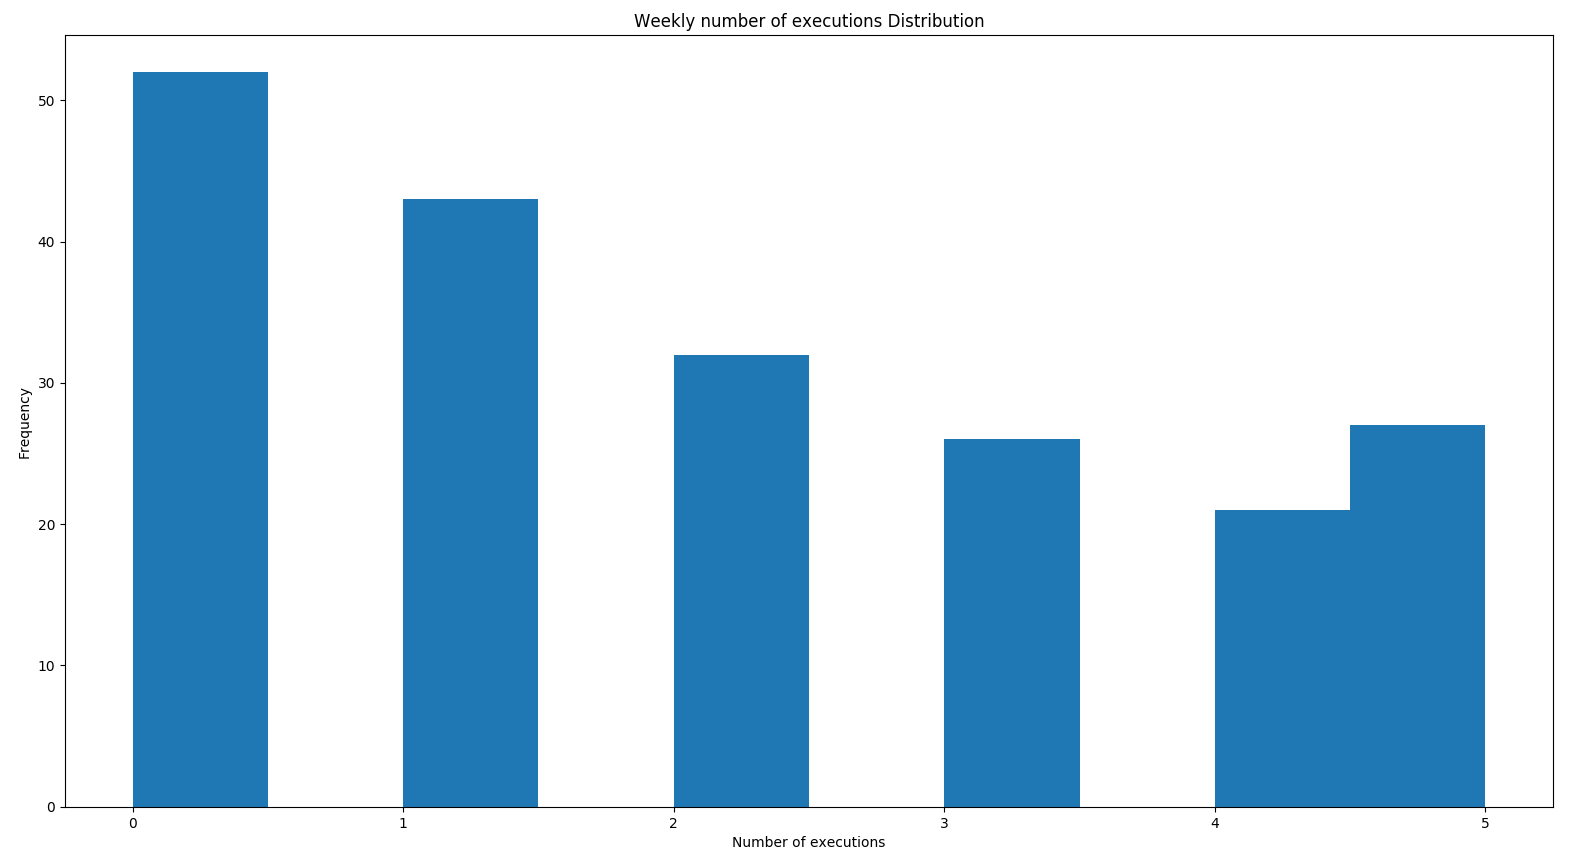
As we can see, for this trading strategy, it's never traded more than five times a week in the past, which is when it trades every day of the week, which doesn't help us much. Now, let's look at the maximum executions per month:
executions_this_month = 0
executions_per_month = []
last_month = 0
for i in range(0, num_days):
  if results['Trades'].iloc[i] != 0:
    executions_this_month += 1

  if i - last_month >= 20:
    executions_per_month.append(executions_this_month)
    executions_this_month = 0
    last_month = i

plt.hist(executions_per_month, 20)
plt.gca().set(title='Monthly number of executions Distribution', xlabel='Number of executions', ylabel='Frequency')
plt.show()
The preceding code will return the following output. Let's have a look at the plot:

We can observe the following from the preceding plot:
- It is possible for the strategy to trade every day in a month, so this risk measure can't really be used for this strategy.
- However, this is still an important risk measure to understand and calibrate, especially for algorithmic trading strategies that trade frequently, and especially for HFT strategies.