
As mentioned, garbage collection (GC) is the engine that cleans up the memory of managed heap within the CLR with an internal algorithm and its own triggering engine. Although it is impossible to know exactly when the GC will fire, its algorithm is detailed in many articles on MSDN and relative blogs and also has known trigger points, for instance, when CLR needs lots of new memory. The GC memory cleanup operation is named collect.
Microsoft gives us the ability to trigger the collector manually, by invoking the GC.Collect method. Although this option is available, manually triggering the GC is something to avoid because every usage will interfere with CLR abstraction of the underlying system.
The GC collection occurs multiple times until the process is alive and running. Its execution has the goal of freeing the memory from objects that are not in use anymore by any code block, or that are not referred by any other living object.
Any surviving object is then marked as a survivor object. This marking phase is crucial in the GC logic. Each survival will increment the survival counter for such an object. The first time an object is analyzed by the GC is in generation zero of its mark counter. Multiple survivals will bring this counter to generation-1 or generation-2. In CLR, the most unchanging objects (survived through all GCs) are marked in generation-2.
Garbage collection always starts by pausing all threads of the application, and then the managed heap is scanned to find unused objects and can service them. Following is a graphical representation of such behavior:
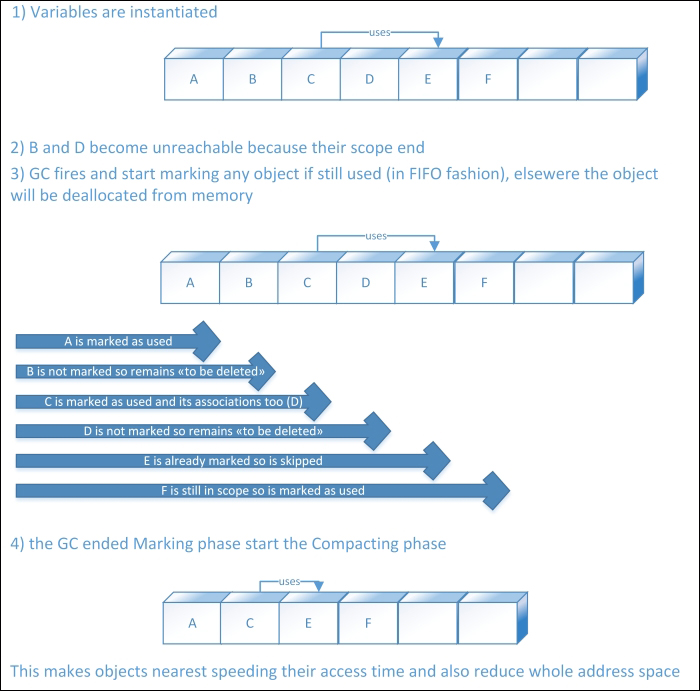
The garbage collection algorithm
Always bear in mind that the variables seen in the preceding diagram are objects that can contain any number of variables, their self-like basic types, and links to other objects, such as the C item that is associated with the E item.
As mentioned, the GC can trigger its job any time that the application needs to instantiate new objects. This occurs because once started, the CLR defines a threshold in bytes, that is, new object breaks to trigger the GC algorithm. Newly-created objects are referred in the GC as gen-0 (generation-0) objects; they are never analyzed for marking. GC has a generational algorithm that focuses on newly-created objects because they are thought to be the most likely to exit the scope; instead, the objects first created when an application starts are thought to be the most enduring ones. Once an object passes the marking phase, it may be promoted to gen-1; thus, it becomes a long-living object. Any generation has its size limit, as defined by the CLR, so it may also happen that the GC analyzes all objects from gen-0 and gen-1. Usually, the GC only collects the generation that exceeds its size limit.
The choice of what generation to collect is ordered from the newer (gen-0) generation up to the older (gen-2) generation. Because of this, it may happen that if a generation always exceeds its limit, the following generations can never be collected, wasting some memory. Obviously, a manual collection trigger will start the collection of all generations. Although this may seem to be an issue, this algorithm is the result of an intensive study that proves this is generally the most efficient way to clean up memory usage.
Once an object survives two collections from gen-0, GC promotes it to gen-1. Once a gen-1 object survives four collections, it is promoted to gen-2. Gen-2 is the less-changing generation; it is also the less-collected one.
Here is a graphical representation of objects within the virtual address space of the managed heap showing different generations. Bear in mind that, as stated previously, physical fragmentation may occur, although virtual memory seems to be a straight collection of objects.
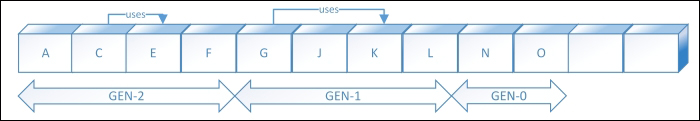
The managed heap with all available generations
When a process starts, the GC logic within the CLR assigns a size limit for each generation. During runtime of a process, the GC increments or decrements the generation size according to the execution of the application. This means that the GC somehow has a self-learning algorithm that tunes itself, based on how many objects it de-allocates or does not de-allocate.
Exceeding of the allocation threshold is not the only trigger for the GC to start collecting dead objects; it may also run when Windows signals low physical memory, when an AppDomain class exits (including the main one), or when the code fires GC.Collect() method.
CLR divides objects in two sizes: small (less than 85,000 bytes) and large (equal to or greater than 85,000 bytes). All large objects are allocated in a specific heap, the large object heap (LOH). The managed heap is valid for each heap, although the LOH has some limitations because of the size of objects contained within.
With the small object heap, the GC can avoid memory corruption, memory fragmentation, and memory leak because any object is only stored once. It's still possible to create thousands of non-useful items, but this is a behavior of the programmer that CLR cannot avoid. Instead of talking about LOH, the GC will avoid the compacting phase, reducing the thread suspend-time and avoiding costly CPU-intensive work, such as moving large objects in memory. This choice boosts the collection latency (time to finish) but obviously does not help memory consumption by never releasing the unused space between adjacent objects. Instead, the unused space at extremes is always released.
Another great limitation to dealing with using LOH is trying to reduce the collection time. All objects within LOH are marked as gen-2. This means that CLR expects that objects always live long. This causes a great impact on application performance if their real usage is short-lived because the great size will easily exceed the gen-2 size limit, starting the collection phase of such an internal, and usually never-changing, heap area.
By invoking the GC.Collect method (or when the CLR responds to the Windows low-memory event), it is possible to force start the collection algorithm of any generation. Although this may happen (I always suggest never invoking it manually), GC usually works in a triggered fashion, trying to balance the lowest application performance impact with the needed memory cleanup.
Garbage collection is divided into two different algorithms that fulfill different application needs. We can choose which garbage collection type to use within our application only once in the application configuration file (or Web Configuration File), under the runtime node, where we can switch from the workstation collection (default) to the server collection:
  <runtime>
    <gcServer enabled="true" /> <!-- enables Server mode -->
  </runtime>
When the GC works in the workstation mode (default), the CLR tries to balance the overall execution time of the collection with a few resources, by using a single thread at normal priority to analyze and eventually release the unused memory blocks.
When the GC works in server mode (available only for multicore systems), it creates a thread per CPU core and divides the collection work across those threads that will clean up all managed heaps and LOHs related to all application threads executing on the same CPU core.
Using server collection, we can definitely boost memory cleanup throughput by using multiple cores and avoiding a single thread crossing all CPU cores available. The drawback is higher resource usage because of the increased thread count. The server collection should be configured only for applications that are specific to the server side (such as a database or web server), preferring single-application servers.
The LatencyMode property is another configuration available to optimize collection intrusiveness and triggering.
The default collect mode is the interactive (or concurrent) mode. With this mode, the collection marking phase works in a background thread (or multiple threads, if using server collection) and only the memory release and compact works by suspending all application threads. This mode is maybe the most balanced one, trying to have good throughput in memory release without consuming too many resources.
The opposite is the batch mode (or called as the non-concurrent mode). This mode is configurable within the configuration file, as shown earlier. It can be configured by disabling the concurrent mode, as seen in the following code—the configuration is combinable with the request for using server collection:
<runtime>
  <gcConcurrent enabled="false"/> <!-- enables Batch mode -->
</runtime>
The batch mode is the most powerful in terms of throughput of memory release because it simply suspends all application thread execution and releases all unused memory. Obviously, this choice can break application latency because an application request must await the completion of the collection.
Other LatencyMode configurations are available only at runtime by setting the GCSettings.LatencyMode property with a value of the GCLatencyMode enum that contains the batch and interactive values, plus the LowLatency, SustainedLowLatency and NoGCRegion values.
By choosing the LowLatency mode (available only for workstation collection), gen-2 collection is suspended completely, while gen-0 and gen-1 are still collected. This option should be used only for short periods when we need a very low interference of the GC during a critical job; otherwise, an OutOfMemoryException error may occur. When manually triggering the collector with the related GC.Collect method, or when a system is low on memory, a gen-2 collection will occur, although in the LowLatency mode. One of the best benefit when using the LowLatency mode is increase in application responsiveness because of the collection of only small items. The GC itself uses resources minimally, but in the meanwhile, the process can still consume lots of memory because of the inability to collect long-visibility objects from gen-2.
The LowLatency mode is configurable, as shown in the following code:
var previousTiming = GCSettings.LatencyMode;
try
{
    //switch to LowLatency mode
    GCSettings.LatencyMode = GCLatencyMode.LowLatency;

    //your code
    //never use large short-living objects here
}
finally
{
    GCSettings.LatencyMode = previousTiming;
}
The SustainedLowLatency mode is similar to an optimized interactive mode that tries to have more memory retention than the interactive mode actually uses. A complete collection usually occurs only when Windows signals a low-on-memory state. Contrary to the LowLatency mode, which must be used only for a very short duration, the SustainedLowLatency mode can be chosen as an interactive or batch mode without the occurrence of an out-of-memory state. It is obvious that a system with more physical RAM is the best candidate for such a configuration.
Within .NET 4.6 (currently in preview mode), a new mode is available for the extreme purpose of disabling the whole garbage collection process. This mode is named NoGCRegion. This choice gives all computational resources to application code, disabling any GC threads. Obviously, such behavior can easily create an OutOfMemoryException condition, and its usage should occur only for very short time periods in extreme cases.
This enumeration value (GCSettings.LatencyMode) is in read-only. This means that we cannot write the GCSettings.LatencyMode property specifying the NoGCRegion value. Instead, we need to signal such a critical section by invoking a couple of methods, one to enter and one to exit this section. Here's a code example:
try
{
    var neededMemoryAmount = 1000000000;
    //asks GC to stop collecting
    GC.TryStartNoGCRegion(neededMemoryAmount);

    //do your critical stuffs
}
catch (Exception)
{
    //handle the exception
}
finally
{
    //resume previous collect mode
    GC.EndNoGCRegion();
}
Bear in mind that in the .NET history, the GC algorithm has been updated multiple times, and this may occur again in future versions.
To know more about the fundamentals of garbage collection, visit https://msdn.microsoft.com/en-us/library/ee787088(v=vs.110).aspx.