
Fourier transform has several usages in engineering programming. The easiest usage is producing a rolling average value for a dataset by applying a digital filter on the given values as being frequency-domain values.
A low-pass filter is the one that stops high frequency values from passing. In audio engineering, it is used to drive a sub-woofer or any low-frequency speaker. When dealing with any other numerical value, such filters become useful to have an averaged value or to cut away any interference or parasite signal in our values.
The application of a Fast Fourier Transform (FFT) on any numerical value will produce a rolling average result like this:
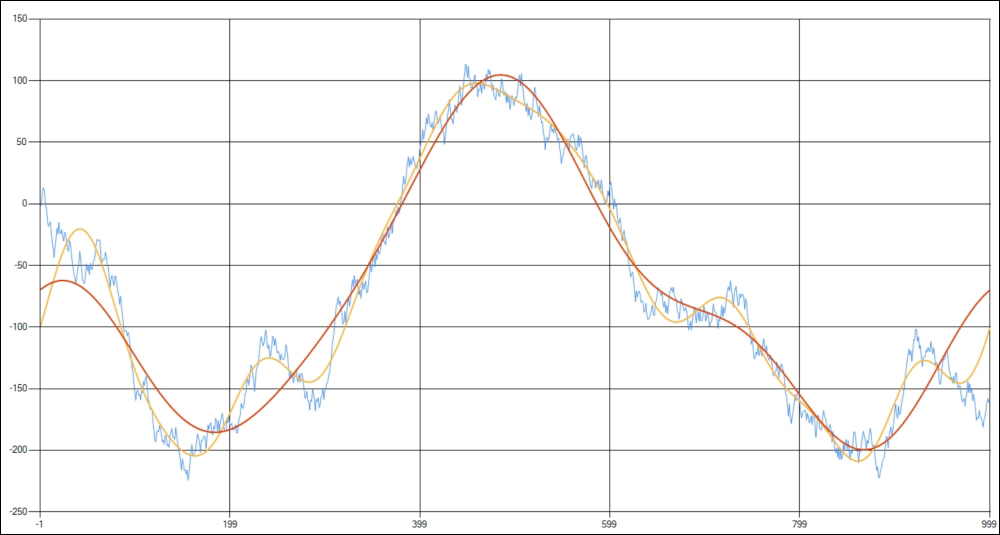
A rolling average with a FFT at 10hz (orange) and 4hz (red) cut frequency
A typical feature of a FFT filter is at the edges, where the filter follows the trend of the whole dataset instead of the local data. In the preceding picture, this error is visible on the right-hand side, where the FFT produces an increasing averaged value while the raw one is going down.
By using the Math.NET Numerics package from NuGet, the following is the code to make a low-pass with FFT:
/// <summary>
/// Makes a low-pass digital filter against any floating point data
/// </summary>
private static IEnumerable<float> LowPass(IEnumerable<float> values, int cutHz)
{
    //convert raw data to Complex frequency domain-data
    var complex = values.Select(x => new Complex(x, 0)).ToArray();

    //start a fast Fourier transform (FFT)
    //this will change raw data in frequency data
    Fourier.Forward(complex);

    //low data is at edges so we clean-up
    //any data at the centre because we want
    //only low data (is a low-pass filter)
    for (int i = 0; i < complex.Count(); i++)
        if (i > cutHz && i < complex.Count() - cutHz)
            complex[i] = new Complex();

    //convert back data to raw floating-point values
    Fourier.Inverse(complex);

    return complex.Select(x => (float)x.Real);
}
The following example shows how to create the preceding chart in Windows Forms. The application starts with an empty Form1 file.
//for data initialization
private void Form1_Load(object sender, EventArgs e)
{
    var r = new Random();
    double d = 0;

    //randomly generated data
    var data = Enumerable.Range(1, 1000)
        .Select(i => (float)(r.Next() % 2 == 0 ? d += (r.NextDouble() * 10d) : d -= (r.NextDouble() * 10d)))
        .ToArray();

    //namespace System.Windows.Forms.DataVisualization.Charting
    var chart1 = new Chart();

    //add the chart to the form
    this.Controls.Add(chart1);
    //shows chart in full screen
    chart1.Dock = DockStyle.Fill;

    //create a default area
    chart1.ChartAreas.Add(new ChartArea());

    //create series
    chart1.Series.Add(new Series
        {
            XValueMember = "Index",
            XValueType = ChartValueType.Auto,
            YValueMembers = "RawValue",
            ChartType = SeriesChartType.Line,
        });
    chart1.Series.Add(new Series
    {
        XValueMember = "Index",
        XValueType = ChartValueType.Auto,
        YValueMembers = "AveragedValue10",
        ChartType = SeriesChartType.Line,
        BorderWidth = 2,
    });
    chart1.Series.Add(new Series
    {
        XValueMember = "Index",
        XValueType = ChartValueType.Auto,
        YValueMembers = "AveragedValue4",
        ChartType = SeriesChartType.Line,
        BorderWidth = 2,
    });

    //apply a digital low-pass filter with different cut-off frequencies
    var lowPassData10hz = LowPass(data, 10).ToArray();
    var lowPassData4hz = LowPass(data, 4).ToArray();

    //do databinding
    chart1.DataSource = Enumerable.Range(0, data.Length).Select(i => new
        {
            Index = i,
            RawValue = data[i],
            AveragedValue10 = lowPassData10hz[i],
            AveragedValue4 = lowPassData4hz[i],
        }).ToArray();
    chart1.DataBind();

    //window in full screen
    WindowState = FormWindowState.Maximized;
}
Low-pass filtering has been available since 2008 in the native .NET code. NAudio is a powerful library helping any CLR programmer to create, manipulate, or analyze audio data in any format.
Available through NuGet Package Manager, NAudio offers a simple and .NET-like programming framework, with specific classes and stream-reader for audio data files.
Let's see how to apply the low-pass digital filter in a real audio uncompressed file in WAVE format. For this test, we will use the Windows start-up default sound file. The chart is still made in a legacy Windows Forms application with an empty Form1 file, as shown in the previous example.
private async void Form1_Load(object sender, EventArgs e)
{
    //stereo wave file channels
    var channels = await Task.Factory.StartNew(() =>
        {
            //the wave stream-like reader
            using (var reader = new WaveFileReader("startup.wav"))
            {
                var leftChannel = new List<float>();
                var rightChannel = new List<float>();

                //let's read all frames as normalized floats
                while (reader.Position < reader.Length)
                {
                    var frame = reader.ReadNextSampleFrame();
                    leftChannel.Add(frame[0]);
                    rightChannel.Add(frame[1]);
                }

                return new
                {
                    Left = leftChannel.ToArray(),
                    Right = rightChannel.ToArray(),
                };
            }
        });

    //make a low-pass digital filter on floating point data
    //at 200hz
    var leftLowpassTask = Task.Factory.StartNew(() => LowPass(channels.Left, 200).ToArray());
    var rightLowpassTask = Task.Factory.StartNew(() => LowPass(channels.Right, 200).ToArray());

    //this let the two tasks work together in task-parallelism
    var leftChannelLP = await leftLowpassTask;
    var rightChannelLP = await rightLowpassTask;

    //create and databind a chart
    var chart1 = CreateChart();

    chart1.DataSource = Enumerable.Range(0, channels.Left.Length).Select(i => new
        {
            Index = i,
            Left = channels.Left[i],
            Right = channels.Right[i],
            LeftLP = leftChannelLP[i],
            RightLP = rightChannelLP[i],
        }).ToArray();

    chart1.DataBind();

    //add the chart to the form
    this.Controls.Add(chart1);
}

private static Chart CreateChart()
{
    //creates a chart
    //namespace System.Windows.Forms.DataVisualization.Charting

    var chart1 = new Chart();

    //shows chart in fullscreen
    chart1.Dock = DockStyle.Fill;

    //create a default area
    chart1.ChartAreas.Add(new ChartArea());

    //left and right channel series
    chart1.Series.Add(new Series
    {
        XValueMember = "Index",
        XValueType = ChartValueType.Auto,
        YValueMembers = "Left",
        ChartType = SeriesChartType.Line,
    });
    chart1.Series.Add(new Series
    {
        XValueMember = "Index",
        XValueType = ChartValueType.Auto,
        YValueMembers = "Right",
        ChartType = SeriesChartType.Line,
    });

    //left and right channel low-pass (bass) series
    chart1.Series.Add(new Series
    {
        XValueMember = "Index",
        XValueType = ChartValueType.Auto,
        YValueMembers = "LeftLP",
        ChartType = SeriesChartType.Line,
        BorderWidth = 2,
    });
    chart1.Series.Add(new Series
    {
        XValueMember = "Index",
        XValueType = ChartValueType.Auto,
        YValueMembers = "RightLP",
        ChartType = SeriesChartType.Line,
        BorderWidth = 2,
    });

    return chart1;
}
Let's see the graphical result:
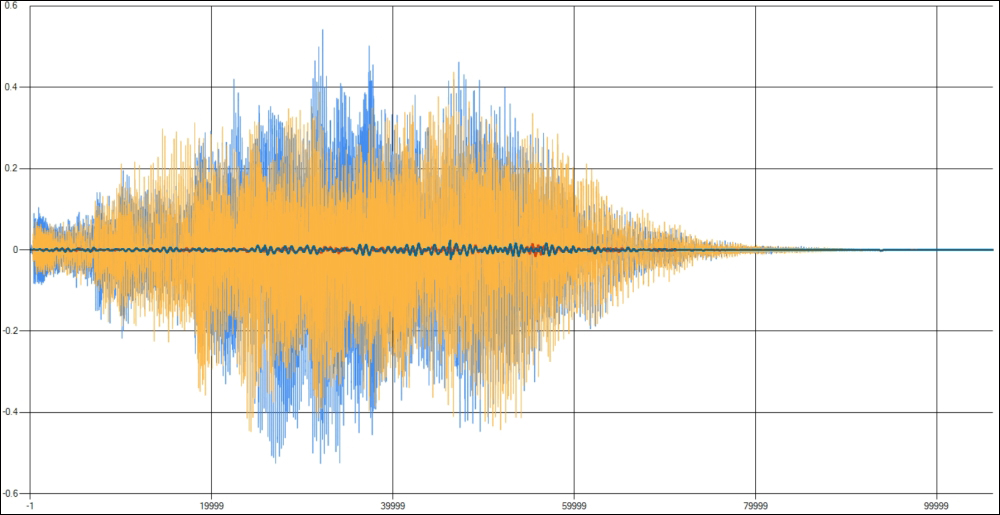
The Windows start-up sound waveform. In bolt, the bass waveform with a low-pass filter at 200hz.
The usage of parallelism in elaborations such as this is mandatory. Audio elaboration is a canonical example of engineering data computation because it works on a huge dataset of floating points values. A simple file, such as the preceding one that contains less than 2 seconds of audio sampled at (only) 22,050 Hz, produces an array greater than 40,000 floating points per channel (stereo = 2 channels).
Just to have an idea of how hard processing audio files is, note that an uncompressed CD quality song of 4 minutes sampled at 44,100 samples per second * 60 (seconds) * 4 (minutes) will create an array greater than 10 million floating-point items per channel.
Because of the FFT intrinsic logic, any low-pass filtering run must run in a single thread. This means that the only optimization we can apply when running FFT based low-pass filtering is parallelizing in a per channel basis. For most cases, this choice can only bring a 2X throughput improvement, regardless of the processor count of the underlying system.