
Visual Studio has a great profiling tool integrated within its usual IDE.
The main menu root is ANALYZE. Here, we find all we need to understand an application's performance details, together with interesting static analysis tools to verify a programmer's skill.
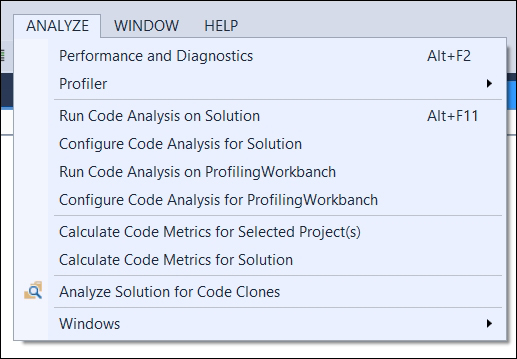
The ANALYZE menu as visible within Visual Studio 2013 update 4
Here's a brief guide to how to start profiling our application:
- Within the menu, click on the Performance and Diagnostics menu item. This link opens the main window to start profiling our applications. Using the performance wizard helps us in selecting the best profiling technique and configuration for our needs. Specific profilers also exist for specific application kinds, such as JavaScript memory usage or GPU power usage.
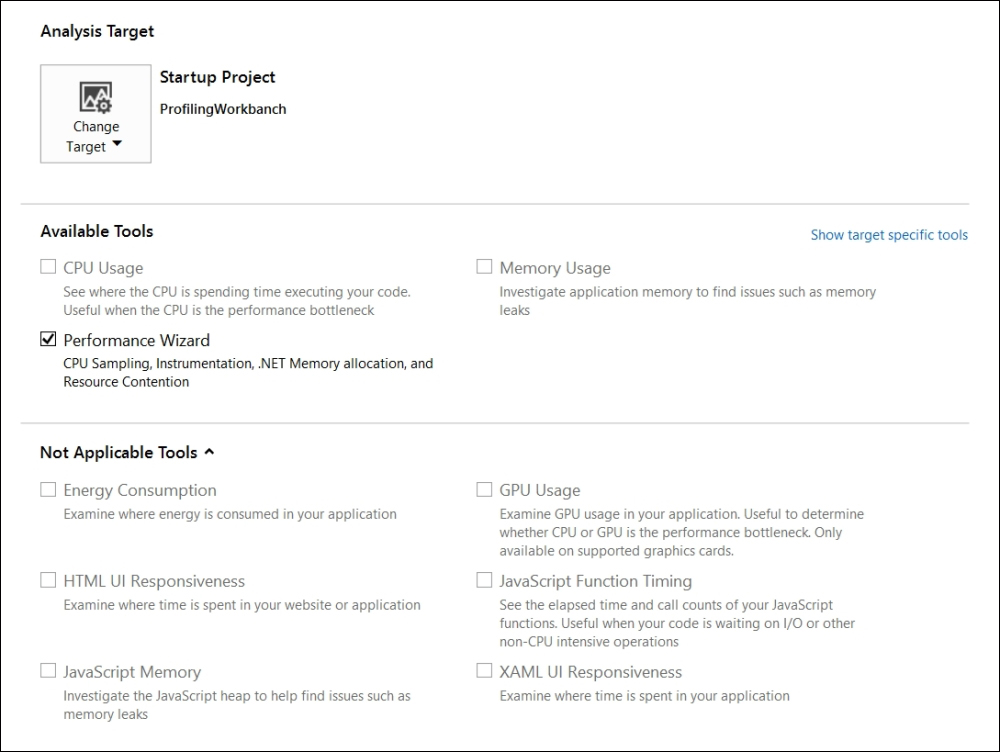
The performance and diagnostics window, ready to start profiling a WPF application
- By pressing the start button at the bottom of the window, we will see the Performance Wizard asking us which profiling technology we want to use. We will leave the default selection that will start CPU sampling. This profiling technique will try to predict the CPU usage or our software, with good results.
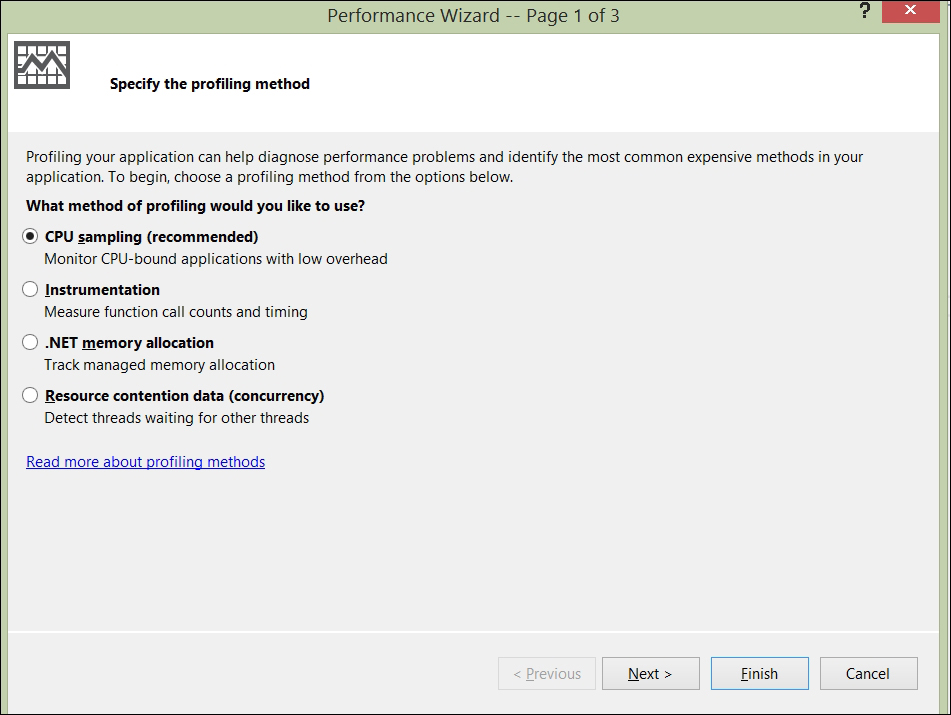
The performance wizard
- Select the profiling method, the executable project to analyze, and if needed, start immediately, or simply save this configuration.
At this point, our application starts, along with the profiling process. We can now do anything in our software, such as the usual operations that give the profiling engine a way to understand our application usage. Obviously, right now the profiling engine is simply recording our steps and application feedback. When we exit our application, the profiling engine will then analyze the recorded data and produce a navigable detailed report.
The result is immediately shown to the developer in a simplified graphical way containing a CPU usage chart, a summary of hot paths, and the most CPU-consuming methods within our application, as shown in the following screenshot:
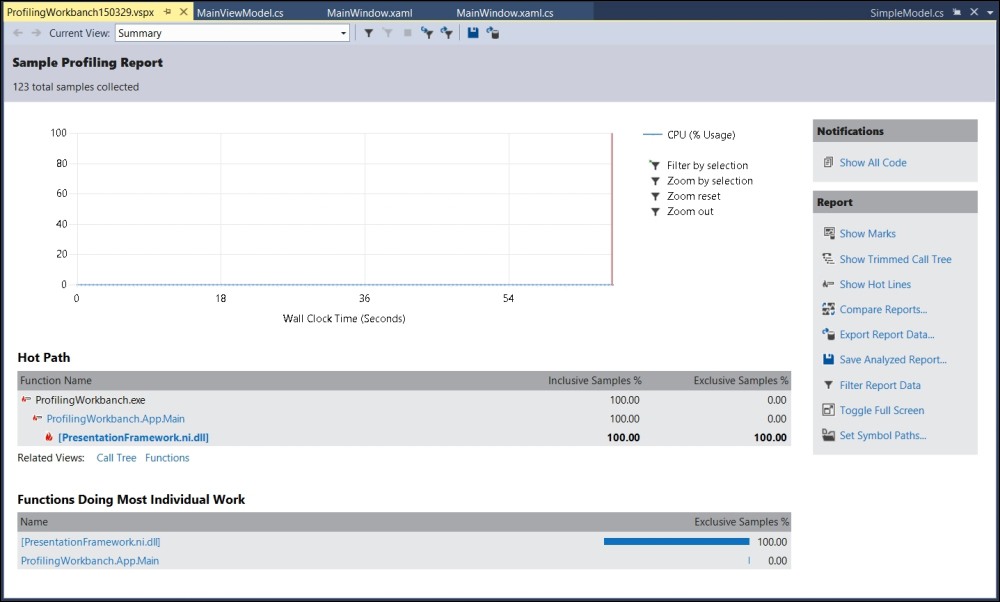
A profiling report for CPU sampling
In the preceding example, I profiled a WPF application with a single data-bindable collection, populated in memory. As a result, no CPU is used, and the profiler correctly shows that the only method that is consuming CPU time is within PresentationFramework.dll. This is because the WPF engine is outside of our code; in fact, at the place of the method name, there is the assembly name between the square brackets.
We could say that this is the ideal profiling result.
Note
The same result could be visible by profiling an application by trying to load thousands of items in a single WPF control. Although a profiler will surely show that our code is expending zero percent of the total, because the 100 percent of CPU time cost is within the WPF library, this does not mean we cannot optimize anything else. Instead, this means that we have to change presentation architecture, maybe trying to load fewer items per time, or changing the control setup, or not changing the control at all. Although profiling does not care about such performance issues, they eventually can be analyzed within other tools like the WPF Performance Suite. Some details can be found at the following URI:
https://msdn.microsoft.com/en-us/library/aa969767%28v=vs.110%29.aspx
The profiling result is available for future analysis within the Performance Explorer window usually docked to the left of the IDE. If we do not find it, it is simply available within the ANALYZE menu under the Windows item. The window lets us see all profiling configurations used for our application and historic reports. By clicking on the profiling method, we can start another recording session.
Back to the performance report, in the Hot Path box, we will find methods that consumed the most CPU time. A high CPU consuming example is available with the invocation of the Thread.SpindleWait method, which will waste CPU cycles.
public static IEnumerable<SimpleModel> GenerateMocks()
{
    var r = new Random(DateTime.Now.GetHashCode());
    return Enumerable.Range(1, 1000).Select(i =>
        {
            Thread.SpinWait(r.Next(100000, 1000000));
            return new SimpleModel
            {
                Name = string.Format("ITEM #{0}", i),
                Value = r.NextDouble() * (double)i,
            };
        })
        .ToArray();
}
As visible in the following screenshot, the CPU usage increases by up to 15 percent of the overall system. Analyzing the Hot Path box, we will see that our GenerateMocks method is responsible for the most CPU usage of the whole application (85 percent). Actually, as visible, the CPU usage happens in the System.Core external assembly, the one containing the Thread class of the core framework. The remaining 15 percent of the application's CPU time usage is because of WPF rendering:
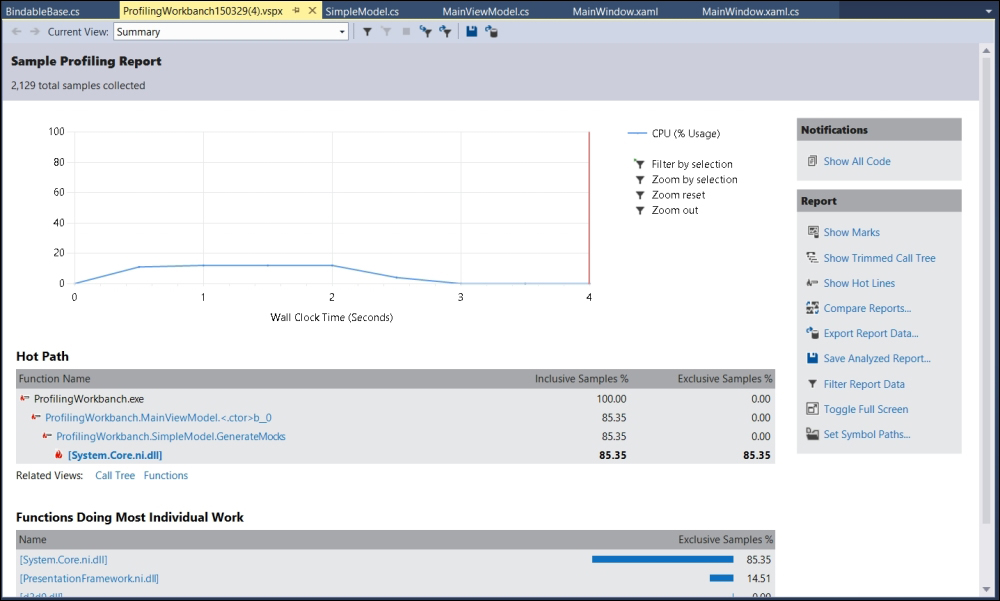
A sampling profiling report of some Thread.SpinWait usage
When reading at the Hot Path box (and other similar boxes), we have the ability to click on a single function that is CPU consuming. The click will bring us to the referred code block, if we have such a code file, otherwise (as happens when we click a core framework assembly name) if the consumption is for an external assembly, although by just clicking on its name we will be unable to read external code. In the preceding example, we can click the GenerateMocks item. This will bring us to a new view with a lot of interesting information, as can be seen in the following figure:
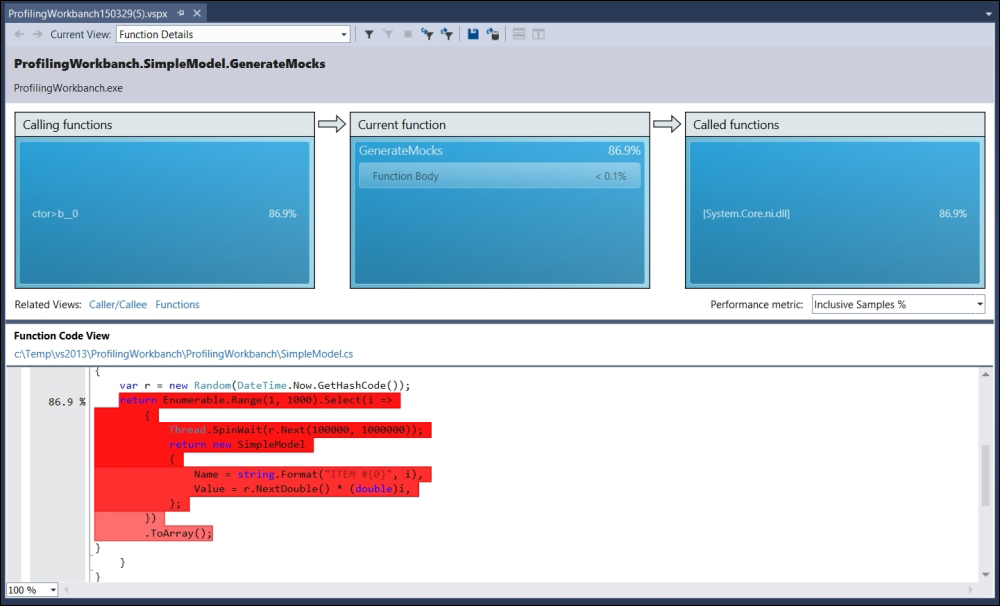
CPU sampling profiling results across code editor
By analyzing the profiling result offered by this window, we can immediately see which code row will have higher CPU usage. We can also see that our code block actually uses 0.1 percent of the CPU, maybe because of the Random.Next invocation, while the real CPU consumption comes from the method of the Core.dll.
This ability to dive into hierarchical invocation details and back to the root is the key feature of profiling our code.
Within the profiling report window, in the toolbox we have a drop-down list that names the Current View that gives us the ability to select different analysis results, all based on the recorded data from the profile. We will always see the same data, but with the ability to group it in different ways, be it in a per-function basis, or hierarchical basis, or by another way.
Executing the Performance Wizard again, we can use the instrumentation profiling technique that adds the ability to analyze the method invocation count to the CPU usage, as shown in the previous example made with the sampling technique.
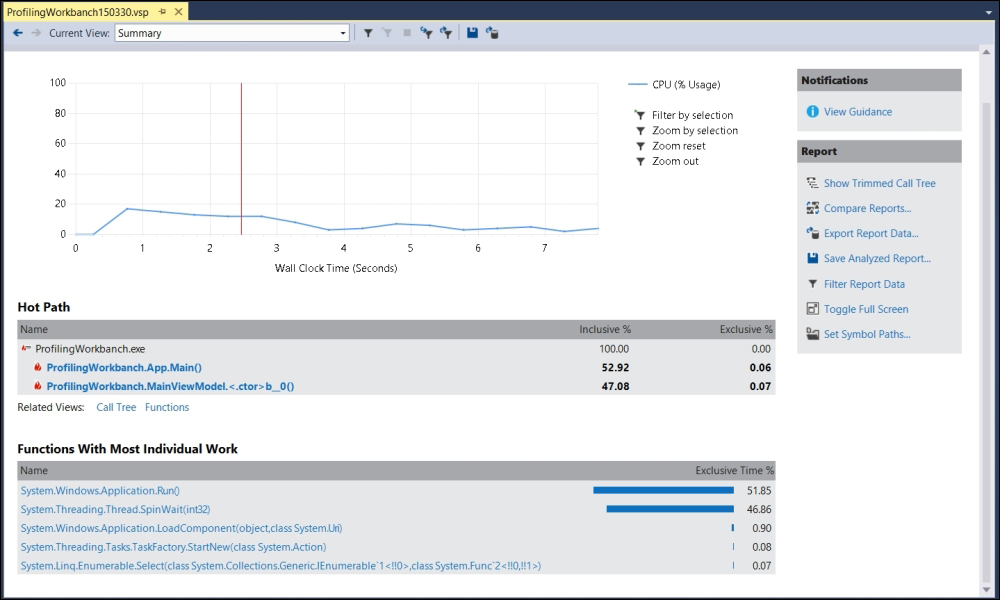
The report of a profiling with instrumentation
With instrumentation, the report summary is quite similar to the sampling one, while the detailed data available by selecting the proper view in the Current View is completely different. We still have the ability to find the most CPU consuming methods, but we also have the ability to see the invocation count. This information is priceless because it helps with finding development mistakes, other than the obvious CPU consummation.
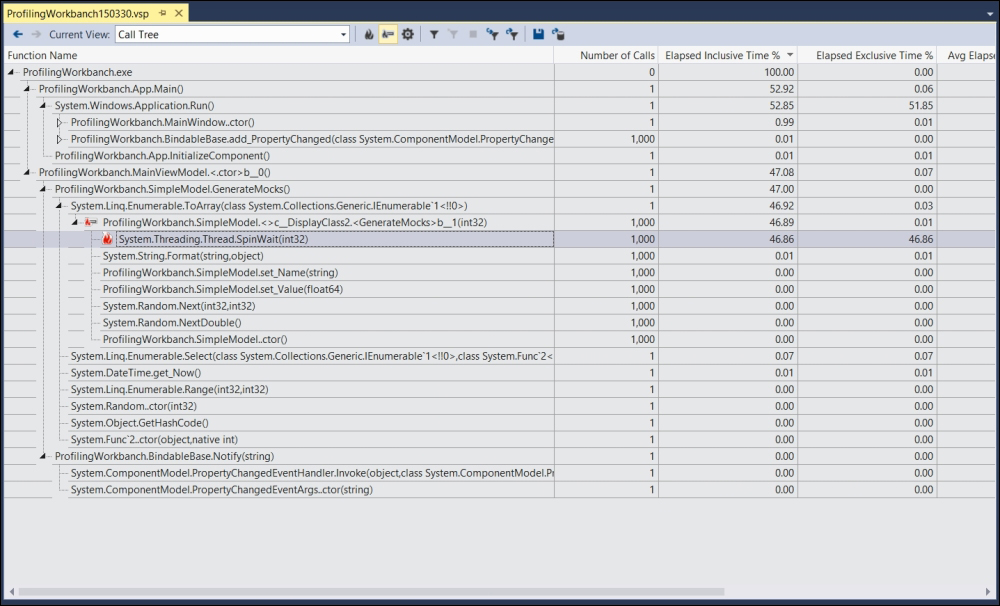
An instrumentation profiling call tree view with method call counters
Executing the Performance Wizard again, we have the ability to try the Memory Usage profiler. This profile records real-time memory usage during runtime. This gives us the ability to understand if there are critical patterns in resource usage, such as a memory leak (infinite memory usage increment), or if there are issues regarding garbage-collection timings.
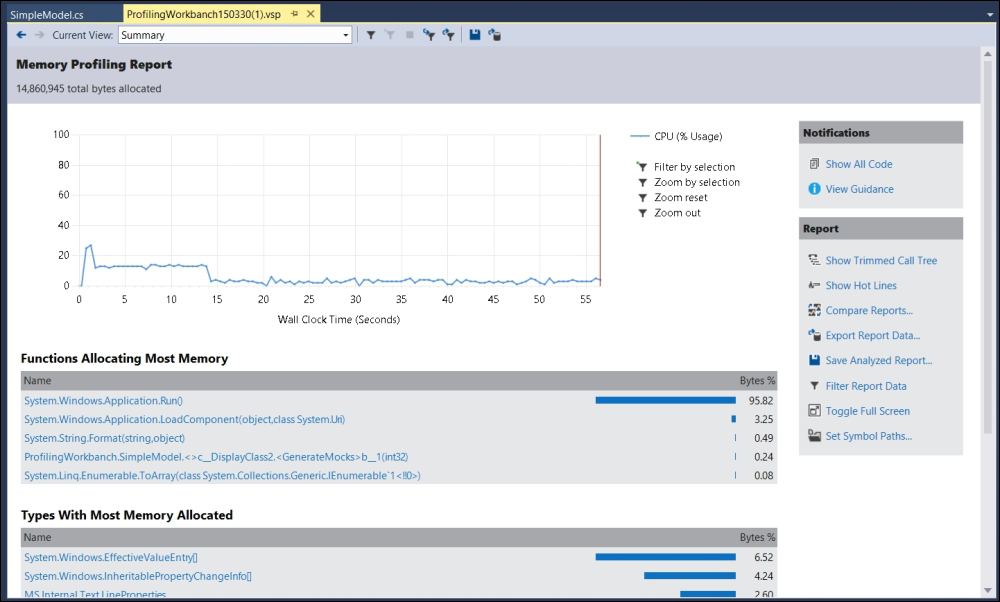
The memory profiling report summary
Within the Call Tree view, we can see memory usage in bytes and in a relative percentage. In the previous instance, the highest consuming method is the Application.Run method, executed by the WPF engine that iterates 1000 items collection and instantiates a template generation 1000 times. This results in 14MB memory consumption.
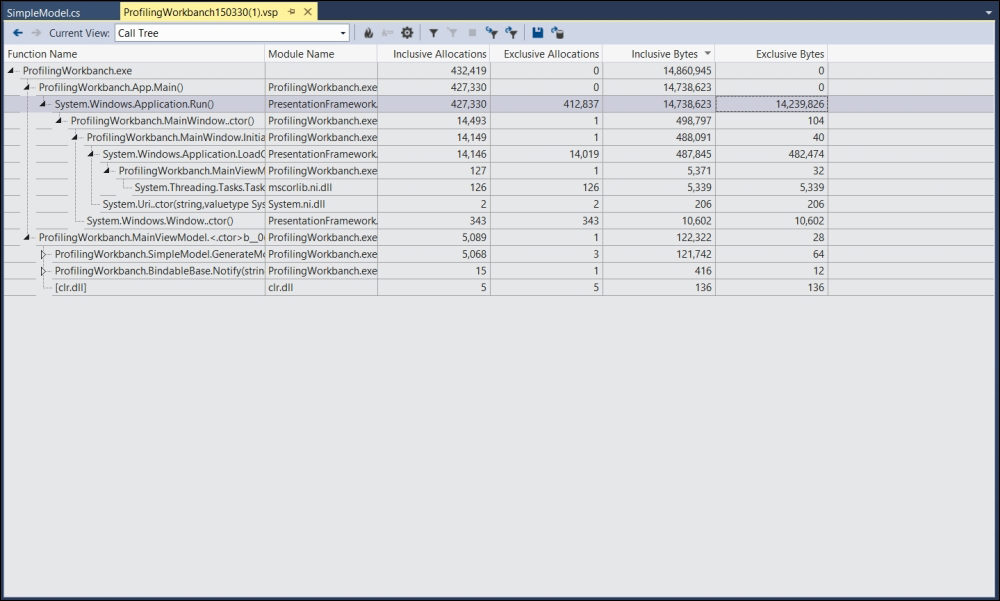
The call tree detailed view of a memory profiling report
Another great help comes with Concurrency Profiler, which is always available by executing the Performance Wizard. Such a profiler shows exactly how many race conditions happen in our code when multiple threads fight to get access to the same resource.
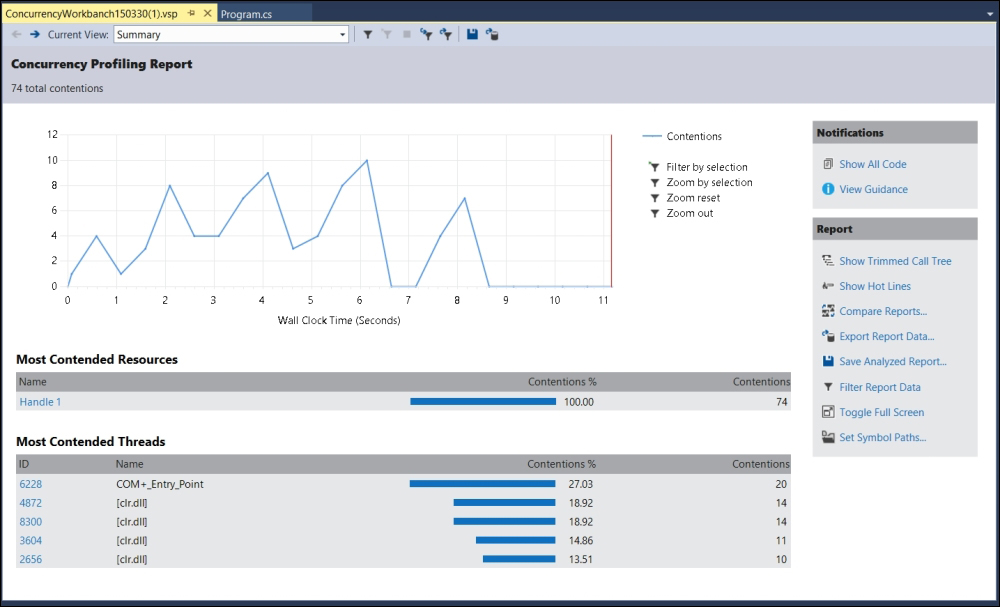
Concurrency profiling report showing race condition count
The same information is available throughout the Resource Details chart, which is shown in the following chart. On the Y side of the chart, we have thread IDs, while on the X side, we have the time. This chart is actually a Gantt chart of race condition that is happening within threads during time.
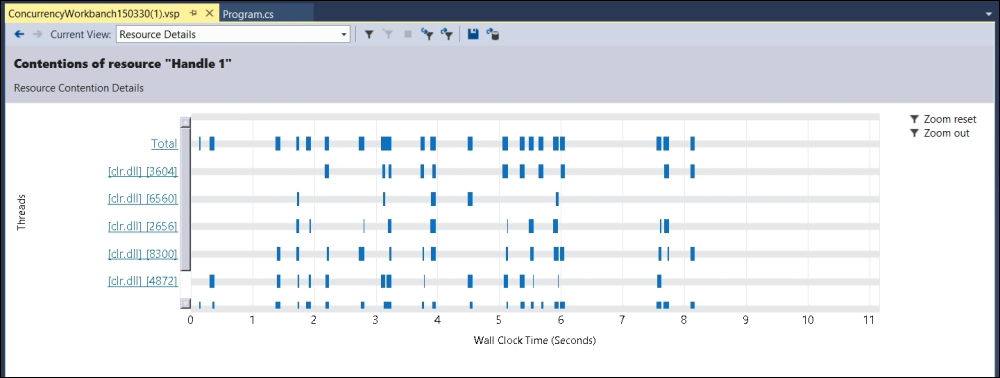
Concurrency profiling resource detail showing resource contention per thread
In the figure below, there is the Call Tree view that shows exactly how many times a race content occurred per method.
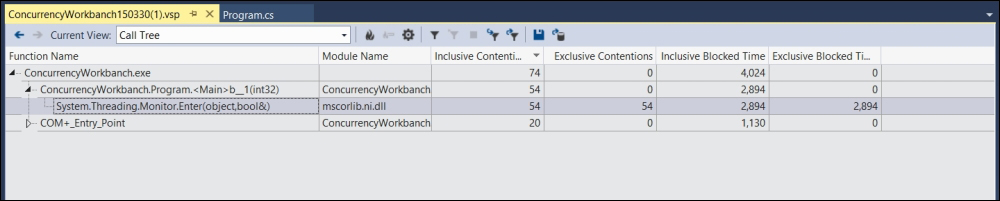
Concurrency profiling call tree showing that the most racing method is the Monitor.Enter method that is the underlying executing method for the lock C# keyword
Another great feature of Visual Studio is the report comparison. This feature gives us a clear view of how our application performance results change over time.
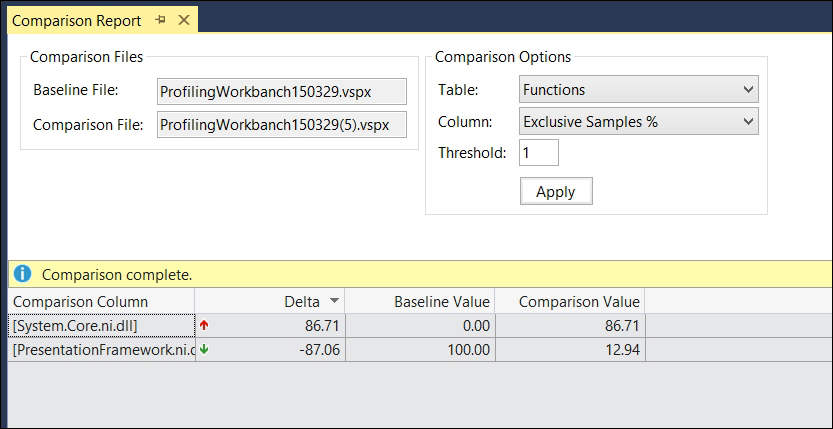
A report comparison of two sampling profiling
In the preceding example, the first report is about the demo code without any CPU wastage, while in the second report, the Thread.SpinWait method has been added. The result shows that the System.Core.ni.dll in the second report consumes more than 86 percent of the relative CPU, while the WPF rendering engine consumes a lot less, in comparison.