
Contrary to all tests or analysis against a running application, that names dynamic analysis, the static analysis focuses on our code when it is still at the design stage (when we develop within Visual Studio). In other words, it is the analysis of our code design (of the code, not of the application).
Static analysis helps to understand worst practices, such as an incorrect implementation of an event handler or the incorrect extension of the IDisposable interface within our class.
Static program analysis also helps with finding common mistakes and basic forgetfulness.
A lot of frameworks and methodologies actually exist when doing static program analysis. In this chapter, we will focus on the implementation available within Visual Studio itself.
Although static analysis is something that does not boost any performance of our applications by itself, it is obvious that an automated code analyzer makes writing good code easier. Good code always reduces bottlenecks, so we can definitely say that static analysis reduces common mistakes and helps in writing better-performing code.
Within Visual Studio's ANALYZE menu, we can execute the Run Code Analysis on Solution menu item. The analysis starts immediately for the entire solution currently opened. If anything is perfect, we will see within the Code Analysis window, the statement No Code Analysis issues were detected, otherwise a lot of warning messages will explain what we did wrong in our coding, as shown in the following screenshot.
Please note that static analysis is not an absolute truth. We can choose which kind of analysis checks to do on a project basis. Indeed, when choosing which analysis to activate or not, we could activate checks that for other software architects are irrelevant or the opposite, or we can enable a more or less verbose analysis checklist, depending on the project being analyzed:
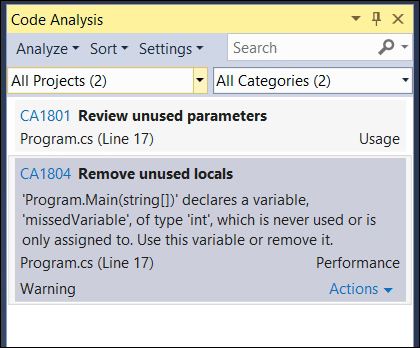
The Code Analysis window, showing a possible issue with related description
The code analysis configuration is available in the last tab of the project properties window.
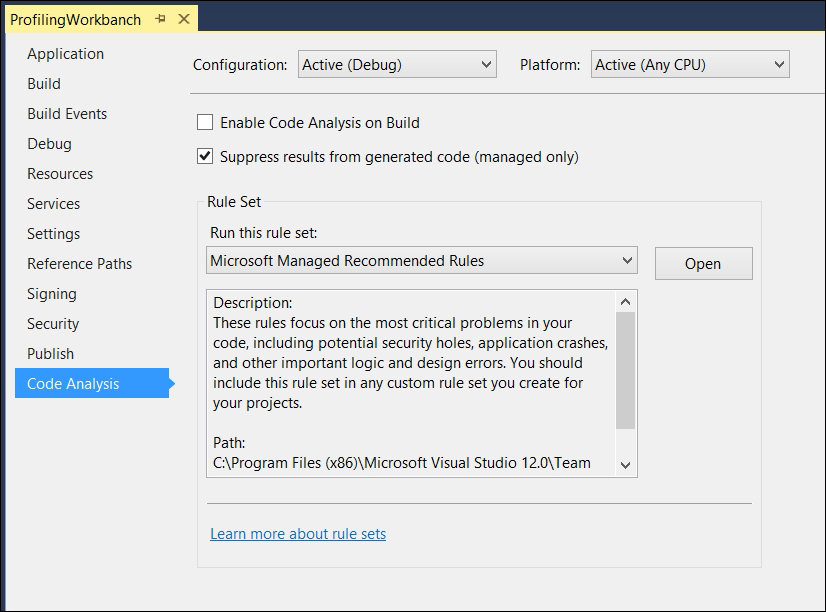
The code analysis configuration pane
Here, we have the ability to trigger a code analysis on the project build, otherwise (by default) we can start the code analysis execution when we need it.
More importantly, here we can configure which Rule Set (list of code analysis rules) to use to produce analysis issues, with the ability to open such sets for inspection or editing.
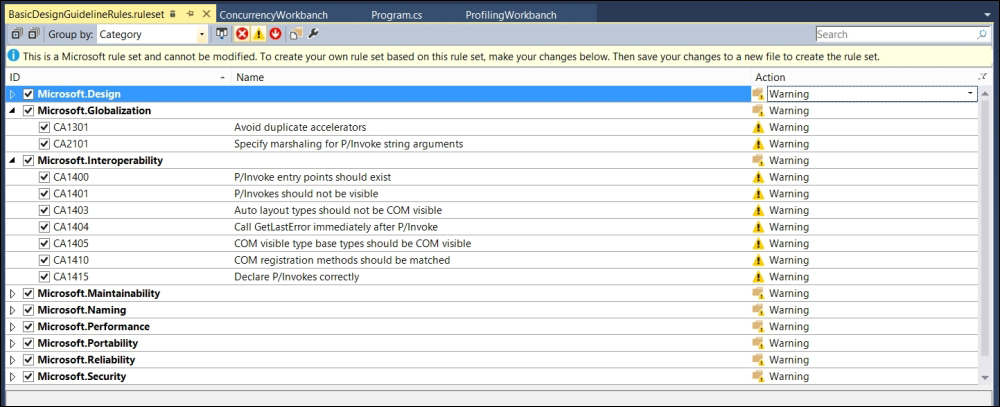
The Rule Set editor
When opening a Rule Set for editing, we have the ability to enable or disable the rule execution and change rule behavior. Although the default configuration lets us produce a Warning when an analysis check fail happens, such warnings usually do not pop up for the developer and they do not prevent project compilation. Instead, we can configure an Error output in place of the warning. These errors stop project compilation and can be used to link (together with the analysis on build) code analysis to the TFS Continuous Integration. The combination of the two features is definitely useful for team membership.
Another interesting feature that helps you to develop good code is the code metric analysis against our solution/projects.
Different from classical static analysis, code metrics are indicators that help us to understand the overall quality of our code by executing mathematical analyses.
Typical examples are the number of code lines, the number of inheritance levels, and other statistical values like the Cyclomatic Complexity.
Within Visual Studio 2013, we have the ability to execute a Code Metric analysis, accessed by the usual menu root ANALYZE. Here, we find the Calculate Code Metrics for solution menu item that will start the analysis immediately without any wizard or confirmation:
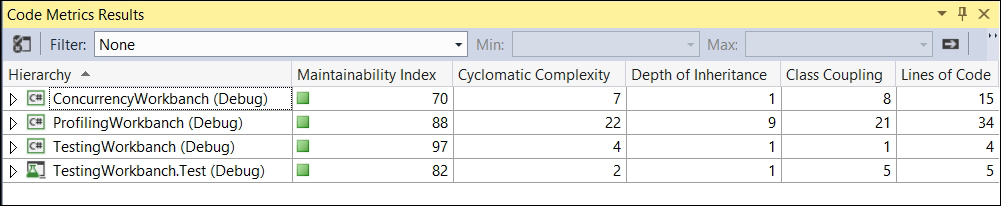
The Code Metrics Results window showing metric results
Within the Code Metrics Results window, we will see the results on a per project basis.
The complete explanation of the metrics analyzed, as shown in the preceding screenshot, is available through the MSDN website:
https://msdn.microsoft.com/en-us/library/bb385914.aspx
Although such indicators are useful to give numeric details on our software, never try to keep such indicators to their best value, because such a practice is something that can bring a lot of trouble. Indeed, well reviewed software regarding metrics could bring you a poorly designed and poorly performing application. Take such indicators as they actually are. They are useful indicators that can give a potential representation of our job, and give developers like us the time to rethink our application's behavior. The time to rethink, could bring about better software and not by trying to reach 100 in the Maintainability Index.
Another useful tip is regarding the Lines of Code indicator. Thirty years ago, the number of lines of code was a measure of working effort (such analysis is called SLOC). Today, writing so many lines of code means creating something difficult to maintain and often means we have simply wasted time in developing useless things.
Please note that when we extremely decouple our code with a C# interface per class, if such decoupling does not bring real benefits in future maintenance, this will actually only bring more overall work, in the present and in the future. The key to success is writing the right number of source lines without creating useless components, supporting future needs without predisposing features that we already know we don't need. Always compare your software module results regarding code metrics in order to keep a matrix index history.
For instance, if we develop a business library of thousands of lines of code, that is fine, while if we find that a simple assembly responsible for a few functional tasks has a thousand lines of code, there is something wrong. The question we should ask ourselves is how can my logging library be so verbose, compared to my business one?
An interesting metric is the Depth of Inheritance, also visible in the preceding screenshot. When using polymorphic behavior, a high level of inheritance could cause difficulty in maintaining and using code.
Note
For further reading refer to: http://en.wikipedia.org/wiki/Software_metric