
5
Planning for Scale and Resiliency
This chapter looks at the concept of “scaling our applications” that are hosted in the AWS cloud. Scaling is the secret sauce for all public cloud providers: everybody has this feature, and everybody uses this feature. Every application that you like to use on your phone or tablet is controlled by some elements of scale. If your application is slow, perhaps it’s because there are too many users currently accessing the application. If your application has decent performance, the odds are that the application is being carefully monitored, and resources are being added or removed based on demand.
Are you watching a movie on Netflix? If you’re watching a popular movie, the odds are that other people are also probably watching. Being able to scale or increase the resources that host the movie based on user demand, Netflix has happy customers. When you’ve shopped at Amazon, can you remember slow page loads and slow response times? Certainly, it has happened, but the odds are that it rarely happens because of AWS’s ability to scale its cloud resources based on demand.
In Chapter 1, “Learning AWS,” we looked at the definition of what the public cloud seemed to be based on the National Institute of Standards and Technology (NIST) proclaimed definitions of what public cloud providers were currently doing. One of the NIST characteristics of the public cloud was defined as rapid elasticity featuring the statement “capabilities can be elastically provisioned and released in some cases automatically, to scale rapidly outward and inward commensurate with demand.”
Let’s break down this definition into something more readable: “capabilities can be elastically provisioned and released” describes a situation in which a hosted cloud application can seemingly be changed on demand to provide the desired level of performance by adding performance or taking away the level of performance. Accurately making these types of decisions is completely based on the real-time monitoring of your cloud applications and resources. If you don’t know the current state of your application—such as the exact amount of current load being placed on your application servers at this exact moment—then it’s impossible to know when you should add or remove additional compute power or storage.
Note
Here’s the first rule of running applications in the cloud: you don’t know what’s going on unless you’re monitoring your application resources 24/7.
The next part of this definition, “in some cases automatically,” means that you can perform the task of scaling automatically. Most AWS services have a dashboard where you can view the current status of your service and make changes. AWS services can use CloudWatch alarms, or SNS notifications alert you via text or email if there are performance issues. However, the last word of the definition, automatically, is the goal. For applications hosted in the cloud that need to be able to handle more users or additional queries at a moment’s notice, automated scale is the goal, and it’s one that can be accomplished using built-in AWS management services.
The last part of the NIST definition was defining the process of automated scale based on demand—“scale rapidly outward and inward commensurate with demand”—and the ability of your applications to scale outward (add resources on demand) and to scale inward (remove resources that aren’t required any longer). Real-time monitoring is required to automatically scale applications out and in on demand. The ability to automatically add or remove application resources in the cloud is also due to virtualized resources and horizontal scaling. We are not changing the size of our servers to be bigger; vertical scaling of compute resources requires downtime. Scaling in the cloud is horizontal scaling—automatically adding or removing application servers to an existing load-balancing cluster based on demand.
The best example is Amazon and its online store, which of course is powered by Amazon Web Services. On Black Friday or during the holiday season, one could reasonably expect additional Web and application servers to be required to handle the unknown number of customers who will be buying stuff on Amazon. In the initial few years of operation of Amazon.com, the number of servers running was based on expectations—trying to have enough resources available when there were lots of customers. It was a proactive but very expensive design.
Running too many resources costs Amazon a lot of money and will also cost you too much money if hosted resources are on and available but not being fully utilized. Today, Amazon uses monitoring and automation to horizontally scale its Web and application compute resources out (adding more compute power) and in (removing compute power) based on demand. If Amazon can do this, you can as well. Once you’re running just the right number of servers based on current demand, and then based on higher or lower levels of demand, dynamically scaling out and in as required, you’ll be saving rather than wasting money. And your customers will be happier because your applications will remain sized automatically based on current requirements.
The AWS cloud has many services that take advantage of scale. AWS also calls scale elasticity. Look at the naming of the services that make up AWS: Elastic Cloud Compute (EC2), Elastic Load Balancer (ELB), AWS Auto Scale, and EC2 auto scaling. Scale is either implied or part of the name of the AWS service. Typically, when scale is being defined, we are talking about scaling compute resources. However, at AWS, compute (which includes containers) and cloud storage such as elastic block storage (EBS) volumes and global DynamoDB tables can also be scaled automatically.
Note
The automatic scaling of compute resources at AWS is dependent on the monitoring of the compute resource that needs to scale using CloudWatch metrics.
Another one of the NIST cloud definitions is resource pooling, which is also related to the ability to scale. You can’t scale your resources (adding to the number of EC2 instances supporting your application) unless you have the actual resources available to add. Remember: all AWS resources have defined soft limits that limit the number of AWS resources that are available to you as an AWS customer. Therefore, scaling in the cloud is only possible if you have the required resources available when you need to add them. And if you’re not monitoring your resources, you won’t know when to add more or to remove resources when they’re no longer required. For more details on soft limits and the type of compute resources available at AWS, make sure to review Chapter 4, “Compute Services: AWS EC2 Instances.” In this chapter, we focus first on monitoring, move on to load-balancing, and finish off with auto scaling. These three services work together providing scalable applications at AWS.
The topics for this chapter include the following:
Monitoring with CloudWatch
Alarms and alerts
Elastic Load Balancing
Application Load Balancing
Network Load Balancing
EC2 auto scaling
AWS auto scaling
Terra Firma is just about finished testing its applications in the cloud, and they seem to work as expected. But now the company needs to look at providing redundancy and failover in scale. Terra Firma also wants to know how the applications are working before problems start occurring. And it wants to control the developers’ spending habits. (They also drink too much coffee, but that’s manageable.) In a nutshell, the developers need to know the answers to these questions:
What kind of monitoring service is available at AWS?
Is it possible to be notified when problems occur with applications?
Can automated solutions be set in place for applications that are overloaded?
Can the load balancer perform decryption and authentication?
Can we track user authentications when problems occur?
How complicated is it to set up automatic scaling?
The Concept of Monitoring
Back before cloud became mainstream, one of the common reasons for hosting application servers as virtual servers—that is, using VMware—was that most physical servers were found to be percolating along at a 15%–20% load on average. (Obviously, a database server was usually under a much higher operating load.) Companies found that using a large physical server with lots of RAM and CPU cores running multiple virtual servers was a much better use of the existing hardware. Enter the VMware age.
Experience showed that if multiple VMs were hosted on a physical server, proper monitoring of the hosted virtual machines was essential to ensure that each virtual server’s performance was adequate and to make sure that each VM was not running out of RAM, CPU, and storage. And because virtual resources were being utilized from physical resources, additional RAM, CPU cores, and storage could be added and removed as required.
Because of proactive monitoring techniques, we knew when issues and problems arose. If we didn’t monitor, we’d run into trouble. When hosting applications in the AWS cloud, monitoring is even more essential; if you don’t monitor your AWS resources, you’re not going to know when there are issues; therefore, you’re going to get in a lot of trouble.
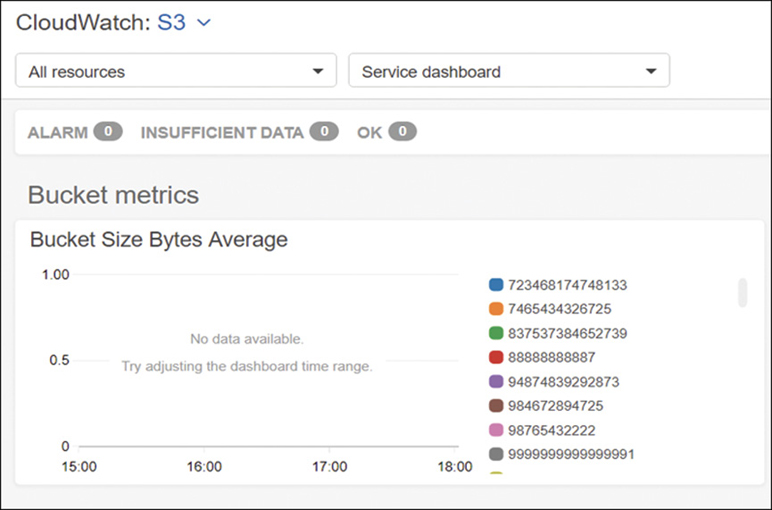
Most AWS services, such as EC2 instances, are integrated with the built-in monitoring service CloudWatch, as shown in Figure 5-1. As you order and configure AWS resources, basic metrics associated with each AWS resource are loaded into CloudWatch, enabling you to monitor your resources.

Now, to be clear, you can add your own third-party monitoring solution’s monitoring agent to your EC2 instances. You don’t have to use CloudWatch; you might have specific needs and requirements that CloudWatch can’t match. However, if you’re using hosted AWS resources that employ EC2 instances or containers hosting applications—or database servers hosted by RDS—and you don’t have another monitoring solution, then you should consider using CloudWatch monitoring because AWS resources are already wired into the CloudWatch monitoring service. Perhaps you already have a monitoring solution that can integrate with CloudWatch datapoints using the CloudWatch application programming interface (API) in conjunction with your third-party monitoring solution such as Loggly or Datadog.
CloudWatch is a frugal, economical monitoring solution that will never be as powerful as a third-party monitoring tool. In fact, Amazon engineers have stated this fact many times. CloudWatch’s basic claim to fame is auto scaling EC2 instances hosted behind an ELB load balancer. It manages the auto scaling process quite well. The following are useful features of CloudWatch to consider implementing:
Auto scaling with CloudWatch alarms—Automatically adjust your applications based on need with EC2 auto scaling, ELB, and CloudWatch alarms.
Filter logs with metric filters and alerts—Be notified when specific data patterns occur in your logs, and act accordingly using CloudWatch alerts, metric filters, and simple notification service (SNS) notifications calling Lambda to run custom functions for custom tasks.
Billing alarms enabling you to monitor costs—Control costs by matching billing alerts to actual budget targets using billing alerts and SNS notifications.
Logging CloudTrail IAM API calls to CloudWatch logs—This involves creating CloudTrail trails, storing the trails in CloudWatch, and using metric filters on root account activity.
Note
Any third-party monitoring service you use today, such as Splunk, Datadog, New Relic, and many others, supports integration with AWS CloudWatch data records and S3 buckets.
What Is CloudWatch?
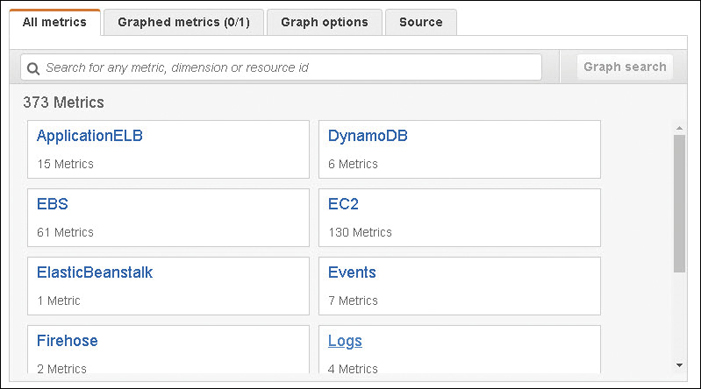
CloudWatch is a monitoring service embedded in the AWS cloud operating system. Many AWS services use CloudWatch to collect metrics that you can use to analyze how your service is currently operating. After ordering specific AWS services, metrics are enabled and available for evaluating the performance and operation of most AWS services, including EC2 instances, EBS volumes, Elastic Load Balancers (ELBs), Auto Scaling groups (ASGs), relational database service (RDS) DB instances, DynamoDB tables, Route 53 health checks, SNS topics and Simple Queue Service (SQS) queues, Storage Gateways, and S3 buckets, as shown in Figure 5-2. Only once an AWS service has been ordered and begins operation is there any data flow, and subsequently, CloudWatch metric data records published to the service’s CloudWatch dashboard.
Monitoring
Basic monitoring provided by CloudWatch is free of charge and, depending on the AWS service, a select number of metrics are enabled. Metrics report to CloudWatch on a variety of intervals. There is no default among all the services that are supported. For example, for EC2 instances and containers (elastic container service [ECS]), metric data is sent to CloudWatch every 5 minutes. For RDS databases and ELB, a selection of metric data is sent to CloudWatch every 60 seconds. EC2 instances also can enable detailed monitoring, which increases the reporting period to every 60 seconds; however, detailed monitoring is not free.
There’s no exact rhyme or reason as to why there are initial differences between the exact number of metrics that are bundled with each AWS service for basic monitoring. Make sure to check what basic monitoring options are available for each service in the AWS documentation; new metrics are being added to CloudWatch all the time, further enhancing its monitoring ability. With every AWS service, there are additional metrics you can choose to also use in monitoring. The CloudWatch metrics shown in Figure 5-3 have been enabled for this particular AWS.
Logging
CloudWatch also has a logging service that allows you to send your log data from your Linux and Windows instances to CloudWatch log groups. This enables you to further analyze and search your log data for any specific patterns, such as errors or system issues, that you want to analyze further (see Figure 5-4).
The CloudTrail managed service tracks all API calls made to an AWS account for 90 days. The creation of “trails” allows you to send all CloudTrail event information to a CloudWatch log group. CloudWatch log data can also be monitored by creating a metric filter that looks for a specific data pattern or patterns. Once a matching data pattern is found, a CloudWatch alarm can fire off an SNS notification about the issues that have been found (for example, 404 status codes in an Apache access log).
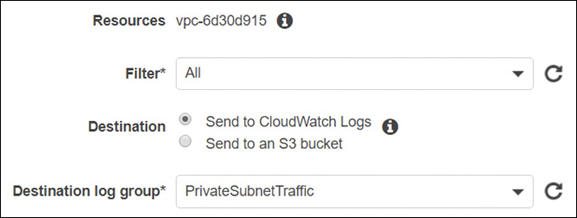
Another example of CloudWatch log groups is a virtual private cloud (VPC) network feature called VPC flow logs. Once those logs are enabled, network traffic can be captured from a single network adapter, a single subnet, or all network traffic within a VPC to a CloudWatch log group, providing the ability to analyze your network traffic.
Collected data stored in a CloudWatch log can be analyzed further by selecting one of the following options, as shown in Figure 5-5:
Export log data to Amazon S3—Log information on a defined date range can be exported to a Simple Storage Service (S3) bucket for analysis by any third-party monitoring application.
Stream log data to AWS Lambda—When a log event matches a specific filter, Lambda can swing into action and carry out its defined task. Amazon warns you that streaming log data might cost you; it recommends creating a budget that alerts you when you are close to exceeding your defined budget.
Stream to an Amazon ElastiSearch Cluster—Do this and visualize your data using the open source data virtualization tool Kibana.
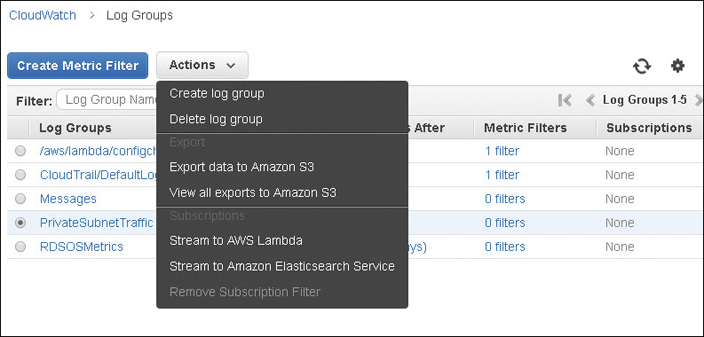
Figure 5-5 CloudWatch log data export options
Terra Firma developers can use the CloudWatch logs to analyze network traffic, and the com-pany’s auditors will be able to analyze any API call made to any of its AWS accounts.
Note
The default retention of CloudWatch logs is forever; however, you can decide on a retention timeframe of up to 10 years. Retention of records stored in S3 buckets can be managed with lifecycle rules.
Collecting Data with the CloudWatch Agent
Like any monitoring service, the back-end engine of CloudWatch receives and stores metrics or log data from a CloudWatch agent installed on the EC2 instance, or, optionally on Linux or Windows Server 2016 or later server images that are located on-premise. Supported Linux operating systems include all Amazon Linux versions since 2014, Ubuntu (14.04 and 16.04), CentOS (6.5 and 7.0), RHEL (6.5, 7.0,7.4, and 7.5), Debian 8.0, and SUSE Enterprise Server 12 or later. Amazon machine images (AMIs) of supported operating systems have the CloudWatch agent installed by default.
CloudWatch Agent Install Steps
If you migrate your virtual machines to AMIs, you need to install the CloudWatch agent yourself. The agent also requires an identity and access management (IAM) role to transfer data to CloudWatch.
If you want to install the CloudWatch agent on servers located on-premise, then an IAM user must be created that will in turn enable the agent to upload data to CloudWatch. You can download the agent from a public S3 link provided by AWS: https://s3.amazonaws.com/amazoncloudwatch-agent/<operating_system>
Create the CloudWatch agent configuration file that defines the metrics and logs for which the agent is going to collect proxy settings, IAM role or user credentials, and region information.
Run the CloudWatch Configuration Wizard to install the agent.
Start the CloudWatch agent with either a fetch-config command line, a PowerShell command, or an AWS Systems Manager run command.
To access the companion videos, register your book at informit.com/register.
Planning for Monitoring
When deciding what to monitor, the best suggestion is to keep it simple when first starting. If you make it too complicated in the beginning, you’ll probably give up. We are monitoring because we want to know when our AWS services are not operating as we expect. Perhaps the service seems slow and we want to understand why. We are ultimately monitoring to be kept abreast of potential problems before they occur and when problems occur. Monitoring allows us to become proactive in solving problems. Monitoring also allows us to proactively react to problems through automation.
Also, it won’t be obvious at first, but after you start monitoring and evaluating the results, the light will turn on; your data will indicate what trends are happening, and you will begin to discover why monitoring your applications is essential.
The types of things you can monitor include the following:
Performance-based monitoring—Monitoring your application’s compute speed (database, application, or Web server) over time allows you to develop your own initial baseline of operation and what you deem to be an acceptable level of performance. For example, monitoring an application server over a longer time period—for multiple weeks or months—provides valuable data insights as to when the application server gets busy, when there are quiet times, and whether it is busier at the end of the month or at certain times of day. The same criteria can apply to a Web server or a database server. EC2 instances, ECS containers, and RDS instances have CloudWatch metrics; in fact, all AWS services have some integration with CloudWatch.
Resources to Monitor—The initial components to monitor with regard to compute performance are the same ones we have always monitored: CPU, memory, storage, and networking.
CPU and RAM utilization—EC2 instances have the CloudWatch agent installed, which collects many system metrics from EC2 instances. On EC2 instances running Windows Server, all counters in Performance Monitor can be collected by the CloudWatch agent. Linux instances collect system information using metrics for CPU, disk, memory, and networking.
Available disk space—Hard disks with more than 70% disk space used are typically on the edge of causing problems due to lack of available free space. EBS volumes have disk performance and disk read and write operation metrics, and the CloudWatch agent can report on total disk space, used space, percentage of total disk space, and many other metrics. We can also quickly scale our EBS drives at AWS.
IOPS—CloudWatch has metrics for EBS volumes, as shown in Figure 5-6. In addition, the overall read and write performance of EBS volumes can be monitored and increased if necessary by raising input/output per second (IOPS) performance to 64,000 IOPS.
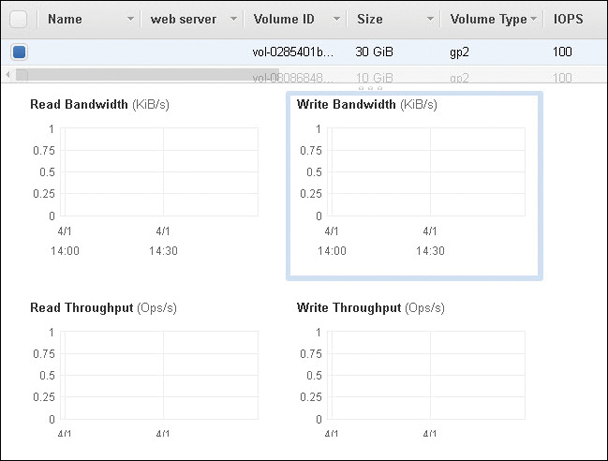
Figure 5-6 EBS CloudWatch metrics Network traffic—Traffic includes subnet traffic but can also include load-balancing and connections to the cloud, including VPN connections and Direct Connect connections. CloudWatch metrics are available for the ELB service, network address translation (NAT) gateway, transit gateway, and VPN connections. VPC flow logs also capture pertinent network information that is stored at CloudWatch. Additional metrics are available for EC2 instance networking.
Note
At AWS, you can set up notifications for emailing, texting, or sending a notification to an SQS queue, SNS topic, or even better, to Lambda, which could carry out an automated solution using a custom function.
CloudWatch Integration
The following list details some of the AWS services that are embedded with CloudWatch:
SNS—It is used for communication to humans or to other AWS services for sending automated alerts when CloudWatch alarms or events fire.
ELB—Load balancer metrics include active connection count, request count, healthy host count, transport layer security (TLS) connection errors, HTTP responses, and errors.
S3 buckets—Storage metrics detail the number of objects and bucket size; request metrics include all requests, get requests, bytes uploaded and downloaded, 4xx errors, and 5xx errors.
EC2 instances—Once an instance has been launched from the Monitoring tab, 14 metrics are displayed, as shown in Figure 5-7. These include options for CPU utilization and credits, disk read and write operations, network traffic and packet flow, and status checks.
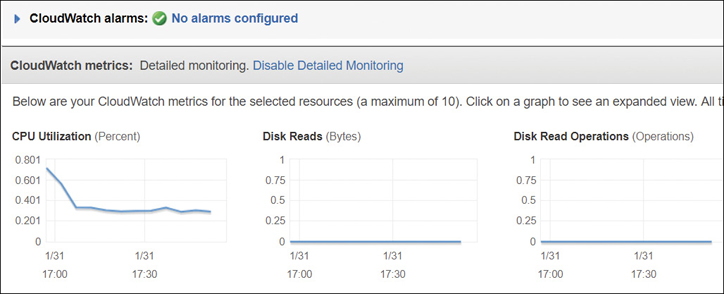
Figure 5-7 EC2 instance metrics EC2 auto scaling—This allows you to launch or terminate instances controlled by CloudWatch alarms. Metrics include auto-scale group metrics such as the minimum and maximum group size and the in-service, pending, standby, and total instances.
CloudTrail—After a trail has been created, CloudWatch writes the API calls fired in your AWS account to a CloudWatch log file stored in an S3 bucket.
AWS Config—All evaluated rules that fall out of compliance can invoke CloudWatch alarms, which in turn call Lambda.
RDS—Metrics include database connections, disk queue length, free storage space, read and write throughput, solid-state drive (SSD) burst balance, and CPU credit usage.
IAM—All authentication attempts, both successful and unsuccessful, can be monitored by a CloudWatch alarm. When the alarm is fired, SNS notifications can notify humans and automated responses.
Trusted Advisor—metrics include color-codes: green (good), red (there’s issues to check), and yellow (there’s warnings to consider).
VPC—Metrics include NAT and transit gateways.
CloudWatch Terminology
CloudWatch has its own language to understand with specific terms and definitions.
When you create a CloudWatch alarm, choose the metric you want to monitor.
Choose the evaluation period that the metric will be monitored for, as shown in Figure 5-8, and what statistical value to measure. Value examples include minimum, maximum, average, and SUM.

Figure 5-8 Defining the metric evaluation period For each alarm, set a threshold. Choose whether the alarm will trigger when the value is greater than (>), greater than or equal to (>=), less than (<), or less than or equal to (<=) the defined statistic.
Namespace—Each AWS service stores its CloudWatch metrics and associated data in its own container. At this writing, there are more than 74 AWS services that use CloudWatch metrics.
Metrics—Each metric is a variable within an AWS. Each monitored variable produces a data set that is collected over a time period resulting in a graph defined by data points. The data points represent the metric data received from the variable being monitored at an exact point in time based on the range of times selected. For example, with EC2 instances, you can monitor the metric CPU usage, as shown in Figure 5-9. Over the last hour, which is shown on the x-axis, the data points represent the data collected over the last hour in 5-minute increments, defined as the period of time. The y-axis shows the percentage of CPU utilization.
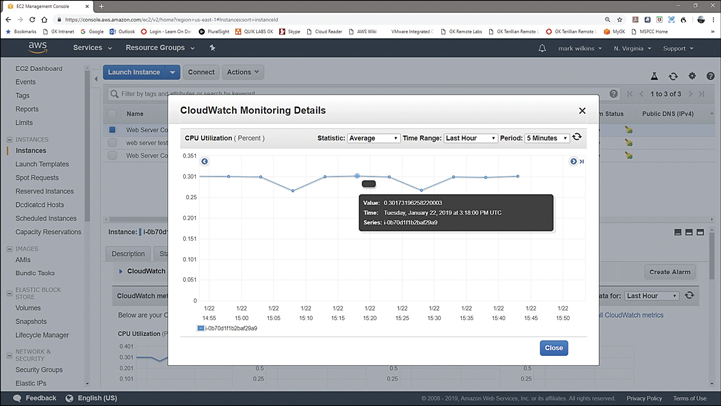
Figure 5-9 Data points summarized every 5 minutes
Statistics—Each metric that you select for analysis collects data based on a defined time period. Graphed data will be categorized statistically using some of the following terms:
Minimum—The lowest value seen during the specified time period
Maximum—The highest value seen during the specified time period
Sum—All values are added together based on a specific time period
SampleCount—The number of data points over a time period
Average—Calculated from Sum divided by SampleCount based on the time period
Dimensions—A dimension describes the metric and what data it stores. Multiple dimensions can be multiple instances assigned to the metric CPU utilization.
Units of measurement—Statistics are defined by bytes, seconds, count, or percentage.
Timestamp—Each metric is stamped with a timestamp that references the exact time when data was received. Each timestamp includes the date, hours, minutes, and seconds based on the current time in UTC format.
Time Range (Period)—The length of time data is collected based on a metric calculated on the defined statistical value. Periods of time can be set from 1 minute up to 15 months. The number of periods define the number of data points that are presented on the graph.
Alarms—An alarm starts an action based on the state of the metric’s data over the defined time. Alarms can be notifications using SNS topics, an EC2 action, or an auto scaling action. Each of the CloudWatch metric’s data output can also be analyzed against a custom baseline of defined measurement; if the data is below a defined threshold, all is well. However, once the metric’s results exceed the baseline or exceed the baseline for a defined time period, CloudWatch alarms can fire, notifying you that there’s potentially an issue. Even better, CloudWatch can alert another AWS service that there’s a problem, and the problem can be fixed—automatically in some cases. Once enabled, every CloudWatch alarm has three possible states:
OK—This means that the associated metric is still okay; the data that has been collected and evaluated by CloudWatch still fits within the defined alarm threshold. For example, you may have defined the CPU utilization at 60%. CloudWatch’s analysis of the metric’s data points over a defined evaluation period indicates that CPU utilization is currently at 52%; therefore, everything’s still okay.
ALARM—Everything’s not okay; the metric’s data indicates that the established baseline of acceptable CPU utilization has been breached.
INSUFFICIENT DATA—Everything might still be okay; there’s just not enough data yet to make a definitive analysis.
Events—CloudWatch provides near real-time stream of system events for most AWS services based on a defined pattern, such as API calls indicating Root account usage within the AWS account or any IAM API calls. The stream can be stored in a CloudTrail log group and tracked by a metric filter, as shown in Figure 5-10. The target that is notified when the event rule fires can be several AWS services, including an SNS topic, a Lambda function, or an SQS queue. Terra Firma can use events to track any issues with user authentication to AWS.

Figure 5-10 Defining a CloudWatch event
All metric data is stored with a timestamp referencing a specific point of time; at AWS, these timestamps are defined as a data point. By default, metrics are defined as standard resolution, which has a resolution of 1 minute. You can change the resolution of the data point from 1 minute to 1 second, resulting in a much more granular distribution of data points. Once you have stored your data in high-resolution format, you can then retrieve it in periods ranging from 1 second up to multiple minutes.
Note
Pricing for CloudWatch is based on the type of metric, the number of dashboards, and the number of alarms that fire. The first 5 GB of CloudWatch log data storage is free; additional storage will be charged. The AWS services that are integrated with CloudWatch send their associated basic metric information to the default CloudWatch dashboard with no additional charges.
One of the best example of AWS service integration and automated problem-solving is the relationship between the gang of three essential AWS services: CloudWatch, Auto Scale, and ELB (load-balancing), which can work together seamlessly. Of course, there is still the need to manually carry out the initial setup of ELB, Auto Scale, and CloudWatch. Once setup is complete, we have an automatic monitoring, alerting, and scaling response. Here’s how the gang of three AWS services work together:
Instances hosted on subnets in different availability zones (AZs) can be protected by a load balancer. The instances can be monitored by CloudFront on a select metric such as network packets in or CPU utilization, as shown in Figure 5-11.
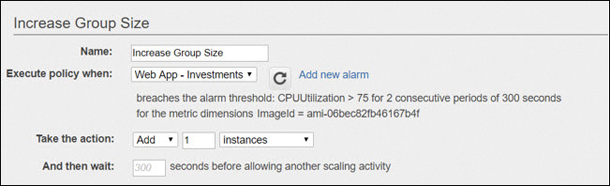
Figure 5-11 CloudWatch and EC2 Auto Scaling in action Once the selected metric on the instances has exceeded the defined performance threshold for a defined time period—let’s say 75% for five minutes—CloudWatch can promptly fire an alarm that calls the auto-scaling service.
Auto Scale starts the build of an additional instance; once ready, the instance is added to the pool of instances targeted by the load balancer. The performance problem is automatically solved without human intervention.
Using the Dashboard
Opening CloudWatch from the management console displays the default dashboard listing all the current AWS services in your AWS account and the alarm states of your services. If you are currently using fewer than six AWS services, custom dashboards of each service are displayed along with key metrics of each service, as shown in Figure 5-12. Selecting one of the custom dashboards allows you to focus on a specific service.

Creating a CloudWatch Alarm
The first task is to choose the appropriate metric that we want to link with an alarm function. You then need to define the threshold that, when breached, fires the alarm.
From the CloudWatch console, choose Alarms. Choose Create Alarm and then Select Metric.
From the service namespace (for example EC2), choose your metric or metrics.
Select the Graphed metrics tab, as shown in Figure 5-13, and set the following options:
Statistics—Choose Minimum, Maximum, Sum, or Average.
Period—Choose the time frame that data is sampled, such as 1 minute.

Figure 5-13 Define metric behaviors
Define the alarm with a defined name and the threshold for the alarm to fire, as shown in Figure 5-14.
Whenever—Define the metric, which in this example is CPUUtilization.
Is—This can be defined as greater than (>), less than (<), or greater than or equals (>=).
For—This lists the number of data points and the number of sampling periods (in our case, 3 data points).
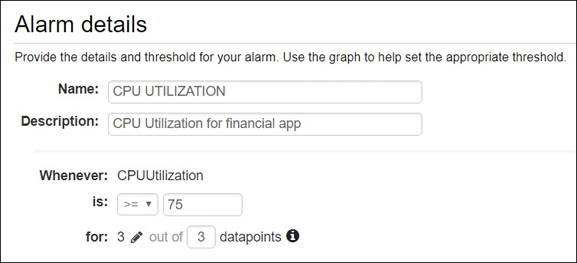
Figure 5-14 Set CloudWatch alarm details
Additional Alarm and Action Settings
There are some complicated settings that can define how the stream of metric data is handled when it is stored in CloudWatch:
Perhaps the instance ran into problems and didn’t send data; if that was the case, the default setting of Missing means that the alarm doesn’t worry about any missing data points in its evaluation of whether to change state from OK to ALARM. In other words, any missing data isn’t considered critical.
You can also choose to treat the missing data points as being within the defined threshold; in this case, you would choose Not Breaching. Or you could choose to treat the missing data points as reaching the threshold, thereby choosing Breaching.
In our example, we chose Breaching; the assumption is going to be made that if data points are not being delivered to CloudWatch, there’s a problem with the EC2 instance; as a result, the missing data points are critical.
Actions
Actions define what is going to happen when a defined alarm fires; for EC2 instance metrics, we have several choices:
Send an SNS notification via email or text.
Choose an auto scaling action that would be appropriate if we were monitoring a cluster of instances. In this case, we would order additional instances to be added to the cluster, thereby reducing the CPU utilization.
Choose EC2 Action, also called Auto Recovery, which could recover, stop, terminate, or reboot the instance.
Monitoring EC2 Instances
EC2 instances send their basic monitoring metric data to CloudWatch every 5 minutes. You can view the CloudWatch basic metrics from the properties of an EC2 instance and select the Monitoring tab. Detailed monitoring must be enabled on an EC2 instance before you can increase the period to 1 minute. When an EC2 instance is ordered and launched using an AWS-supplied AMI, the CloudWatch agent is installed as a component of the AMI. Instances can use two levels of monitoring: basic, or detailed monitoring.
Basic monitoring includes 12 preselected metrics that report every 5 minutes and 3 status check metrics that report every 1 minute. Detailed monitoring, which is charged, increases the frequency of reporting of each metric to 1-minute intervals.
Automatically Reboot or Recover Instances
CloudWatch alarms can be created to help you automatically reboot or even recover an EC2 instance with no additional CloudWatch charges. The metrics StatusCheckFailed_Instances and StatusCheckFailed_System are provided for this feature, which is called EC2 Auto Recovery.
Reboot—This is for when instances have health check failures. An instance reboot is the same as an operating system reboot. The instance remains on the same physical host. The public DNS name, the private IP address, and data on any instance store volumes are retained. The metric used for rebooting instances as shown in Figure 5-15 is the StatusCheckFailed_Instance.
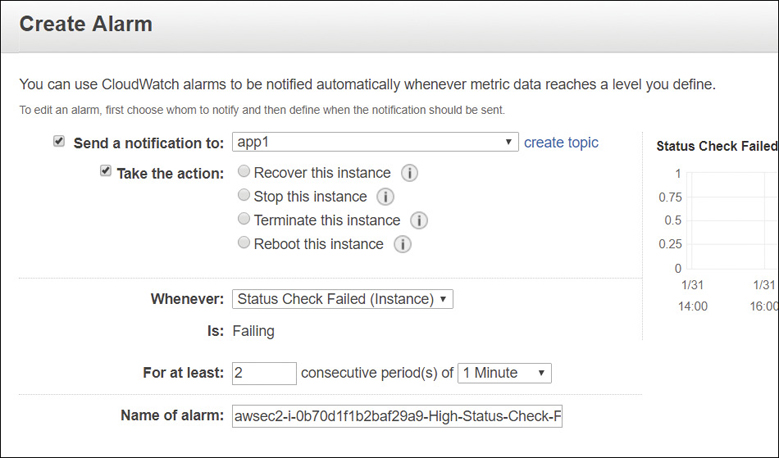
Recover—This is for system health check failures that can occur when a loss of network connectivity, system power failure, or hardware/software issues occur on the hosting server.
When the system status checks fail, they trigger the StatusCheckFailed_System metric alarm, starting the recovery action for the instance. The failing instance is migrated during the instance reboot to new hardware, and any persistent EBS storage volumes are reattached. Any public IP address is retained; however, any in-memory data contents are lost. Instance types (A1, C3, C4, C5, C5n, M3, M4, M5, M5a, R3, R4, R5, R5a, T2, T3, X1, and X1e) are supported that are hosted on default or dedicated tenancy. Instances must also be hosted in a VPC to use EC2 Auto Recovery.
Elastic Load Balancing Services
Load balancing is certainly not a new networking service; long before the cloud became popular, load balancing was used in data centers to balance network traffic across two servers. The load balancing could have been static, with defined paths, or it could have been dynamic based on the bandwidth utilization of the available paths.
Load balancing also provides a level of redundancy; if one server in the cluster of servers being load-balanced fails, the application or service is still available.
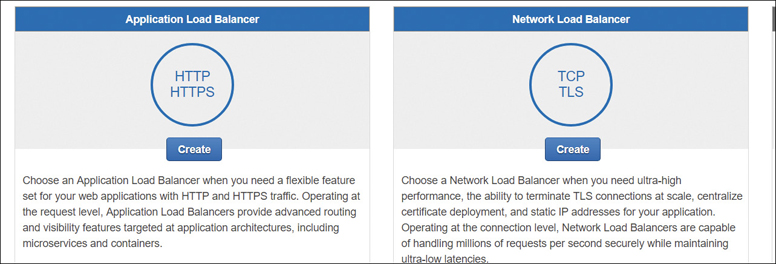
Operating in the AWS cloud, most AWS services are offered with a standard level of redundancy; in fact, the only service offered by AWS without built-in redundancy is the EC2 instance. Redundancy for your EC2 compute resources at AWS is accomplished by having additional instances or containers and placing these resources behind a load balancer. The load balancer that you choose to use could be from the trio of options provided by the ELB service, as shown in Figure 5-16. Or you could choose from a variety of third-party options, including but not limited to Nginx, Cisco, and Broadcom software appliances. Obviously, because this is a book on AWS, we are focused on AWS services, but many customers use third-party products.
Each load balancer ordered is assigned a traffic profile with a prescribed amount of throughput capacity. The ELB service monitors each online load balancer and scales the capacity required based on the incoming requests.
Each load balancer is charged a monthly fee plus a data transfer charge based on the number of load capacity units (LCUs) used every hour. The LCU is the hourly aggregate total of incoming traffic based on new and active connections, consumed bandwidth, and the number of listener rules that were evaluated. If your workload requires a massive amount of throughput capacity, you can ask Amazon to “prewarm” your load balancer to ensure the load balancer performance is there when required; you need to provide the start and end dates, the expected amount of traffic per second, and the total size of the requests/responses. AWS may tell you that the load balancer that you’ve ordered will be able to handle your expected traffic levels without prewarming, but it’s still a good idea to check if you are going to be hosting applications with massive traffic and scale possibilities at AWS. For most applications, the ELB service can and will scale as required.
The ELB service can distribute the incoming application requests to EC2 instances, containers, and IP addresses hosted in a single AZ or multiple AZs. Sending requests to IP addresses can be redirected to on-premise resources. Target groups define the resources that will be “targeted” by the load balancer listeners. Route 53, AWS’s domain name system (DNS) service, resolves the incoming client’s request using the DNS name of the load balancer, which is presented as standard address (A) record. However, because the load-balancing service is a redundant AWS service, Route 53 will use Alias records that contain multiple IP addresses’ entries, providing for regular and failover resolution to the requested load balancer.
All domains externally hosted outside of AWS need to update their A record to point to the AWS DNS name of the ELB. The load balancer is placed in front of your application servers and hosted in the public subnet, providing the only point of contact for all incoming application requests and protection for your applications; your Web and application servers can reside on private subnets with no direct access from the Internet.
AWS offers three options for load balancing: the Application Load Balancer (ALB), the Network Load Balancer (NLB), and the Classic Load Balancer (CLB). Each ELB option has its features; however, the CLB is only available due to its continued use by existing AWS customers. The ALB and NLB are the only two AWS choices to consider implementing; their feature sets cover the available options of the CLB, as shown in Table 5-1.
Table 5-1 ELB Choices and Features
Feature Set |
CLB |
ALB |
NLB |
|---|---|---|---|
Protocols |
TCP, SSL/TLS, HTTP, HTTPS |
HTTP, HTTPS |
TCP |
Networks |
Classic, VPC |
VPC |
VPC |
Health Checks |
X |
X |
X |
CloudWatch metrics |
X |
X |
X |
Logging |
X |
X |
X |
Connection draining |
X |
X |
X |
Zonal fail-over |
X |
X |
X |
Multiple port load balancing on EC2 instances |
|
X |
X |
WebSockets |
|
X |
X |
IP address targets |
|
X |
X |
Lambda as a target |
|
X |
|
Delete protection |
|
X |
X |
Path-based routing |
|
X |
|
Content-based routing |
|
|
|
Host-based routing |
|
X |
|
HTTP/2 |
|
X |
|
Define idle connection timeout |
X |
X |
|
AZ load balancing |
X |
X |
X |
SSL offload |
X |
X |
|
Sticky sessions |
X |
X |
|
Server Name Indication (SNI) |
|
|
|
Back-end server encryption |
X |
|
X |
Static IP |
|
|
X |
Elastic IP address (EIP) |
|
|
X |
Preserve Source IP |
|
|
X |
User authentication |
X |
|
|
Web application firewall (WAF) protection |
X |
|
|
Redundancy by Design
From the customer’s point of view, Amazon’s ELB service is really a micro-service; behind the scenes it’s actually a large redundantly hosted regional service that can scale on demand; as your load balancer handles more requests in the background, the ELB service scales up to meet the demand. We order a “micro-piece” of the ELB service; we don’t need to know the inner workings other than that it does its job of load balancing.
ELB can be a key component in your overall application design stack to ensure a highly available and redundant application. If the load-balancing components that ELB assigns to you fail, you are automatically failed over to another load balancer within the massive regional server farm that makes up ELB. Remember: Route 53 alias records are designed to be able to point to multiple ELB resources, ensuring a seamless transition when problems occur.
If you choose to use a third-party load-balancing appliance, you have to design for redundancy and failover by deploying your load balancer in a high availability (HA) pair of load balancers. You also have to monitor for failures and carry out a much higher level of proactive administration when compared to using EBS resources. However, the third-party resource might be a better fit for your organization due to its feature set and your level of experience with the device.
EC2 Health Checks
Certainly, one of the most useful features of all ELB load balancer options is the EC2 instance health check, as shown in Figure 5-17. There’s no point in sending user requests to instances that are not available when needed; health checks can be defined to ensure both instances and containers are responding in a timely fashion to the health check requests from the load balancer.
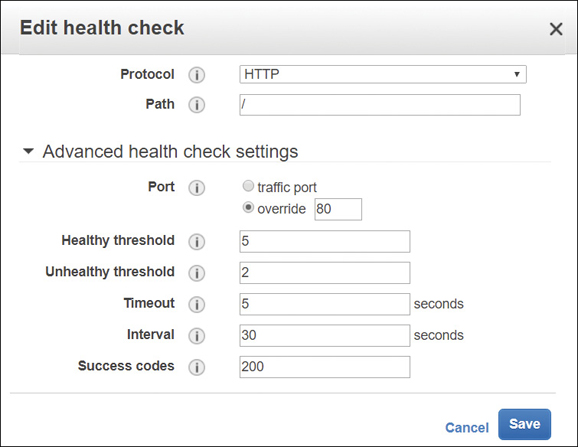
Each load balancer performs health checks at a specific interval to all registered instances. If the instance’s response exceeds what’s defined as the healthy threshold for consecutive responses, the instance is considered unhealthy and is taken out of service. Note that the load balancer is going to wait for the entire time period defined by the Timeout setting; if this setting is defined at 2 minutes plus 3 retries before the unhealthy threshold is reached, 6 minutes in total will pass before the instance is marked as unhealthy. If the instance responds within the defined response timeout period, the load balancer marks the instance as in-service, and incoming user requests are again routed to the healthy instance.
Note
Route 53, AWS’s DNS service, can also perform health checks at the regional level against the load balancer within each AZ. Therefore, ELB health-checks on your Web and application tiers, with both tiers fronted by a load balancer. Route 53 health-checks on the load balancers fronting your Web and application tiers.
Additional ELB Features
Each AWS load balancer has specific features due to its design goals. There are three load-balancing choices. We are going to discuss the two relevant models: the ALB and the NLB. The ALB has more security features than the NLB because it typically routes public traffic coming across the Internet. Additional features of the ELB service to consider are listed next.
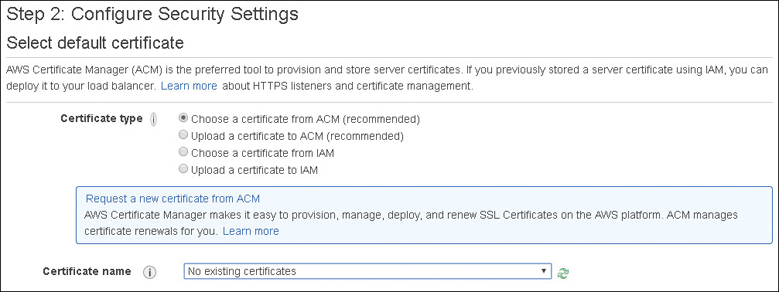
SSL/TLS Traffic Decryption—The ALB supports SSL offload, performing SSL/TLS decryption on the incoming connection request, which terminates the SSL traffic on the load balancer before sending the decrypted requests to the application. Certificate management integration is also provided with the AWS Certificate Manager, as shown in Figure 5-18.
The ALB also supports an identification process called server name indication (SNI), which lets the ALB use more than one certificate per ALB. This allows you to use multiple websites with separate domains behind the same ALB. SNI allows the assigning of the correct secure sockets layer/transport layer security (SSL/TLS) certificate to the associated server allowing the ALB to send the website or domain’s public key to the end user to establish a secure connection with the load balancer. ALB supports the classic RSA, the industry standard in asymmetric keys, and the newer Elliptic Curve Digital Signature Algorithm (ECDSA), which is defined as elliptic curve cryptography. Both of these certificate options can be currently used for faster authentication purposes. However, most SSL/TLS certificates are still being signed with RSA keys. However, the newer ECDSA standard has a couple of features that make it appealing for mobile communications. First, a 256-bit elliptic curve key provides the same amount of protection as a 3,248-bit symmetric key. Second, a smaller number of keys requires less back-and-forth communication and therefore less bandwidth for mobile applications to securely authenticate using ECDSA keys. Tests have shown that when ECDSA is compared to Rivest–Shamir–Adleman (RSA) in regard to the TLS handshake, ECDSA communication is 9 times faster. ECDSA was popularized due to its use by Bitcoin. It is also used by Apple’s iOS and iMessage. ECDSA may be something to consider for mobile applications hosted behind an ALB.
Note
Up to 25 certificates can be attached per ALB.
IPv4 or v6 support—The IP address type for your Internet-facing load balancer supports both IPv4 and IPv6 addresses; internal load balancers must use IPv4 addresses.
Routing—Using the ALB, content-based, path-based, and host-based routing are supported, allowing connection requests to individual services contained within a domain or container based on the type of the request. Routing to multiple domains hosted in multiple target groups is supported based on the host field or URL path of the HTTP header.
Dynamic port mapping—The ALB supports load balancing containers running the same service on the same EC2 instance where the containers are hosted. When your ECS task definition is launched multiple times on the same EC2 container instance, the containers are running the same service but are individually accessible because the dynamic port mapping process assigns a random port to each container task. Within the target group, the targets for each service will have different dynamically assigned ports. Dynamic port mapping is not supported on the CLB.
Note
ELB load-balancing options integrate with EC2 instances, EC2 auto scaling, Certificate Manager, CloudWatch, Route 53, and, if you’re using the ALB, you can also add a web application firewall (WAF) ACL for additional protection.
Connection draining—Once an EC2 instance that is registered with a load balancer is tagged as unhealthy by failing its health checks, the connections to the instance are closed through a process called connection draining. Connection draining from the point of view of the load balancer keeps existing connections open until the client closes them but prevents new requests from being sent to the instances that are tagged as unhealthy.
Connection draining is also a handy administrative option to remove instances from a load balancer target group when maintenance is required; for example, it’s time to update a healthy instance with a new version of itself. Performing the deregistration process on an instance as shown in Figure 5-19 starts the connection draining process keeping the existing connections open, providing enough time to complete all ongoing requests. An instance that is in the process of deregistering will not accept new connection requests.

Cross AZ support—Load balancers distribute the incoming traffic requests evenly across the associated AZs. If one AZ has six instances, and the other AZ has four instances, the load is still distributed evenly across the AZs. Best practice is to use the same number of instances in each AZ. You are charged for data transfers between AZs when cross-zone load balancing is enabled.
User authentication—The ALB allows you to offload the authentication process so it can authenticate users as they request access to cloud applications. The ALB can integrate with AWS Cognito, which allows both Web-based and enterprise identity providers to authenticate.
Application Load Balancer (ALB)
The ALB is one of the load balancer choices from the ELB service for application-specific features that work at Layer 7 of the OSI model. However, it’s not comparable with third-party “application load balancers” offered by F5, Cisco, and Nginx that are more correctly called application delivery controllers (ADC). The ADC offers many advanced applications services, such as compression, SSL offload, caching, and traffic shaping. Amazon’s ALB offers none of these features except for SSL offload. The AWS ALB is designed for the load balancing of containers, instances, and private IP addresses using target groups.
A target group is the destination where the listener sends incoming requests. Targets include instances, containers, and IP addresses. A target can also be registered with multiple targets, as shown in Figure 5-20. Target groups are defined by target type; instance (defined by instance ID), IP (defined by private IP addresses), and Lambda (defined by a specific Lambda function). Targeted IP addresses can include instances using any private IP address from any network interface in a VPC or peered VPC, RDS databases, or on-premise resources that are reachable through a Direct Connect or VPN connection. Instance IDs defined by a target group use their primary private IP address communication.
Auto scaling uses target groups with defined instance IDs. Each EC2 instance or IP addresses can be associated with the same target by using different ports; the ALB uses this feature to route requests to specific micro services posted on the same EC2 instance. Lambda functions can also be targeted and invoked by an incoming load balancer traffic request.
Big-Picture Steps: ALB Creation
Choose the load balancer type to install: internal or external.
Our first step is to choose what type of load balancer to create. Next, select the scheme: whether the load balancer is accepting public inbound traffic or private inbound traffic. Select the IP address type—IPv4 or IPv6—as shown in Figure 5-21.
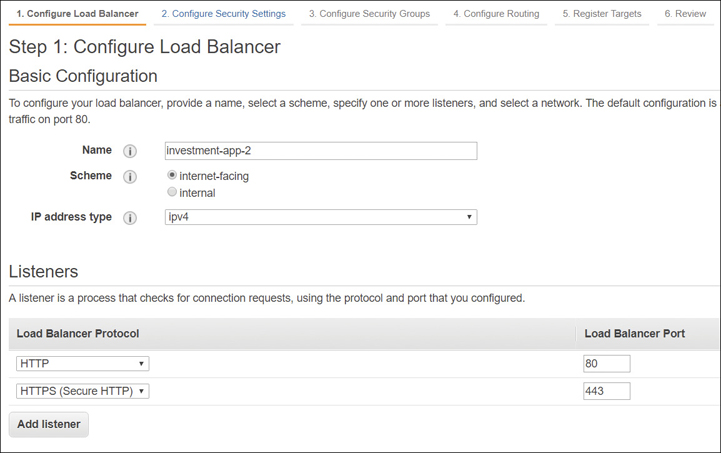
Figure 5-21 Initial configuration of ALB Configure the VPC, two availability zones, and two subnets.
We also need to select the VPC and the subnets that the load balancer will be fronting. If it is a public-facing load balancer, it will be hosted in a public subnet. This provides protection for your instances or containers, which can be hosted on a private subnet or subnets and be directly targeted by the load balancer. Subnets from at least two AZs must be selected for availability, as shown in Figure 5-22.
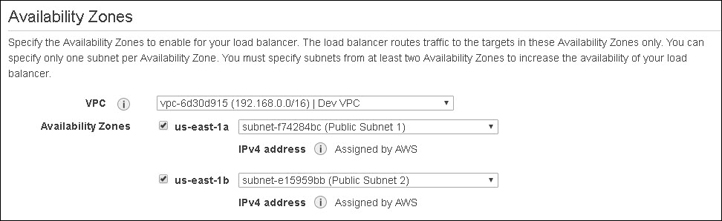
Figure 5-22 AZs and subnets must be chosen Choose a listener.
Load balancers communicate using a process called a listener, which continually checks for any incoming requests based on the defined protocol and port that you have configured. Listeners follow rules that determine which target group the incoming connection requests are sent to. The two popular standards are port 80 and port 443; however, you can choose any Transmission Control Protocol (TCP) port you want. The default port is HTTP port 80.
Each listener monitors all incoming connect requests based on Hypertext Transfer Protocol (HTTP; port 80) and Hypertext Transfer Protocol Secure (HTTPS; port 443) termination between the load balancer and the client. An X.509 certificate must be deployed on either the CLB or the ALB that is using encrypted connections. The AWS Certificate Manager integrates fully with the ELB service, allowing you to easily deploy security certificates on your load balancer.
Rules can be defined for each listener, defining how user requests are routed to the back-end target groups. Additional listeners can be created only after the initial listener has been configured and the load balancer has been launched successfully. Additional listeners can be added, selecting the load balancer after creation and selecting the Listeners tab. You can select existing listeners and view and modify the rules.
If you’re using a listener on port 443, you need to upload your certificate to the load balancer. It’s a good idea to first upload your website or domain certificate using the AWS Certificate Manager and then select it while creating the load balancer. You also need to select the security policy that is applied to the front-end connections; uploading a custom security policy is not allowed. Amazon recommends using the latest available policy, which is the most up-to-date security policy listed. The latest security policy is always applied to the back-end connections. Each request accepted by the listener uses two connections:
Front-end connection between the client and the load balancer
Back-end connection between the load balancer and the associated target
When either front-end or back-end connections are not idle and are not processing data for 60 seconds, the connections close for obvious security reasons. Depending on the type of connection, you may want to leave the connections open for a longer time period. Connection options can be set at the Web server and on the load balancer by editing the attributes of the load balancer.
Create Rules.
Each listener has a default rule. Default rules are simple because they cannot have additional conditions. Therefore, the default rule for HTTP: Port 80 has one action: forward traffic to the defined targets, as shown in Figure 5-23.
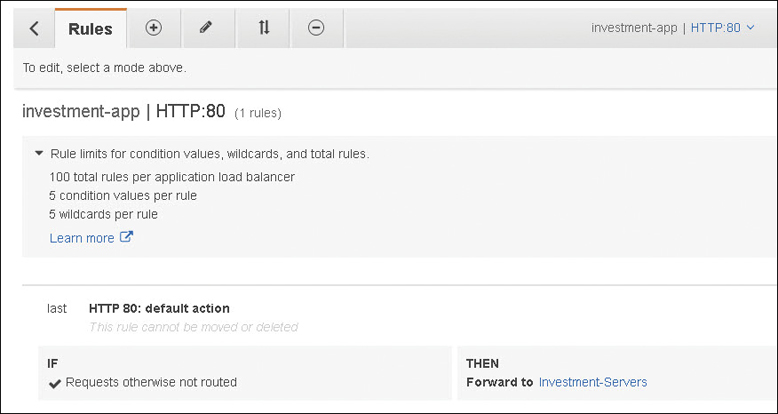
Figure 5-23 Default ALB rule for forwarding traffic
Rule Choices
Rules are precise actions to be carried out by the listener the rules are assigned to. The actions that can be carried out using rules follow:
forward—Send requests to the named target group.
redirect—Redirect the request from one URL to another. Usable components include the protocol (HTTP to HTTP, HTTP to HTTPS, and HTTPS to HTTPS), hostname, port, or path.
authenticate-cognito—AWS Cognito is used to authenticate users, as shown in Figure 5-24. After creating a Cognito user pool, you must create a user pool app client that supports using an AWS ELB authentication session cookie to be authenticated by the load balancer and whitelist to call back URLs for the DNS domain name of the load balancer and the canonical name (CNAME) of your application.
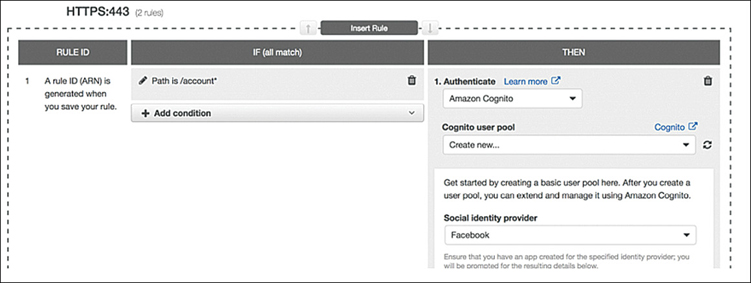
Figure 5-24 Rules can set authentication options for ALB authenticate-oidc—OpenID Connect authentication.
fixed-response—Send a custom HTTP response to the end user.
Note
Rule conditions can also be defined. Each rule can have one host condition or one path condition. Rule actions are carried out only if the conditions are met.
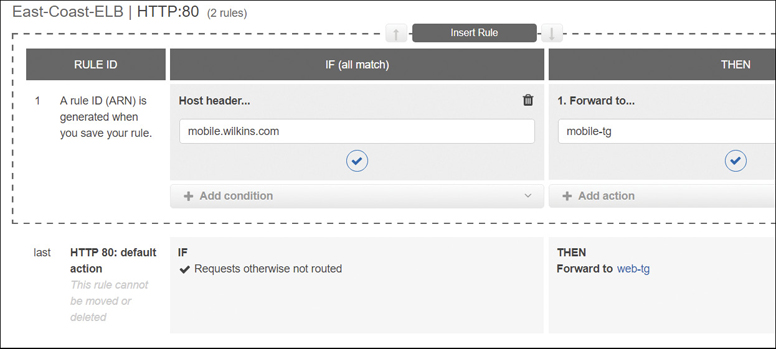
Host-based routing—This routing option forwards requests to a target group based on the domain name contained in the host header. When the hostname in the host header matches the hostname in the listener rule, the request is routed. Wildcard characters can be used in the first part of the hostname, but not in the name after the period (*name*.com).
For example, requests to a.example.com could be sent to one target group, and requests to b.example.com could be sent to another target group. Rules can be created that combine path and host-based routing allowing you to route requests to a specific path such as /productiondocs, as shown in Figure 5-25. Up to 75 rules can be applied per ALB.

Path-based routing—If the path in the URL matches the path pattern defined in the listeners rule, the request is routed. Instead of just the root domain being able to be used as the path to send requests, endpoints can be defined at the ALB directing the traffic requests, as shown in Figure 5-26.
Both path- and host-based routing allow you to control the compute environment where the requests are being directed. Certain requests such as API calls may be processed on a compute-optimized instance target group; other requests can be directed to memory-optimized instances in another target group.
HTTPS Listener Security Settings
There are several security settings that must be defined during the installation of the ALB for the HTTPS listener:
As previously mentioned in ELB features, a security group must be attached to allow communication to the registered targets. The load balancer communicates with the resources in each target group and carries out health checks on the resources to ensure their availability. The security group must be assigned that allows both inbound and outbound traffic for the listeners and health checks in both directions, from the resources in the target group to the load balancer.
The ALB uses an X.509 certificate (SSL/TLS), and each certificate is associated with the domain name. As shown in Figure 5-27, you can choose a certificate that has been preloaded to the Certificate Manager. Optionally, if Certificate Manager is not supported in your region, you can use the AWS command-line interface (CLI) to upload your security certificate to IAM.
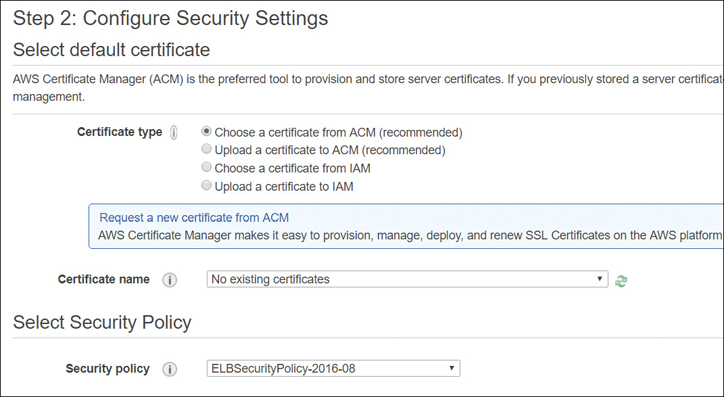
Figure 5-27 Choose security certificate for ALB The security policy for front-end connections for the HTTPS listener can be chosen; AWS recommends that you select the most current policy available, which is always used on the back-end connections. Custom policies cannot be deployed on an ALB.
Note
Certificates uploaded to the ALB from Certificate Manager are automatically renewed by the Certificate Manager service.
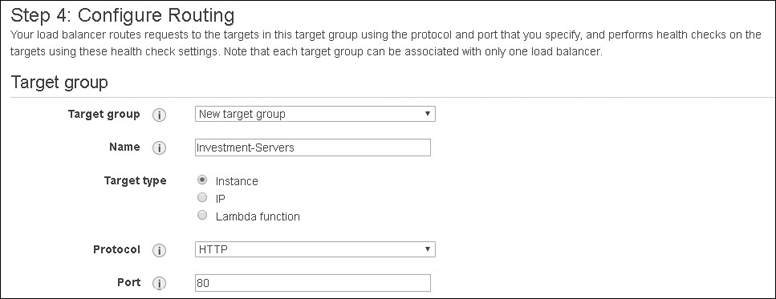
Target Group Routing
Now that we have selected our listeners and our certificate and defined our security group, it’s time to target the resources that the load balancer will route traffic to. The protocols supported by target groups are HTTP and HTTPS, and optionally any TCP port number from 1 through 65535. Your configuration may use a single listener listening for HTTP traffic on port 80, yet have several target groups with different routing connections defined by the assigned rules to the listener. We have three choices per target group:
Instance—Instances are always defined by the instance ID; traffic is always using the private primary private IP address on the primary network interface.
IP—IP addresses are private IP addresses that can be defined on any network interface.
Lambda—This is a single targeted Lambda function.
Targets (instance or private IP address) are registered in target groups located in an AZ. At least one registered target must be in each target group.
As soon as the target has finished registering and has passed its health checks, the load balancer can start routing user requests to the target. When a target is deregistered, the load balancer waits until any requests that are in process are completed.
Target Group Attributes
Each instance or IP target group’s operation can be controlled by several attributes, as shown in Table 5-2.
Table 5-2 Target Group Attributes Can Be Used for Instance or IP Targets
Attribute |
Details |
|---|---|
deregistration_delay_timeout_seconds |
How much time before a target (instance or IP) is deregistered; default is 300 seconds. |
slow_start.duration_seconds |
The time a new target (instance or IP) is sent a gradually increasing number of connection requests; up to 15 minutes. No default setting. |
stickiness.enabled |
Enabled or disabled. |
stickiness.lb_cookie.duration_seconds |
Cookie expiration in seconds; default is one day. |
stickness.type |
Must be set to lb_cookie. |
Maintaining User Sessions
If a load balancer is presenting an application that is merely providing generic information, then maintaining a specific user session may not be required. However, for applications where the user is interfacing with an initial server, maintaining the same session between the end user and the back-end server is important. If you are buying something online, you expect your session to begin and end properly without problems.
Because the ALB is between the user and the back-end application server, and SSL offload is being performed by the ALB, the back-end server won’t know the IP address protocol and the port used between the front-end connection from the user to the load balancer. The ALB uses specific X-forwarded headers to pass client connection information to the back-end servers for front-end connection using HTTPS and HTTP/2 connections.
X-Forwarded-For—This request header allows forwarding of the client’s IP address to the back-end servers in the form X-forwarded-For: client-ip-address.
X-Forwarded-Proto—This request header allows back-end servers to identify the HTTP or HTTPS protocol that a client used when connecting to the load balancer in the form X-forwarded-Proto: originatingProtocol. The protocol passed to the back-end server allows the application or website to redirect the user request to the desired URL.
X-Forwarded-Port—This request header allows back-end servers to identify the port that the client used to connect to the load balancer.
Sticky Session Support
ELB also supports sticky sessions, which allow the load balancer to bind the user’s active session to a specific instance, ensuring that all users’ requests are sent to the initial instance the session was started on. With sticky sessions enabled on a load balancer, after a request is routed to a target, a cookie is generated by the load balancer and returned to the client. All requests from the client from this point forward include the cookie; the information contained in the cookie ensures that the request is routed by the load balancer to the same back-end server. The enabling of sticky sessions and the parameters for the stickiness of the cookie are defined by editing the target group attributes, as shown in Figure 5-28.

What happens when the back-end server that the user is connected to fails and is no longer available? The load balancer automatically chooses a new healthy instance and moves the user to the new instance for the remainder of the session, even if the old instance comes back. This does not mean the new instance knows anything about the user; sticky sessions are useful when everything works, but they’re not so useful when things break.
If you don’t use sticky sessions and choose to replicate the user session information to all other servers in the cluster using session replication, a busy application cluster with lots of user requests might be flooded with too much user information to keep track of.
Rather than using sticky sessions, you could consider using a central storage location for user session information, using a DynamoDB table or a hosted ElastiCache Redis cluster or Memcached nodes. This adds complexity, but for massive user sessions, it may be the best option.
Configuring Health Checks
Health checks can be configured for each target group against the registered targets. There are several settings to understand when creating health checks, as listed in Figure Table 5-3. As discussed earlier in this chapter, health checks ensure your resource is available and ready to accept user requests. Depending on the ongoing results of health checks, a registered target is typically defined as healthy or unhealthy.
A newly added target to the target group is defined as initial; once its health check is successful, the target is defined as healthy. When the target is being removed and connection draining is underway, the target is marked as draining.
Table 5-3 Health Check Settings
Health Check Setting |
Details |
|---|---|
Health Check Protocol |
HTTP or HTTPS can be used. |
Health Check Port |
The port used for performing health checks on targets. The default is the communications protocol port, 80, or 443 |
Health Check Path |
The destination ping path on the target. Default is /. |
Health Check Timeout Seconds |
No response from the target in the listed timeout (2–60 seconds) is a failed health check. |
Health Check Interval Seconds |
The time between each health check (5–300 seconds). |
Healthy Threshold Count |
Consecutive health checks required from an unhealthy target before the target is considered healthy. |
Unhealthy Threshold Account |
Consecutive failed health checks resulting in an unhealthy target. |
Matcher |
Successful HTTP code from a healthy target (200–499). |
Terra Firma can use health checks to ensure that resources placed behind load balancers are available as required. EC2 auto scaling can also take advantage of ELB health checks when applications are automatically scaled using auto scale groups. You’ll read more about EC2 Auto Scaling in a few pages.
Monitoring Load Balancer Operation
There are several AWS services available for monitoring your ALB or NLB operations, including CloudWatch, and access logs that can be enabled for each load balancer.
CloudWatch—ELB metrics can be used to monitor and ensure your system is performing as you expected. Only when your load balancer is responding to user requests will metrics be reported to CloudWatch for analysis. Table 5-4 lists several metrics that provide operating details based on the sum of the totals.
Table 5-4 CloudWatch Metrics for ELB
ELB Metric |
Details |
|---|---|
ActiveConnectionCount |
Concurrent TCP front-end and back-end connections |
ConsumedLCUs |
Number of load balancer capacity units used |
NewConnectionCount |
Total number of TCP connections from clients to load balancer to targets |
ProcessedBytes |
Total number of bytes processed by the load balancer |
RequestCount |
Number of requests processed with responses from a target |
HealthyHostCount |
Number of targets that are healthy |
UnhealthyHostCount |
Number of targets that are unhealthy |
RequestCountPerTarget |
Average number of requests received by each target in a group |
Access logs—You can also choose to enable access logs, which provide detailed information about all requests sent to your load balancer. Once enabled, ELB captures the logging detail and stores it in the desired S3 bucket. Additional security can be provided by enabling server-side encryption on the bucket to encrypt each access log file. Choosing S3-managed encryption keys (SSE-S3) ensures each log file is encrypted with a unique AWS managed key that has multifactor authentication enabled, and automatic key rotation carried out by default.
Log files are published every 5 minutes. Log details include the type of request or connection (HTTP, HTTPS, http2, WebSockets, WebSockets over SSL/TLS) and the timestamp, client port, and target port, request and target processing time, and sent and received bytes. All the details provided by CloudWatch logging can be provided by access logs for a fraction of the cost of CloudWatch metrics.
Network Load Balancer
A Network Load Balancer (NLB) is designed for supporting private resources using the TCP protocol and port number at the fourth layer of the OSI stack. Listeners, target groups, health checks, and most of the features are similar but not exactly the same as an ALB because the NLB is designed for private access. You could use it as an Internet-facing load balancer; however, the NLB doesn’t support SSL offload, HTTPS, and cannot be protected by the WAF. In addition, security groups are not available with a NLB—you have to rely on the instance’s security groups for controlling access. Container support is also much more advanced using the ALB with path and host-based routing.
One of the primary reasons for NLBs at AWS is the support of VPC Endpoint Services, also called AWS PrivateLink, which use NLBs in front of private application stacks hosted in VPCs. Additional details on AWS PrivateLink can be found in Chapter 3, “AWS Networking Services,” and by watching the companion video on NLB setup.
Scaling Applications
Terra Firma has a Web application designed and operating on EC2 instances; in fact, it has followed best practices and has the application load spread across multiple AZs on multiple instances. The application works just fine, with adequate speed for 2,000 users. But last week the application was made available to a few additional users, and the application response started to slow down. That’s when the developers decided to add some additional instances, and everyone was happy once again.
This manual solution does work, but it’s not ideal. Manual analysis of the existing EC2 instances, or waiting for complaints from the application users, is not proactive. The application in question is going to have many more users in the future, so why not just add a few more instances into the mix? Users won’t complain. However, there’s a new issue now: cost. If more compute instances are running 24/7, the cost of hosting the application has also increased.
Amazon had this exact problem in its early days of running the Amazon.com website. Running excessive compute capacity was expensive. This problem was solved with EC2 Auto Scaling.
EC2 Auto Scaling
At the start of this chapter, we talked about the three AWS services I called the gang of three: CloudWatch, ELB, and EC2 auto scaling. Together, these services make sure that you have enough compute power for your applications that are running in the AWS cloud.
If your applications hosted in your on-premise data centers can’t scale, auto scaling may offer a solution. It’s likely that you have a private cloud hosted on-premise in your own data centers. Scale in this case is probably constrained by the number of bare-metal servers that you have, perhaps space, and the other available resources such as load balancing. At AWS in a typical Amazon data center, there are typically between 50,000 and 80,000 bare-metal servers. They simply have more resources. AWS uses monitoring, load balancing, and auto scale to run most of its managed services.
At AWS, we can vertically scale instances that are running any application, including database instances; however, vertical scaling is a manual task. Even if you automate the vertical scaling command, there will be downtime because the compute instance will be offline during reconfiguration.
In a nutshell, EC2 Auto Scaling makes sure that the compute power required by your application is always available. EC2 instances are grouped together in what is called an Auto Scaling group (ASG). Once you define the minimum number of instances for each ASG, auto scaling ensures that the minimum defined instance number is always available. You can also define a maximum number of instances in the ASG; auto scaling manages the maximum number as well. Perhaps you want to maintain a desired capacity of compute instances; that’s also an available option. Desired capacity was defining the number of EC2 instances that are started when auto scaling is first launched. If you defined a desired capacity of 2 instances, then 2 instances will be maintained by Auto Scale. The desired compute capacity can also be scaled out or in based on CloudWatch alarm triggers, which can order a change in the number of instances plus or minus. If a desired capacity value is entered, the desired capacity is maintained.
You may already have a cluster of servers targeted behind a load balancer. You can think of this initial number of instances as your desired state. Adding auto scale to this design allows you to scale out or scale in your overall compute power based on CloudWatch alarms.
You can also use auto scaling without a load balancer if you want to maintain a desired state of compute power. In this case, minimum and maximum values are not needed.
Finally, you can choose to add a bit of automation into the mix using the other two services we’ve talked about in this chapter: CloudWatch and ELB.
Besides the EC2 auto scaling benefit of maintaining the right amount of compute capacity, there are other benefits to consider:
Cost management—EC2 auto scaling helps to save money; if your application has just the right amount of capacity—not too much and not too little—then you’re not wasting compute power that you’re not utilizing. Automating your capacity saves you a lot of money.
Fault tolerance—EC2 auto scaling integrates with AWS load balancing services (ELB) and AZs. Auto scaling makes the load balancer’s job easier because the resources available in each AZ can be scaled up and down based on demand.
Health checks—EC2 auto scaling can detect when instances are unhealthy. You may remember that the load-balancing service could also do health checks on targets in target groups. Auto scaling can not only detect unhealthy instances but remove and replace the instance that’s unhealthy with a new instance.
EC2 Auto Scaling Components
EC2 auto scaling works with three main components: a launch template, also called a launch configuration; ASGs; and a defined scaling policy.
Launch Configuration
The launch configuration is a template used by the ASG to launch EC2 instances. Creating a launch configuration is like the steps you would take when manually launching an EC2 instance from the management console. The launch configuration is prestaging the EC2 that will be built by the ASG. Each launch configuration matches up against one ASG at a time. The template includes numerous system components, including the instance ID of the AMI, the instance type to build, the key pair for authentication, desired security groups, and a block storage device. Launch configurations have been superseded by the launch template, which has many additional settings that can be used by an ASG when deploying instances.
Launch Templates
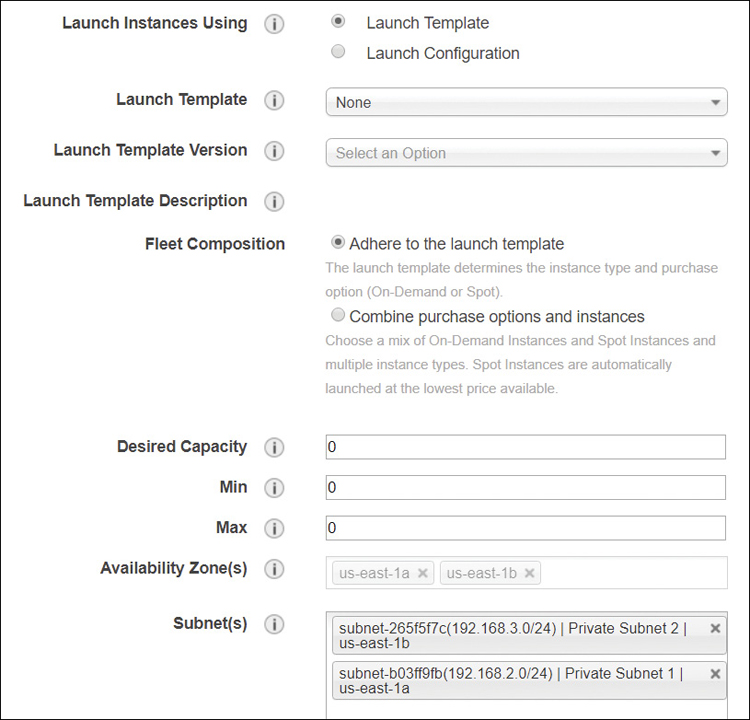
A launch template is similar to a launch configuration, with the added feature of versioning. A default launch template can be created as a source template; then other versions of the template can be created and saved. AWS recommends that you use launch templates rather than launch configurations and specify specific tags or additional core information that your company wants to embed in each launch configuration, such as AZs and subnets, as shown in Figure 5-29.
Auto Scaling Groups (ASGs)
An Auto Scaling group (ASG) is built from a collection of EC2 instances that have been generated from the associated launch configuration or launch template. Each ASG launches instances following the parameters of the launch template to meet the defined scaling policy. There is some overlap between some of the settings that can be defined in an ASG and a launch configuration template. Network settings, including AZs, and subnets can also be defined in an ASG, as shown in Figure 5-30.

Scaling policies can also be attached to ASGs to help dynamically increase or decrease the number of EC2 instances. You can also choose to manually override the defined settings of an ASG and scale the number of instances up or down as necessary.
The instance types that can be added to an ASG include on-demand, spot, or reserved instances across multiple AZs. You can also define the percentage of on-demand and spot instances’ capacity for additional cost savings. If you manually select and configure an EC2 instance during the creation of the ASG, AWS creates a launch template based on your manual choices.
ASGs can be associated with an existing load balancer, which then routes traffic to the ASG instances. EC2 auto scaling supports both the Classic, Application, and Network Load Balancers.
ASGs perform health checks on instances added to an ASG; we also know that load balancers can perform health checks on instances in target groups. Auto Scale health checks are checking availability of the instance using the EC2 status check. If instances added to an ASG fail their status checks after boot, they are considered unhealthy, terminated, and re-added to the ASG. Load balancer health checks are a little more complicated when carrying out their health checks, as we have discussed; therefore, ASGs can be configured to also use ELB health checks. This combination of health checks provides the added benefit of performing health based on the status check and on the load balancers’ health check tests. If either of the health checks fails, the instances are terminated.
Note
If your ASG is not associated with a load balancer, the ASG health checks are used.
Scaling Options for Auto Scaling Groups
Manual scaling—You can make manual changes to your ASGs at any time by changing the maximum, minimum, or desired state values to start capacity changes.
Maintain current instance levels—Set the desired capacity and health checks to determine the health and automatically replace any instances that are determined to be unhealthy by the auto scaling health check or the load-balancing health check, whichever is selected.
Target tracking—Increase and decrease the ASG based on a metric, as shown in Figure 5-31, to maintain a target value across all instances. You can select several metrics, such as CPUUtilization to support target tracking. Setting CPUUtilization to 60% results in instances being added or removed to maintain the desired CPU utilization. Slightly more instances are typically added than necessary when maintaining the desired CPU utilization because the math behind the scaling calculations plays it safe by rounding up the number of instances to add or remove.
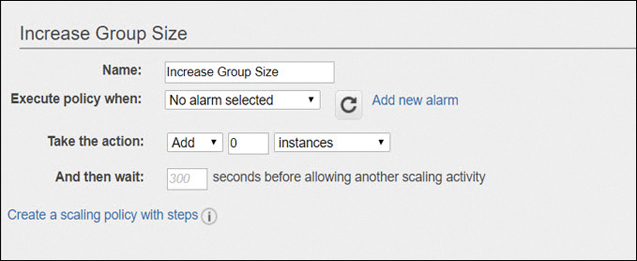
Simple scaling policies are also bound to a cooldown period; in other words, let’s not rush it. Here’s an example of where a cooldown period could be useful. Terra Firma has a three-tier application running in test mode on AWS consisting of Web servers, application servers, and the RSA database tier. Separate ASGs are created for the Web tier and for the application tier. Each tier uses CloudWatch alarms to scale out whenever the CPUutilization for each tier exceeds 70 percent. The firing of the alarm instructs the ASG to launch and configure an additional instance.
Each instance uses a User Data script to help install and set up the instance, installing software and updates, before the instance is ready to be placed into service. These additional tasks take time, usually 4–5 minutes. After all, it’s the cloud. Sometimes update and build tasks take a little longer than usual.
While the new instance is being readied and an unexpected increase in CPUutilization occurs, the CloudWatch alarm fires once again, ordering the ASG to launch another instance.
Because a cooldown period is in force, after the ASG launches an instance on request, any further scaling requests are ignored until the cooldown period finishes. The default cooldown is 300 seconds, but this can be changed when you create the ASG. The cooldown period is either a cooldown during scaling out or a cooldown period before termination.
Note
Amazon recommends that metrics used for target tracking should be set for a 1-minute frequency to ensure a faster response time. Detailed monitoring must be enabled to utilize 1-minute intervals.
Scale based on a schedule—Scaling can also be defined by time and date values, which instructs auto scaling to scale up or down at a specific time. The start time, minimum, maximum, and desired sizes can be set for recurring actions. The issue with scheduled scaling is that there is still compute waste. It’s much better to enable scaling on-demand, and it’s not hard to set up.
Scale on demand policy—Demand scaling allows users custom metrics that will determine the scaling out and in of your defined fleet of EC2 instances. Multiple policies can be attached to an ASG that can both control the scaling out and in. Multiple scaling policies can provide scaling control. For example, a scaling policy might react to the CloudWatch metric Network Utilization and scale out when network traffic is greater than (>) a certain percentage. Or a scaling policy could measure the depth of messages in an SQS queue and scale out when the number of messages is over a certain value. Both simple scaling and step scaling support the following parameters for scaling instances:
ChangeInCapacity—Increase or decrease the capacity of the ASG by the defined number of instances.
ExactCapacity—This value defines the capacity of the ASG to the defined number. For example, if the current capacity is four instances and an adjustment to the ASG is three instances, the capacity is set to seven instances.
PercentChangeInCapacity—This changes to the capacity of the ASG by either a positive or a negative percentage value.
Step Autoscaling Policy—Using steps is the most advanced option because it allows you to have multiple policies for scaling out and in. Step scaling allows you to define a lower and upper boundary for the metric being used and to define the amount by which to scale in or scale out the instances, as shown in Figure 5-32, with incremental steps in or out.
A first instance is added when CPU utilization is between 40% and 50%.
The next step adds two instances when CPU utilization is between 50% and 70%.
In the third step, three instances are added when CPU utilization is between 70% and 90%.
When CPU utilization is greater than 90%, add a further four instances.
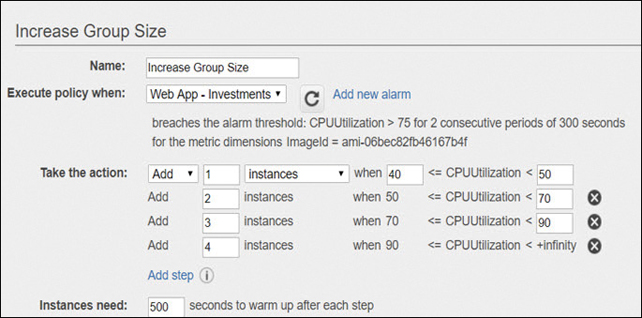
Figure 5-32 Step scaling parameters
The step policy also defines the warm-up period, which is defining the amount of time required before the instance is running and ready to go. Keep in mind: instances may need to apply updates, finish configuration, and pass health checks. Only after a successful warmer is the next step in the policy applied. The same steps in reverse can be designed to scale back in.
Lifecycle Hooks
Custom actions can be created and carried out on instances that an ASG launches or terminates. The instance is placed into a wait state and held from becoming registered in the ASG or from being terminated for one hour. While being held in the wait state, custom actions can be performed on the instance. Think of the wait state as an opportunity to perform any task you want on the instance before it is added or removed from the ASG. The maximum amount of time an instance can be frozen is up to 48 hours. During the wait time, the following custom actions are allowed:
Call a Lambda function to perform a specific task.
Send a message to a defined SNS notification.
Execute a script as the instance starts and remains in the defined wait state.
You can add a lifecycle hook to an ASG using AWS CLI commands populating the User data location in a launch template, as shown here:
aws autoscaling put-lifecycle-hook --lifecycle-hook-name <lifecycle code> --auto-
scaling-group-name <ASG here > --lifecycle-transition autoscaling:EC2_INSTANCE_
LAUNCHING
AWS Auto Scaling
You now know about EC2 auto scaling, but there’s another scaling option in the console called AWS Auto Scaling. What’s the difference? This version is a management tool for scaling across application stacks using the familiar ELB service for load-balanced distribution of EC2 compute instances (see Figure 5-33).
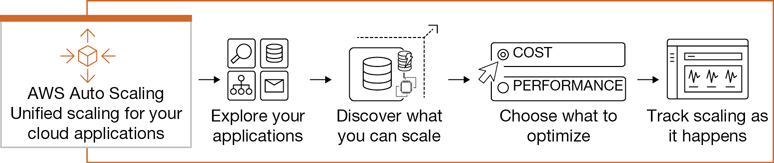
AWS Auto Scaling supports the ECS and database solutions that utilize DynamoDB and Aurora. Currently, the following services can be managed with AWS Auto Scaling:
EC2 ASGs
EC2 Spot Fleets
ECS
DynamoDB throughput table (read-write) capacity
Aurora replicas for Amazon Aurora
AWS Auto Scaling uses a feature called predictive scaling, which uses machine learning models to analyze the applications, and traffic pattern history to forecast potential changes in the future. Predictive scaling currently only works with EC2 instances. After two weeks of analysis, it begins to forecast future traffic patterns for the next 48 hours of application operation.
In Conclusion
One of the advantages of using public cloud services is that the setup and operations—including monitoring—are heavily automated. Our goal is to get to the same level of automation for applications that are hosted in the cloud. If you can set aside the need to fully understand how AWS load balancing works and focus on the service’s stability and availability, then it’s possible that using load balancing, auto scaling, and built-in monitoring services provided by AWS can save you a great deal of time and money.
I don’t think there’s any debate left about the fact of wanting and needing scale for our hosted cloud applications. Using the AWS gang of three essential services (ELB, CW, and AS) means you need to select an application ready to be moved to the cloud and begin testing with the goal of creating a stateless and automatically scalable application. On to the discussion points!
Top 10 Big-Picture Discussion Points: Scale, Availability, and Monitoring Decisions
To have your application work effectively with scale, it must be properly designed to work in a horizontal scaling cluster. This means it can’t have any local dependencies; all depended micro-services in services must be hosted externally to the Web server or application server. No data must be stored on the instance—just the operating system, application code, middleware, and other generic components that are installed on every other instance in the cluster. This also means that a lift and shift approach from on-premise to the cloud probably isn’t going to work because the odds are close to 100% that there will be dependencies in that application that will have to be stripped out.
It’s time to discuss what you have and where you need to go regarding your applications that are moving to the cloud.
Do you have golden images for your Web and application servers?
Can you replace existing third-party load balancers with ELB services?
Are your applications hosted in public subnets?
Should you be tracking CloudTrail APIs using CloudWatch log groups and metric filters?
Can CloudWatch help monitor your on-premise servers with the installation of the CloudWatch agent?
Can launch configurations help you plan your auto scaling deployments?
Are billing alarms enabled to manage your developer’s project costs?
Can Lambda functions be created to help automate solutions with CloudWatch alerts?
Will step scaling policies help improve application performance?
Will step scaling policies help you save even more money?