
This chapter describes how you create and present existing and design profiles for subdivision roads. Existing ground profiles typically represent the current topography below the location of the proposed subdivision alignments. Design profiles, or layout profiles, are used to set the design and construction grades for the roads in a subdivision. You present profile data by creating profile views.
The Creating Surface Profiles and Profile Views lesson describes how you create surface profiles and profile views. The Creating Layout Profiles lesson describes how you create design layout profiles using commands on the Profile Layout Tools toolbar. The Editing Profile Geometry lesson describes how you edit layout profile geometry graphically, by editing the table in Panorama, or by using the entity creation commands. Finally, the Labeling Profiles and Profile Views describes how label profiles and profile views to ready the drawing for review.
This lesson describes how to create surface profiles and profile views. Surface profiles are created for alignments and typically show the nature of the existing terrain along the alignment. Profile views are the grid objects that show surface profile and other types of profile data.
Surface profiles are dynamic objects that automatically update if either the horizontal alignment geometry changes or the surface changes. This makes it very easy to adjust the horizontal alignment to best match the existing terrain.
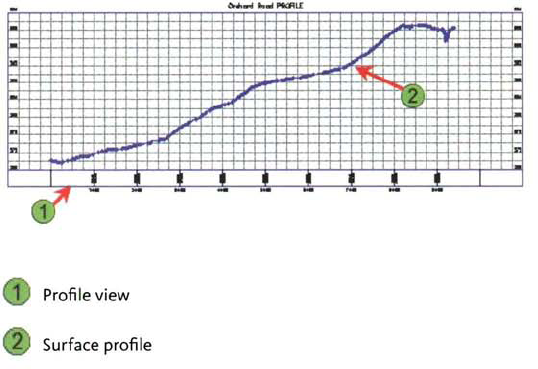
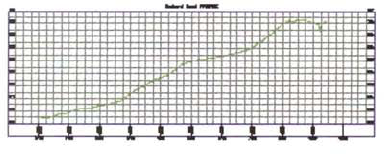
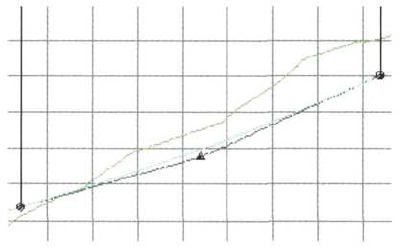
A profile view with a surface profile is shown in the following illustration.
After completing this lesson, you will be able to:
Describe surface profiles.
Explain profile views.
List the guidelines for creating profiles.
Create a profile from a surface and create a profile view.
After you create an alignment, the next step in the road design process is to generate the surface profile. The surface profile helps the designer determine the layout of the design profile. In many instances, engineers strive to design road profiles to match the surface profiles as closely as possible to minimize the amount of earthworks on a project. Surface profiles are dynamic profiles and automatically update when you edit the alignment geometry or station data, or change the surface.
Surface profiles are objects used to represent terrain data along a horizontal alignment. Surface profiles are displayed in profile views.
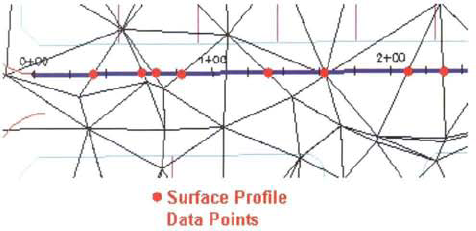
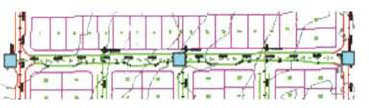
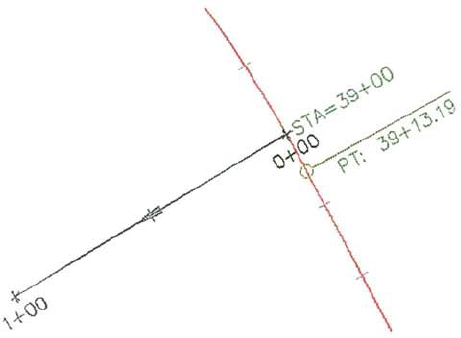
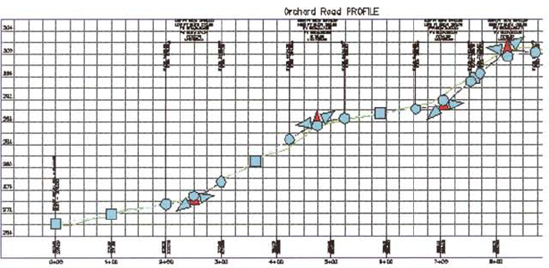
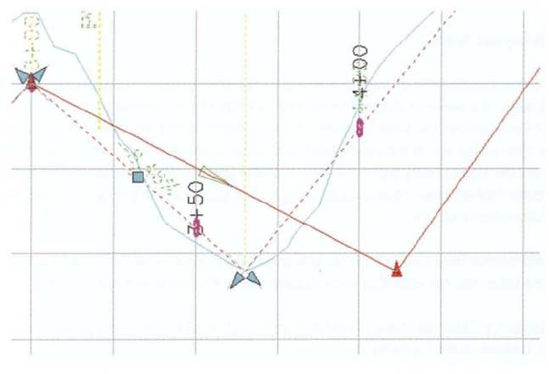
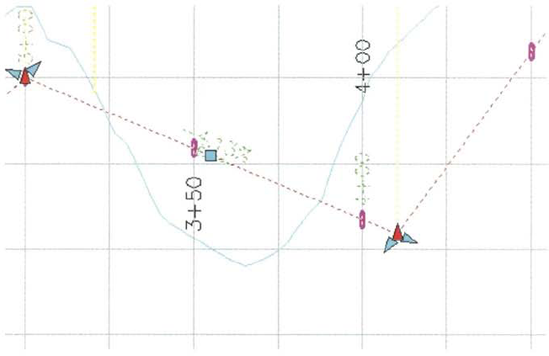
Surface profile data points are generated wherever the alignment intersects a TIN line. The following illustration shows the locations where the data points are sampled when a surface profile is created for an edge of pavement alignment.
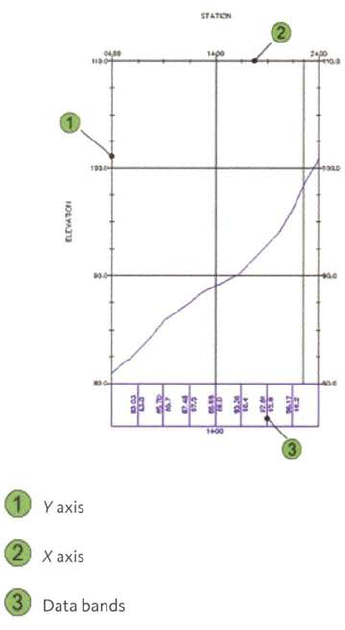
You need a profile view to display surface profile and other types of profile data.
A profile view is a graph that includes a grid, X and Y axes, and data bands that displays profile view data. The X axis represents horizontal distance along the selected horizontal alignment or other linear feature. The Y axis represents elevations. You can configure data bands to contain annotations such as elevation data, stations, and cut/fill depths.
You control the appearance of a profile view using profile view styles. The profile view style also controls the following:
Vertical exaggeration of the profile view object.
Major and minor grid spacing.
Axes labeling.
Profile view title annotation.
Colors, linetypes, and lineweights of profile view components.
You can customize the components and appearance of the graph. You can change the display elements of a profile view, such as title format, axis annotation, and grid appearance. You can set the view to clip grid lines above the profile line or to hide grid lines.
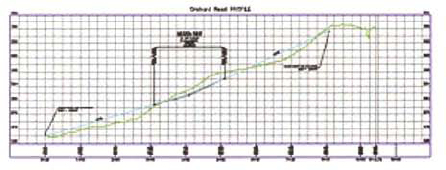
In the first illustration, notice that the surface profile is at a significant grade. The profile view style shows the profile data at a 10:1 vertical exaggeration. This may result in difficulties fitting the profile data in the profile portion of a plan and profile construction drawing.
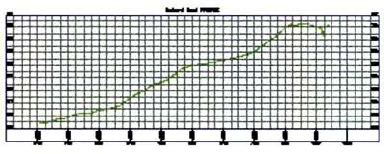
For steep terrain, a 10:1 vertically exaggerated profile view would not show the entire profile within a paper space viewport. To address this issue, the designer would create and assign a profile view style that reduces the vertical exaggeration to 5:1. The profile view with the new profile style assigned is shown in the second illustration.
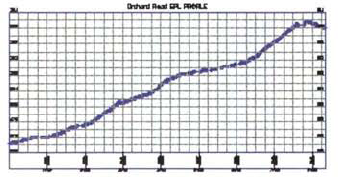
Profile view with 10:1 vertical exaggeration
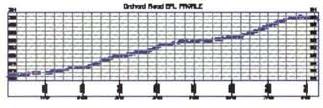
Profile view with 5:1 vertical exaggeration
Keep the following guidelines in mind when creating profiles.
For surface profiles to be accurate, you must ensure that the surface is accurate. This means using breaklines and excluding points that do not represent the lay of the land from the surface.
When you move the profile view, profile data in the profile view moves with the profile view.
If you change the vertical exaggeration of a profile view by assigning a new profile view style, profile data in the profile view updates accordingly.
In this exercise, you create a surface profile using an alignment and an existing surface. You also create a profile view.

Open Site Design - Profilesl_surface_profiles.dwg (M_surface_profiles.dwg).
First, you display the existing ground surface as contours.
In Toolspace, on the Prospector tab:
Click to expand Surfaces.
Right-click Existing Ground. Click Surface Properties.
In the Surface Properties Existing Ground dialog box, Information tab, for Surface Style, click Contours 1' and 5' Background (Contours 1m and 5m Background). Click OK.
The surface, with contours showing, is displayed. Note that this step is not necessary to create a surface profile.
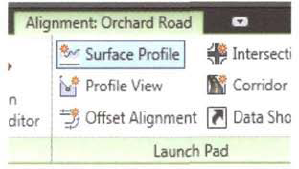
In the drawing, select the Orchard Road centerline alignment. Orchard Road is the west- to-east road that intersects with the three cul- de-sac roads.
On the ribbon, Launch Pad panel, click Surface Profile.
In the Create Profile from Surface Dialog box:
For Alignment, click Orchard Road.
Under Station Range, do not make changes.
The entire alignment will be sampled.
Under Select Surfaces, Existing Ground is selected because it is the only surface in the drawing.
Click Add.
Under Profile List, stretch the Name column to see the profile name.
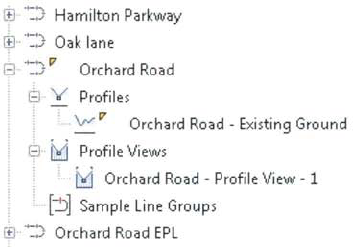
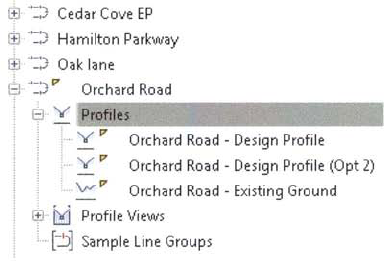
At this point, you can add more profiles by changing the alignment or adding offset alignments to Orchard Road by selecting the Sample Offsets check box. You can also create profiles without creating a profile view in the drawing. A profile and a profile view are separate objects, as shown in the Prospector tab.
Next, you create the profile view.
In the Create Profile from Surface dialog box, click Draw in Profile View.
The Create Profile View wizard opens. Note the various settings in the steps as you move through the wizard.
On the General page, for Select Alignment, select Orchard Road. Click Next.
You can change the range of the alignment to view.
On the Station Range page, click Next.
On the Profile View Height page, click Next.
On the Profile Display Options page, click Next.
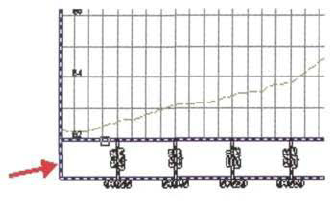
The data bands refer to the information displayed above or below the profile view. Data bands can show many different types of data including profile, alignment, pipe network and superelevation.
Click Next to display the Profile Hatch Options.
You can hatch areas between multiple profiles to graphically show areas of cut and fill. In this exercise, because there is only one profile, hatching is not possible.
Click Create Profile View.
At the Select Profiie View Origin prompt, click to the right of the plan view of the site to set the origin of the profile view.
The profile view is created in the drawing.
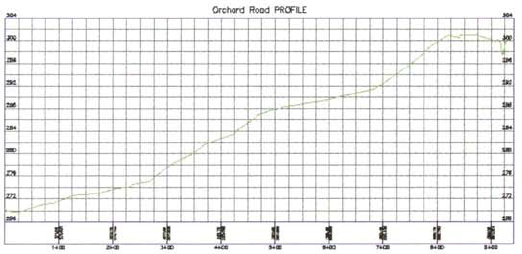
Zoom in to the profile view to review the surface profile data.
The profile view shows the existing elevation change from west to east along the centerline of Orchard Road. The data band shows the station, and the existing and finish elevations, which are the same because there is no design profile. You can show multiple profiles in the same view, which can be very helpful when comparing the existing and the design profile elevations and grades.
Next, you examine profiles and profile views in Prospector.
In Prospector:
Click to expand Alignments, Centerline Alignments, Orchard Road.
Click to expand Profiles and Profile Views.
Recall that the alignment and the profile are dynamically linked.
At the command line, enter VPORTS. Press ENTER.
In the Viewports dialog box, Named Viewports tab, for Named Viewports, click Plan & Profile, Click OK.
If necessary, adjust the zoom and pan so that the Orchard Road plan view is in the top viewport and the profile view is in the bottom viewport.
In the top viewport, select the Orchard Road alignment.
Ctick a grip and move the mouse slightly to the north. Click again to move the alignment.
Notice the profile change in the lower viewport.
At the command line, enter UNDO to undo the alignment change. Press ENTER.
Enter VPORTS. Press ENTER.
In the Viewports dialog box, on the New Viewports tab, under Standard Viewports, select Single. Click OK.
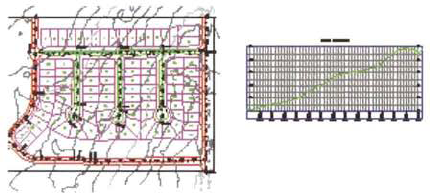
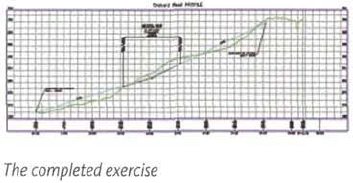
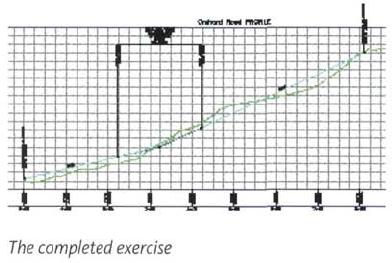
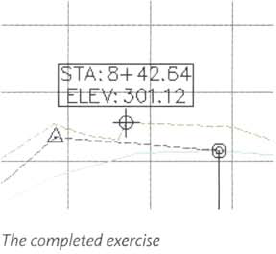
The drawing for the completed exercise appears as follows.
Close the drawing. Do not save the changes.
This lesson describes how you create design layout profiles using commands on the Profile Layout Tools toolbar. It also describes how you use transparent commands to help you create profile geometry using grades, stations, and elevations.
After the designer creates a surface profile, the next step in the road design process is to create a layout profile. The layout profile represents the design profiles and consists of tangents and vertical curves. You create layout profiles by using commands on the Profile Layout Tools toolbar.
After completing this lesson, you will be able to:
Describe layout profiles.
Explain when to use transparent commands.
List guidelines for creating layout profiles.
Create a layout profile.
Unlike dynamic surface profiles, layout profiles are static and do not update with changes to the alignment. You can create layout profile geometry by converting existing AutoCAD® lines and splines. You can also create layout profiles by inputting stations, elevations, and vertical curve data in a tabular editor. There are a number of useful commands available on the Profile Layout Tools toolbar that help you create a layout profile.
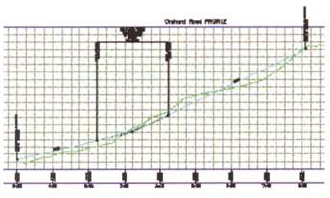
The following illustration shows a layout profile in the profile view. The surface profile is also present in the profile view.
Layout profiles represent the finished vertical alignment that final road construction and grading is based on. The layout profile is also known as the vertical alignment or design profile and consists of tangents and vertical curves.
You can lock a PVI at a specific station and elevation so that it cannot be moved by edits to adjacent entities. This is often done in intersections, where a side road profile is locked to the crown and edge of pavement elevations of the main road. If you unlock a dynamic PVI for one road in an intersection, you break the link to the profile of the other road.
After you create and display the surface profile in the profile view, you then create the layout profile, which represents the design of the vertical alignment for the road.
You define your layout by selecting points of vertical intersection (PVIs), which are connected using tangents either with or without curves. If you are drawing tangents with curves, you can choose standard curve settings to create an initial curve design. You can edit the curve values and other profile layout properties later to generate a more precise design.
When you create a layout profile, you select a profile style and label set. You can later change the profile style and label set to suit the phase of the road design. For example, you may want fewer labels as you lay out the profile and more labels when you are preparing the design for construction documents.
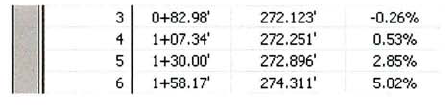
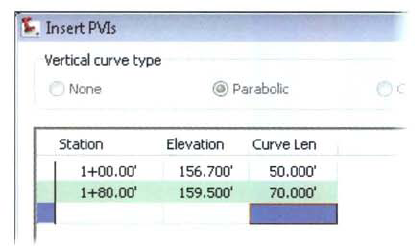
In many instances a designer needs to reproduce design profile data that already exists on a hard-copy plan. The hard-copy plan would show PVI stations, PVI elevations, vertical curve lengths, and tangent grades.
You can use the Insert PVIs Tabular command on the Profile Layout Tools toolbar to create a layout profile, as shown in the following illustration.
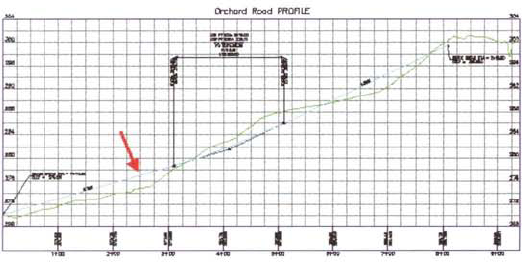
The following examples show a profile view and surface profile before and after the layout profile is created.
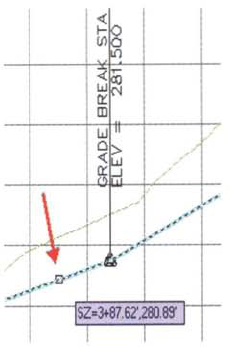
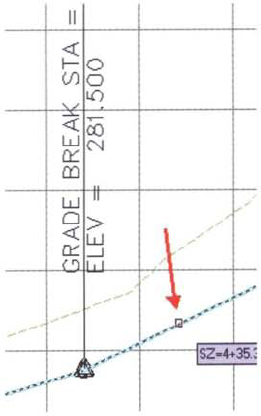
The following illustration shows a profile view with a surface profile. When you create the layout profile, you can reference stations, elevations, and grades in the profile view using the commands on the Transparent Commands toolbar.
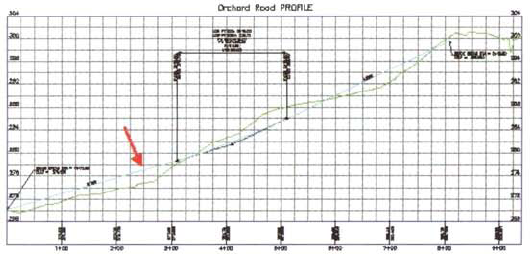
In this illustration, the layout profile is drawn in the profile view with PVIs and vertical curves. You can configure the profile to automatically place labels at standard points of reference as you create it.
Transparent commands are designed to simplify drawing tasks. Transparent commands can be used to reference locations in both plan and profile views. You use the profile transparent commands to create profile geometry by referencing stations, elevations, and grades.
The Transparent Commands toolbar is shown in the following illustration.
Transparent commands are commands that are issued from within another command. You can use transparent commands to locate objects based on known information. These locations are usually identified in the context of a larger operation, such as while drawing a line within a parcel. You can use transparent commands when creating any type of Civil 3D® object such as points, parcels, profiles, or alignments.
For more information, see "Civil Transparent Commands" in Help.
Keep the following guidelines in mind when you create layout profiles.
Layout profiles are static, not dynamic. Therefore, when you edit horizontal alignment geometry, you also need to edit the layout profile.
Layout profiles must be created in the direction of increasing change.
In this exercise, you create a layout profile.
Open Site Design - Profilesl_layout_profiles.dwg (M_layout_profiles.dwg).
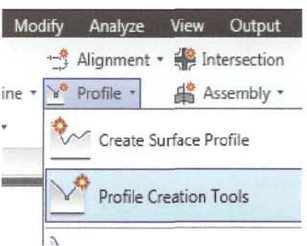
On the ribbon, Home tab, Create Design panel, click Profile > Profile Creation Tools.
At the Select Profile View prompt, in the drawing area, click the Orchard Road profile view.
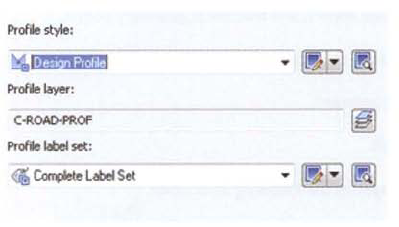
In the Create Profile - Draw New dialog box:
For Name, enter Orchard Road - Design Profile.
Notice the profile style is set to Design Profile and the profile label set is set to Complete Label Set.
Click the Design Criteria tab. Notice that you can use criteria-based design to ensure the design profile meets the minimum requirements.
Click OK.
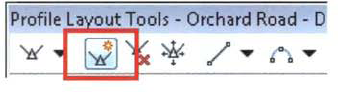
The Profile Layout Tools toolbar appears. The following steps use these tools to create the design profile directly in the profile view in the drawing. You specify curve settings and place tangents to create the proposed vertical layout for Orchard Road. If you make a mistake as you design the profile, you can use the Undo or Redo buttons on the right side of the toolbar.
First, inspect the vertical curve settings.
On the Profile Layout Tools toolbar, click Curve Settings.
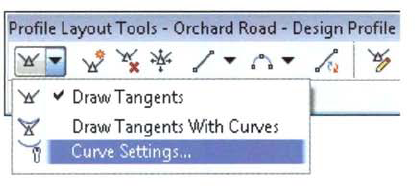
In the Vertical Curve Settings dialog box:
Review the options for the vertical curve settings.
Under Crest Curves, for Length, enter 100 (30 m).
Under Sag Curves, for Length, enter 100 (30 m).
Click OK.
Parabolic curves are most commonly used for vertical road curves, but you can modify this setting. Both crest and sag curves can either be designed using a specified length or a K value.
On the Profile Layout Tools toolbar, dick Draw Tangents with Curves.
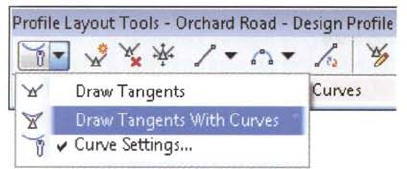
There are multiple methods for creating layout profiles. The Draw Tangents with Curves method is very easy to use. You simply click in locations where you would like a PVI (point of vertical intersection).
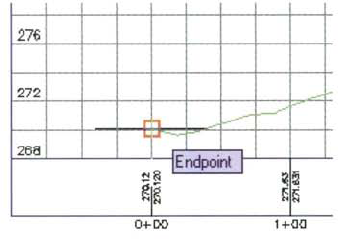
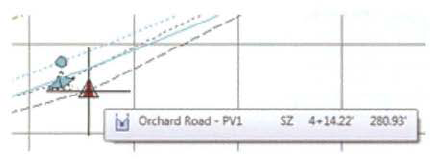
At the Specify Start Point prompt, use the Endpoint object snap and click the western end of the surface profile.
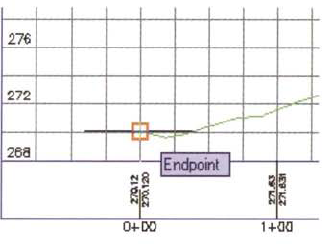
As you move the mouse away from the start point, the profile stretches, awaiting the position of the next PVI. Each point that you click will be a PVI, the end of one tangent and beginning of the next. Civil 3D automatically fits the curve to transition between the two tangents.
Normally, the goal is to position these points so that the areas of cut and fill nearly balance, although the site grading near the alignment may influence the final balance. The profile being designed is the first attempt at the finished vertical grade. Be careful when using object snaps during this procedure.
Zoom out to give a better view of the profile.
Using your best judgment, click approximately four or five evenly spaced locations for PVIs along the profile view, ending with a click at the endpoint of the profile.
Make sure you do not select PVI locations too close together. Remember that the specified vertical curve length is 100' (30 m). This means that you need a minimum distance of 100' (30 m) between consecutive PVIs. Civil 3D shows a preview of the vertical curve before you select the next PVI.
Press ENTER when finished. The layout profile is created with curves and labels.
Zoom in to a section of the layout profile.
Notice that the tangent slopes are labeled as percent slopes. Also note that the vertical curve geometry points and data are labeled.
Close the Profile Layout Tools toolbar.
Next, you use a different method to create a second layout profile. First, you suppress the display of the Orchard Road- Design Profile.
In the drawing area, select the profile view.
On the ribbon, click Profile View Properties.
In the Profile View Properties dialog box, Profiles tab, for the Orchard Road Design Profile, clear the Draw check box. Click OK.
The Orchard Road - Design Profile layout profile is removed from the profile view. You can always reverse this process.
On the command line, enter -toolbar. Press ENTER.
At the Toolbar Name prompt, enter transparent_commands. Press ENTER.
When prompted to enter an option, enter S. Press ENTER. The Transparent Commands toolbar is displayed.
On the ribbon, Home tab, Create Design panel, click Profile > Profile Creation Tools.
At the Select Profile View prompt, select the Orchard Road profile view.
In the Create Profile - Draw New dialog box, for Name, enter Orchard Road - Design Profile (Opt 2). Click OK.
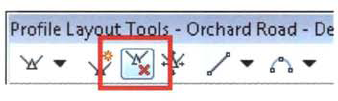
On the Profile Layout Tools toolbar, dick Draw Tangents (the first button to the left on the Profile Layout Tools toolbar).
At the Specify Start Point prompt, using the Endpoint OSNAP, click the left end of the Existing Ground profile.
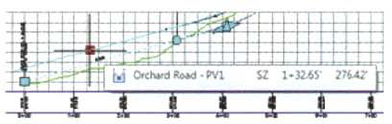
At the Specify End Point prompt, on the Transparent Commands toolbar, click Profile Station Elevation.
At the Select Profile View prompt, select the Orchard Road profile view.
At the Station prompt, enter 410 (145 m). Press ENTER.
At the Elevation prompt, enter 281.5 (86.5 m). Press ENTER.
Press ESC to cancel the current Transparent command.
On the Transparent Commands toolbar, click Profile Grade Length.
At the Grade prompt, enter 4.5. Press ENTER.
At the Length prompt, enter 400(120 m). Press ENTER.
Press ESC twice to cancel the current Transparent command and the Create Tangents command.
Next, you create a vertical curve.
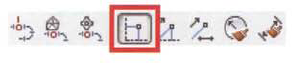
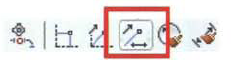
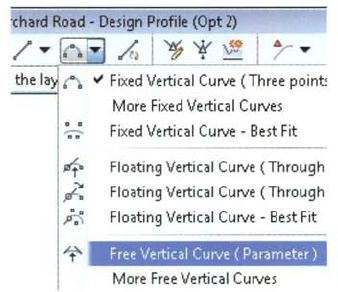
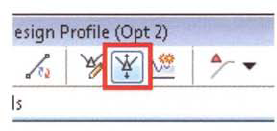
On the Profile Layout Tools toolbar, click Free Vertical Curve (Parameter).
Using this procedure, you dick the tangent before the PVI, and then dick the tangent after the PVI.
At the First Entity prompt, select the tangent to the left of the middle PVI.
At the Next Entity prompt, select the tangent to the right of the middle PVI.
At the Curve Length prompt, enter 200 (60 m). Press ENTER twice.
A vertical curve is created between the two tangents.
Close the Profile Layout Tools toolbar.
Next, you examine the profiles in Prospector.
In Toolspace, on the Prospector tab:
Click to expand Alignments, Centerline Alignments, Orchard Road, and Profiles.
Under Profiles, note the Orchard Road profile data.
Using grips, reposition the PVI labels at the beginning and end of the layout profile.
The completed drawing appears as follows.
Close the drawing. Do not save the changes.
This lesson describes how to edit the vertical geometry of layout profiles. You can edit layout profiles graphically, using the table in Panorama, or by using profile creation tools on the Profile Layout Tools toolbar. Profile entities are the individual components of a layout profile, specifically the tangents and the vertical curves.
Graphical editing of layout profiles involves using grips. When you use grips to edit layout profiles, vertical curves maintain tangency. You can also use tabular editing tools to manually change PVI elevations and stations, vertical curve lengths, K values, and grades. Profile layout tools enable you to change, delete, and add vertical alignment subentities. When you edit a profile, associated annotation is automatically updated.
After completing this lesson, you will be able to:
You edit a layout profile graphically using tools such as grips and transparent commands. You can also make more precise edits to the layout profile geometry by changing data in a table such as grades, elevations, stations, and vertical curve design parameters.
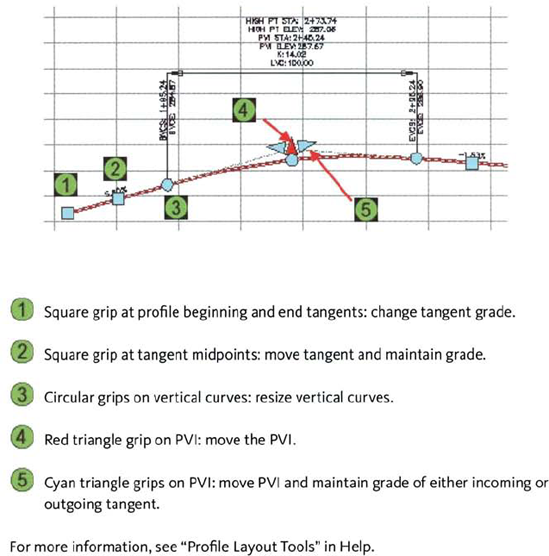
The following illustration shows the grips that are displayed on a profile layout when you select it. You use the grips to move PVIs, move PVIs and maintain the entering or existing grade, change tangent locations, and change vertical curve lengths. When you move a PVI or tangent locations, connected vertical curves maintain their tangency.
You use grips to graphically edit a layout profile. When you edit a layout profile with grips, you are editing the profile object. Therefore, any associated annotation and tabular data automatically updates. You click the layout profile to show the graphical editing grips.
Grips are displayed in the following illustration.
The following illustrations show you how to use grips to change the location of a PVI. Click a grip to make it active, as shown in the following illustration.
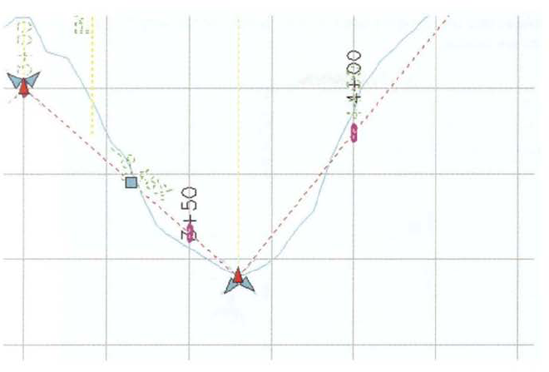
When the grip is active, you can move it to a new location, as shown. You can also select a new location more precisely using Object Snap or profile Transparent commands.
Grips are displayed until you cancel the selection of the profile. The following illustration shows the point at its new location.
You can also edit a layout profile by using commands on the Profile Layout Tools toolbar. In the drawing area, select the layout profile, right-click and click Edit Profile Geometry to show the Profile Layout Tools toolbar. You have a number of layout profile editing tools on the Profile Layout Tools toolbar. You can use any of the tangent and vertical curve commands to add profile entities. You can also use the Delete Entity button to remove profile entities. When you edit a profile with commands on the Profile Layout Tools toolbar, the graphical display of the profile and associated annotation automatically update.
From the Profile Layout Tools toolbar, you can also access the Panorama window to edit layout profile data in a table. You can view data in the table as either PVI -based or entity-based.
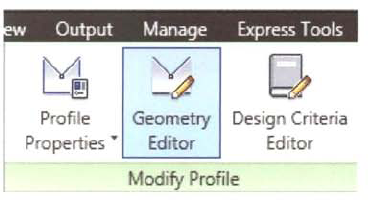
The Profile Geometry Editor command is available on the ribbon when the layout profile is selected. This is shown in the following illustration.
Keep the following guidelines in mind when editing profile layouts.
Layout profile grips work exactly the same as grips on all AutoCAD entities. Graphically editing a profile with grips is a three-step process. First click: select the layout profile. Second click: select the grip. Third dick: reposition the grip.
You can use transparent commands to help you to graphically edit the profile.
Use the Tabular Editor in the Panorama window to round profile tangent grades, vertical curve lengths, and vertical curve K values.
In this exercise, you edit a layout profile using graphical and tabular methods.
Open Site Design - Profilesl_edit_profile_geometry.dwg (M_edit_profiie_geometry.dwg).
In the profile view, zoom to the vertical curve.
In the drawing area, select the layout profile. Review the different grips.
Click the middle PVI arrow grip. Move the mouse. Click again to move the PVI to the new location. Notice the behavior of the associated tangents.
On the Quick Access toolbar, click Undo.
Select the layout profile.
To the side of the PVI. click the left or right arrowhead grip. Move the mouse. Click to reposition the PVI.
The PVI position is moved directly along one of the tangents.
Click Undo.
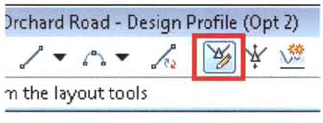
Select the layout profile. On the ribbon, Modify Profile panel, click Geometry Editor. The Profile Layout Tools toolbar opens.
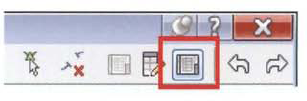
On the Profile Layout Tools toolbar, click Profile Grid View.
The Profile Entities Panorama window opens, showing all of the geometric information about the profile.
Change the grade in values and round the grades to the nearest percent. Note that the layout profile dynamically updates after you make the change.
Click the arrowhead grip on the PVI, Move the mouse. Click to move the PVI.
In Panorama, notice the change in the value for the station and elevation of the PVI that was moved. Close Panorama.
Select the profile. Click the round grip at the beginning of the vertical curve. Move the mouse. Click to modify the curve length.
Select the profile. Click the square grip at the tangent midpoint. Move the mouse. Click to reposition the tangent.
The PVI position can be modified using grips or by entering a station and elevation value in the Panorama window. You can also move, delete, and add PVIs using commands on the Profile Layout Tools toolbar.
On the Profile Layout Tools toolbar, click Insert PVI.
At the Specify Point for New PVI prompt, click a location in the profile view for a new PVf. Press ENTER.
Notice that a curve is not automatically positioned, but a grade break label is inserted.
On the Profile Layout Tools toolbar, click Delete PVI.
At the Pick Point Near PVI to Delete point prompt, click near the new PVI. Press ENTER.
Notice that the PVI and label are removed.
On the Profile Layout Tools toolbar, click Insert PVIs - Tabular.
In the insert PVIs dialog box:
Under Vertical Curve Type, click Parabolic.
Notice the Curve Length box is added. You can add the PVI and curve parameters directly in this box.
Click Cancel.
On the Profile Layout Tools toolbar, click Raise/ Lower PVIs.
In the Raise/Lower PVI Elevation dialog box:
For Elevation Change, enter 0.5'(0.2 m).
You can raise or lower the entire profile or just a station range.
Click OK.
The entire profile is raised 0.5 ft (or 0.2 m).
Close the drawing. Do not save the changes.
This lesson describes how to label profiles and profile views. Much of the labeling on a profile view is generated directly from the profile view style. The profile view style displays labeling on both axes and on the profile view title. You can also add station/elevation and depth labels to the profile view as an independent operation.
You label surface profile data after the surface profile has been created. Layout profiles are labeled when the profile is created, or after the profile has been created. You can label profiles with stations, tangent grades, vertical curve data, and grade breaks. You can also label horizontal alignment geometry on the profile.
Profile label sets contain the individual profile label types. All profile view and profile labels automatically update when the profile data changes.
After completing this lesson, you will be able to:
Describe profile and profile view labels, and label sets.
Explain how you edit profile labels.
Use guidelines to label profiles and profile views.
Label profiles and profile views.
When you create a layout profile, you can automatically label it using label styles. Profile label styles can be configured to mark any of the following standard points along the profile:
Profile label sets are the collection of individual profile label types. On the Settings tab of the Toolspace window, you can find the profile label sets by expanding the Profile, Label Styles, and Label Sets trees.
You can label layout profiles with tangent grades, vertical curve data, grade break data, alignment stationing, and horizontal alignment geometry label types.
Individual label types can be applied to a layout profile. Alternatively, if the layout profile has already been created, you can add profile labels. A common method is to combine individual label types into a label set and apply the label set to the layout profile. This enables you to standardize on collections of labels that you would regularly apply to profiles. When you create a layout profile, you can choose a label set to apply to the profile.
When you create a layout profile, you choose a label set to apply to the profile, as shown in the following illustration.
Label sets are collections of profile labels. You combine vertical curve, tangent, grade break, station, and horizontal alignment geometry labels in a label set. When you create a layout profile, you can apply the label set to the profile. The label set can also be applied to the profile afterward.
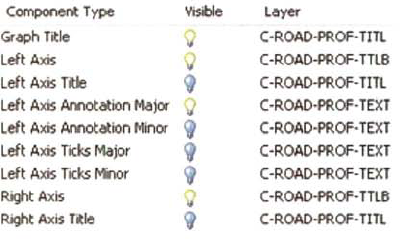
The profile view style accounts for much of the labeling on a profile view. With the profile view style, you can label the horizontal axes, the vertical axes, and the title. Once you change a profile view style, all profiles view that reference that style automatically update to reflect the new display parameters. Use the Display tab on the Profile View Style dialog box to determine which labeling components of the profile view are displayed, as shown in the following illustration.
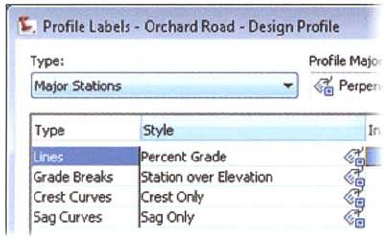
When you apply profile labels to a profile, the default placement of the profile labels is determined in the profile label set. In the Profile Label Sets dialog box you can specify the following:
Types of labels to be added to the label set, which include sag curves, crest curves, tangents, major and minor stations, grade breaks, and horizontal geometry points.
Style of each type of label to be included in the label set.
Starting and ending stations for label placement.
Default placement options for the labels.
Part of the Profile Label Set dialog box is displayed in the following illustration.
You can change the position of the profile labels after they are created. You either edit the position of the labels graphically using grips, or you edit the position of the profile labels in a table. The latter option displays a dialog box similar to the Profile Label Set dialog box, where you change the Dimension Anchor option and Dimension Anchor value in a table.
When you edit profile labels, you apply a label set or apply individual labels to the profile.
You can use the following Dimension Anchor options:
Distance Above and Below PVI.
Fixed (Absolute) Elevation.
Distance Relative to the Profile View Top and Profile View Bottom.
When you use grips to modify the position of the labels, drag the labels to their new locations. The Label Dimension Anchor grip enables you to move the entire vertical curve up and down. The square grip is used to move the profile label so that it adopts its dragged state display property, as shown in the following illustration.
Keep the following guidelines in mind when creating profile labels and label sets.
You can create a profile label set called None, which can be applied to a layout profile when you first create it. This action makes it easier to visualize your design geometry.
Profile styles and label styles should be created and stored in your drawing template. All new drawings created with the drawing template carry the styles forward.
You can set the default profile view, and profile styles and label styles, by modifying the command settings.
In this exercise, you add labels to profiles and profile views. You also modify label styles for both objects.
Open...Site Design - Profilesi_label_profites_profileviews.dwg (M_label_ profiler_profileviews. dwg).
In Toolspace, Settings tab:
Expand Profile, Label Styles, Label Sets.
Right-click Complete Label Set, click Edit.
In the Profile Label Set - Complete Label Set dialog box, Labels tab:
Review the four types of labels included in this label set: Lines, Grade Breaks, Sag Curves, and Crest Curves.
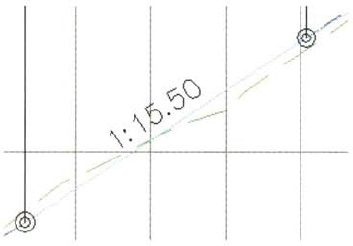
For Lines, in the Style column, click the Style icon.
Select Slope 1 in X from the list.
Click OK twice to close all dialog boxes.
This change affects the Complete Label Set only. To see changes in the profile labels, you need to import the label set for that profile. Another option is to modify the profile labels in use directly.
In the drawing area, select the layout profile.
Right-click, click Edit Labels.
In the Profile Labels - Orchard Road Design Profile dialog box:
Click Import Label Set.
Select Complete Label Set from the list.
Click OK twice to close all dialog boxes.
Zoom in to a tangent on the profile and view the change in the label style.
Each profile can be modified independent of the label set.
Select the layout profile. Right-click, click Edit Labels.
In the Profile Labels - Orchard Road - Design Profile dialog box:
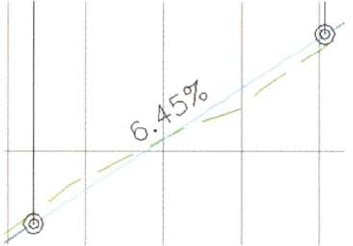
For Lines, click the Style icon.
Select Percent Grade from the list.
Click OK twice to close both dialog boxes.
Zoom in to a tangent grade label to view the different style.
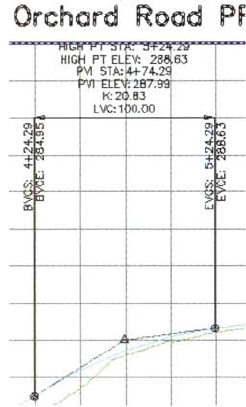
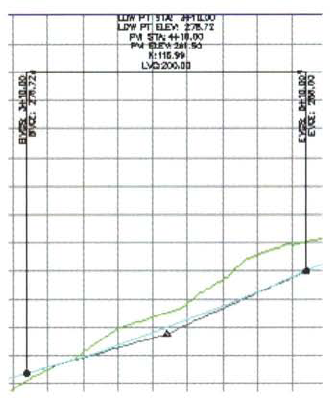
In the drawing area, review the labeling for the vertical curves.
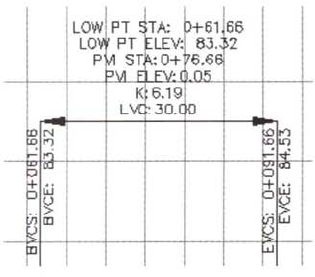
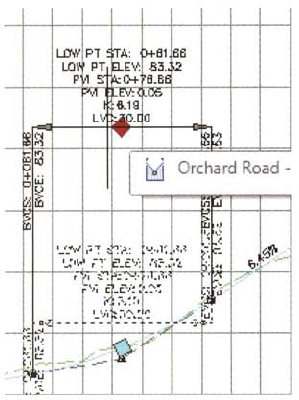
BVCS is the Beginning Vertical Curve Station. BVCE is the Beginning Vertical Curve Elevation. Similarly, EVCS and EVCE are the same values for the end of the curve. Low point and PVI station and elevation are included, as well as K value and the LVC (Length of Vertical Curve).
In Settings:
Expand Profile, Label Styles, Curve, Crest and Sag.
Right-click Crest Only. Click Edit.
In the Label Style Composer - Crest Only dialog box, Layout tab.
For Component, click PVI Sta and Elev.
Under Text, Color, click in the Value cell. Click Color Palette.
In the palette, click red (color i). Click OK.
Notice the change in the Preview box to the right.
Click OK to close the dialog box.

Zoom in to a crest curve.
On the profile:
Select a vertical curve label.
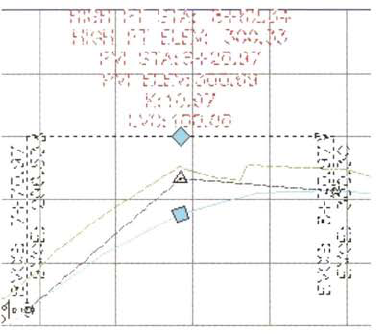
Click the diamond grip on the dimension line. Move the entire label up and down with in the profile view.
Click the square grip on the curve.
Reposition the label to show its dragged state display property. Next, you examine the profile view labels.
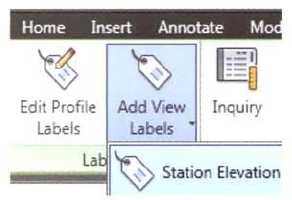
In the drawing area, select the Orchard Road profile view.
On the contextual ribbon, ciick Add View Labels > Station Elevation.
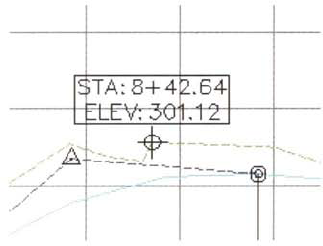
When prompted to:
Select the profile view, click the profile view grid.
Specify station, move the mouse left or right, then click to set the desired station for the label.
Specify elevation, move the mouse up and down, click to set the elevation for the desired point to be labeled.
Press ESC to end the command.
Close the drawing. Do not save the changes.