Monitoring Cassandra is one of the most important tasks as an administrator. Cassandra provides a lot of useful metrics to help us understand a problem way ahead of time. For example, if your compaction time is constantly increasing, the SSTable size is increasing in exponential sizes, or if memory usage is increasing without the GC cleaning most of it, it is important for us to know about it and address the same.
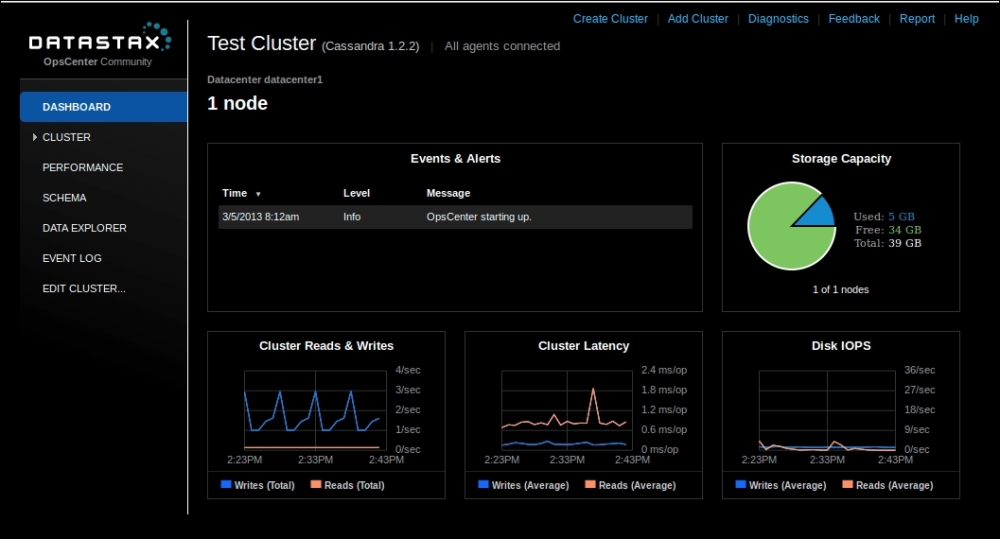
DataStax OpsCenter simplifies Cassandra monitoring and the management of Cassandra clustering the data infrastructure. OpsCenter is included as part of the DataStax distribution. It allows administrators, architects, and developers to manage, monitor, and control even the most complex database workloads with point-and-click ease from a centralized web browser. More details can be found at http://www.datastax.com/.
OpsCenter provides a good UI functionality of the
nodetool command and collects the JMX monitoring data, and plots the data in intuitive ways. OpsCenter has both a community and enterprise version.
Cassandra supports basic JMX monitoring, and hence there are varieties of tools that can be used to monitor the cluster. A simple Google search will reveal a variety of JMX monitoring tools; depending on your preferences, you might be able to find one you like. Hence, Cassandra can fit very well into any organization's enterprise monitoring solutions.
The node tool netstats,
compactionstats, tpstats, and cfstats commands are invaluable in troubleshooting an issue. For example, if you have a spike in the latency, the first thing to refer is cfstats or the column family JMX metrics collected over a period of time. Basically, you might want to start by reasoning what changed causing this spike:
- Is there a spike in the number of requests per second?
- Are all the nodes up?
- Are there a lot of hints replayed?
- Is there a hot key? (check the average column size per column family)
- Is compaction spiking causing additional latencies?
- Are there a lot of threads pending for IO operation? Flush threads pending, read threads pending, and so on (if so, check IO wait time for disk issues)
- Is there a repair in progress? Is there a streaming in progress?
As you can see, monitoring the plain JMX can answer a lot of questions about what is happening in the cluster. By now, as an administrator, you might know the value of the historical data of the cluster; it will allow you to provision and also reason the clusters performance:
- Push versus Pull: Starting from Version 1.2, Cassandra switched to Yammer metrics, which provides a good extension to ganglia (http://ganglia.sourceforge.net). With little bit of development, you can customize the way the data is pushed to the monitoring system of your choice. Most of the JMX monitoring systems available in the market use JMX polling to report the data back to the monitoring service.
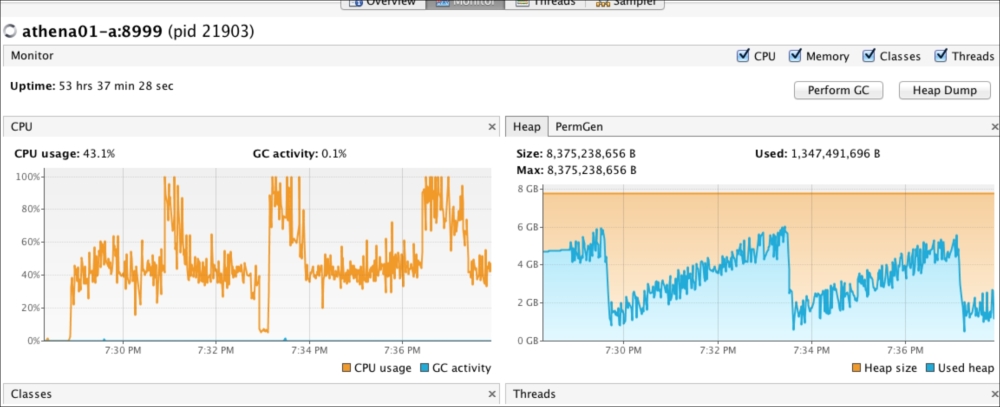
- JConsole and VisualVM: Java comes with Visual VM and JConsole which support basic Mbean monitoring and visualization of the basic metrics. VisualVM also helps in tuning the JVM. For example, in the following screenshot, note that the GC activity creates a saw-tooth pattern. If it doesn't, you might want to look into memory leaks.
- Mx4J: Mx4j is a Java JAR file. If placed in the classpath, it will report the metrics via HTTP and in turn be parsed via the
curlcommand, or can also be parsed by a complex SOAP parser.